
Draw on liquidity is the price target the market is most likely reaching toward on any given day. It answers the single most useful question in trading: where does price want to go next? Once you can name that magnet, your bias, entries, and targets all line up behind it.
This guide explains what draw on liquidity means, which targets qualify, and how to pick the daily draw before the session opens. So by the end, you will read a chart from the destination backward and stop guessing at direction candle by candle.
What Draw on Liquidity Means
Draw on liquidity, often shortened to DOL, is the pool of resting orders that price is being pulled toward. Think of it as gravity on the chart. The market rarely moves at random. Instead, it seeks out clusters of stops and pending orders, because that is where large positions can be filled.
Michael Huddleston, the Inner Circle Trader (ICT), popularized the phrase. In his model, every session has a likely destination, and the job of the analyst is to identify it early. So the draw is not a precise price to the pip. It is the direction and the target zone the day is biased to reach.
Contrast that with the way most beginners trade. They watch a green candle and buy, then watch a red candle and sell. Because they never named a destination, every move looks equally important. So they get whipsawed in both directions. The draw fixes this by giving one anchor for the day. Then each candle can be judged against that anchor rather than taken at face value.
Seeing the Draw on a Live Chart
Look at a concrete case. The chart shows EURUSD on the one-hour timeframe. The previous day’s high sits at 1.14287, with a band of buy stops above it. Price opened the session below that high, rallying up from 1.13988, and the whole day pointed toward it as the draw.

Now read the frame from left to right. Early trade drifted sideways, giving no obvious clue. Yet the resting liquidity above 1.14287 stayed untouched, so it acted as the magnet. Because that pool had not been taken, the higher-probability path led up toward it. Price climbed through the session and peaked near 1.14217, pressing toward the draw without yet sweeping it.
Why does naming the draw help so much? It flips your whole approach. Instead of reacting to each candle, you trade from the destination backward. So a dip becomes a chance to join the move toward the draw, not a reason to panic. Meanwhile, a rally against the draw becomes a warning rather than a signal. Indeed, most impulsive losses come from traders who never named a destination and simply chased whatever the last candle did.
The Main Draw on Liquidity Targets
Not every level qualifies as a draw. The market reaches for obvious, well-populated pools, so learn the handful that matter most. Each one collects a dense cluster of resting orders.
Previous Day High and Low
The previous day’s high (PDH) and previous day’s low (PDL) are the classic draws. Stops from the prior session rest just beyond them, and traders worldwide watch these levels. So price often gravitates to one or the other before choosing a direction for the new day. On a quiet day, reaching one of these two levels can be the entire move, which is why they anchor most session plans.
Session Highs and Lows
The high and low of the Asian range, and of the London session, form intraday draws. New York frequently reaches back to raid one of them. Hence a New York move often targets the London high or low left earlier that morning. The midnight open price, at 00:00 New York time, adds a further reference that helps grade whether price sits above or below fair value for the day.
Equal Highs and Equal Lows
Flat clusters of swing points hold the densest pools of all. These relative equal highs and lows act as powerful magnets, because retail stops stack tightly there. Our guide to equal highs and equal lows covers how those pools build and get swept.
Ranking the Targets by Strength
When several draws sit in the same direction, rank them. Equal highs and lows usually pull hardest, since their pools are the densest. Prior-day levels come next, because the whole market watches them. Session extremes rank last, as they hold thinner pools. So when a bullish day shows equal highs above the PDH, expect price to reach for the PDH first and the equal highs after. That order lets you set staged targets instead of one blunt exit.
So the draw is usually one of these three. The numbered routine below shows how to rank them and pick the one the day favors. The concept graphic beside it collects the main targets into one reference.
- Mark the PDH and PDL first. These are the strongest daily draws and the natural place to start.
- Add the session highs and lows. Note the Asian range extremes and the London high and low.
- Flag any equal highs or lows. Tight clusters of swings hold the heaviest pools.
- Check which side is untouched. The pool that has not been raided yet is the likelier draw.
- Confirm with the higher-timeframe bias. The draw should agree with the daily direction.
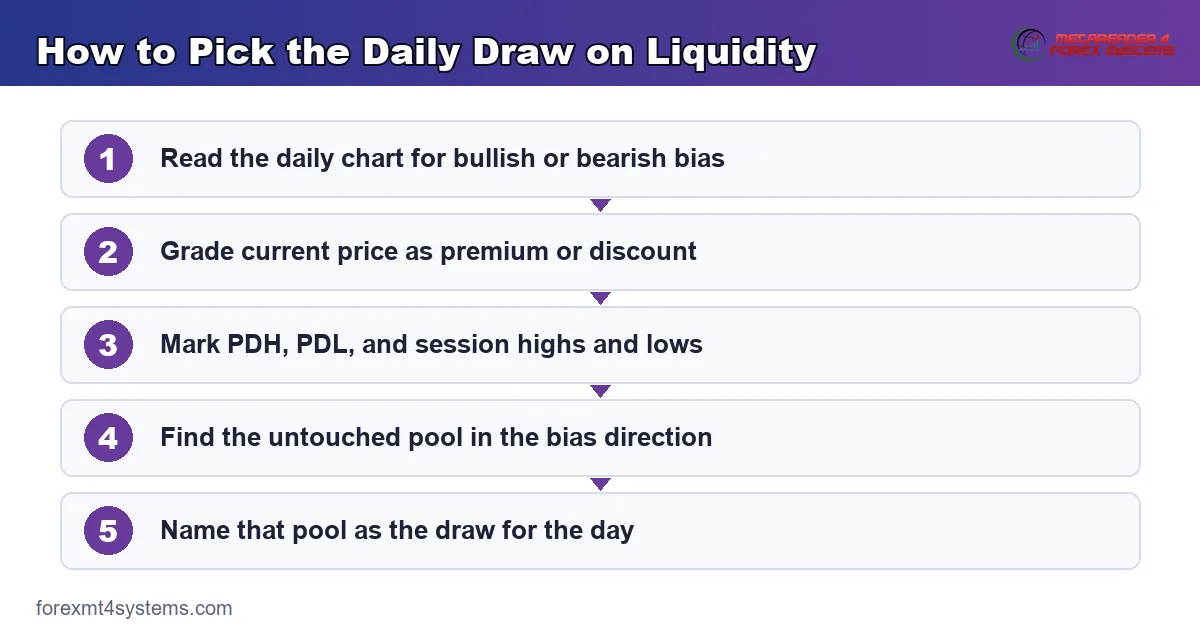
How to Pick the Daily Draw
Picking the draw is a routine you run before the session opens. It takes a few minutes and sets the frame for every trade that follows.
First, read the daily chart for bias. Our guide to ICT daily bias walks through that read in full. A bullish daily points the draw toward buy-side liquidity above, while a bearish daily points it toward sell-side liquidity below. So the bias and the draw are two halves of one read, and neither works alone.
Second, use premium and discount to grade the current price. When price sits in the discount half of the daily range, the draw usually leans up toward premium. Our guide to premium and discount explains that split. So a discounted price with bullish bias makes the upside pool the obvious target.
Third, find the nearest untouched pool in that direction. If the bias is up and the PDH sits overhead unswept, that high becomes the draw. Then everything else, from entries to stops, lines up behind reaching it.
Favor Fresh, Unswept Pools
One detail sharpens this routine. Ask which pool the market has not yet used. A high that already got swept yesterday holds far less pull today, since its orders are gone. Meanwhile, a level untouched for days has a full pool waiting. So favor fresh, unswept liquidity over stale levels. That single filter improves draw selection more than any indicator.
Also weigh time of day. A draw named at the Asian open may sit dormant for hours. Then London arrives and price finally reaches for it. So pair the draw with the session likely to resolve it, and do not expect a quiet hour to deliver a large move toward the target.
Where Draw on Liquidity Sits in the SMC Workflow
The draw is the compass for the whole routine. It sits at the top of the workflow and points every lower step in one direction.
First, name the draw from the daily and four-hour charts. Second, mark a point of interest, such as an order block or fair value gap, on the way to that draw. Our guide to buy-side and sell-side liquidity shows how to label which pool feeds the move, and it lives at buy-side and sell-side liquidity.
Then drop to the five-minute or fifteen-minute chart for the trigger. There you wait for a sweep against the draw, then a structure shift in the draw’s direction. Only after that confirmation do you enter, with the stop beyond the sweep and the target set at the draw itself.
Pair the timeframes deliberately. The daily names the draw, the one-hour marks the point of interest, and the five-minute times the entry. Because each layer answers a different question, the process stays clean. So the draw is not a single tool but the top of a chain. Skip the higher-timeframe read, and the lower steps lose their compass.
Also respect the clock. Draws resolve most often during the London window, 2:00 to 5:00 a.m. New York time, and the New York morning, 8:30 to 11:00 a.m. Our free forex market hours tool shows when those windows open in your local time.
Worked Example: A Bullish Draw to Previous Day High
Picture EURUSD on a bullish daily. The previous day’s high sits at 1.0968, unswept, with buy stops resting above. Price opens the London session in the discount half of the daily range near 1.0910. So the draw points clearly up toward that high.
Then the setup builds. Price dips to sweep the Asian low at 1.0898, triggering sell stops, and rejects sharply. That raid against the draw funds the move. A five-minute structure shift up confirms the turn, and a fair value gap forms near 1.0916. So the discount low provided the fuel, and the fresh gap provided a clean entry back toward the draw.
Now the trade builds itself. A long inside the gap carries a stop below the 1.0898 sweep low, roughly 22 pips of risk. Meanwhile, the target is the draw at 1.0968, some 50 pips above. Price reached it by the New York morning, and the day resolved exactly where the analysis pointed.
Notice how the draw shaped every decision. It set the direction, so only longs made sense. The target followed too, so the exit was clear before entry. Even the entry fell into place, because the sweep against the draw provided the discount to buy. So one idea, named before the open, organized the whole trade. That is the practical payoff of reading a chart from its destination backward.
Worked Example 2: A Bearish Draw to Sell-Side
Now run the mirror case, step by step, in the opposite direction. GBPUSD trades on a bearish daily. The previous day’s low sits at 1.33290, unswept, with sell stops resting beneath. Price opens in the premium half of the range near 1.33850.
First comes the raid against the draw. Price pushes up to sweep the session high at 1.33911, triggers buy stops, and stalls. Sellers absorb the burst and take control. The chart below marks the draw below, the sweep above, and the entry zone.
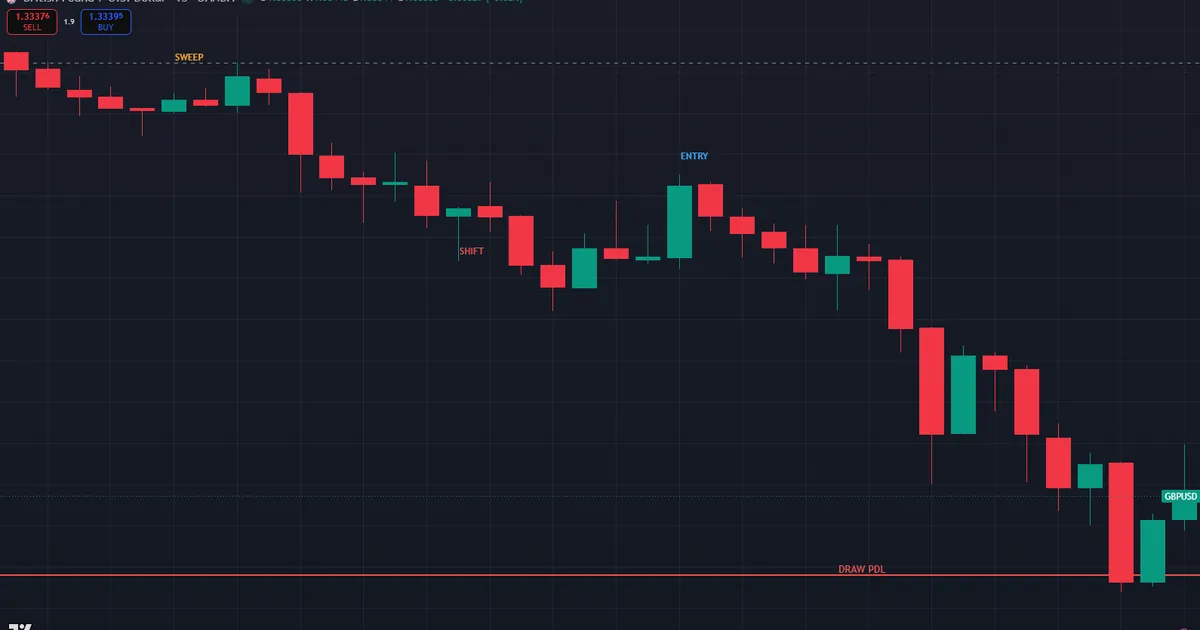
Then the confirmation arrives. A five-minute structure shift down leaves a gap near 1.33776. A short into that gap carries a stop above the 1.33911 sweep high, roughly 14 pips of risk. Meanwhile, the target is the draw at 1.33290, some 49 pips below. The sequence never changed, only the direction did.
So the two examples share one skeleton. Name the draw, wait for a raid against it, confirm with a structure shift, then trade toward the target. Because that skeleton repeats across pairs and timeframes, learning it once pays off everywhere. Also note how the raid against the draw supplies the entry. Price must reach the wrong way first to gather the orders that fuel the move toward the draw. That counterintuitive step is where patient traders find their edge.
Download the complete indicator database
Put these concepts on your charts. One email unlocks the full library of 1,380+ indicators with compiled MT4 and MT5 files, plus my TradingView scripts. No paywall, no spam, unsubscribe any time.
Get free access to my indicator database
One email unlocks 1,380+ free MT4, MT5 and TradingView indicators — the complete library. No single-tool download; you get the whole database.
Common Mistakes and How to Fix Them
The concept is simple, yet the same execution errors repeat. The graphic below collects the traps we see most, and the fixes follow beneath it.
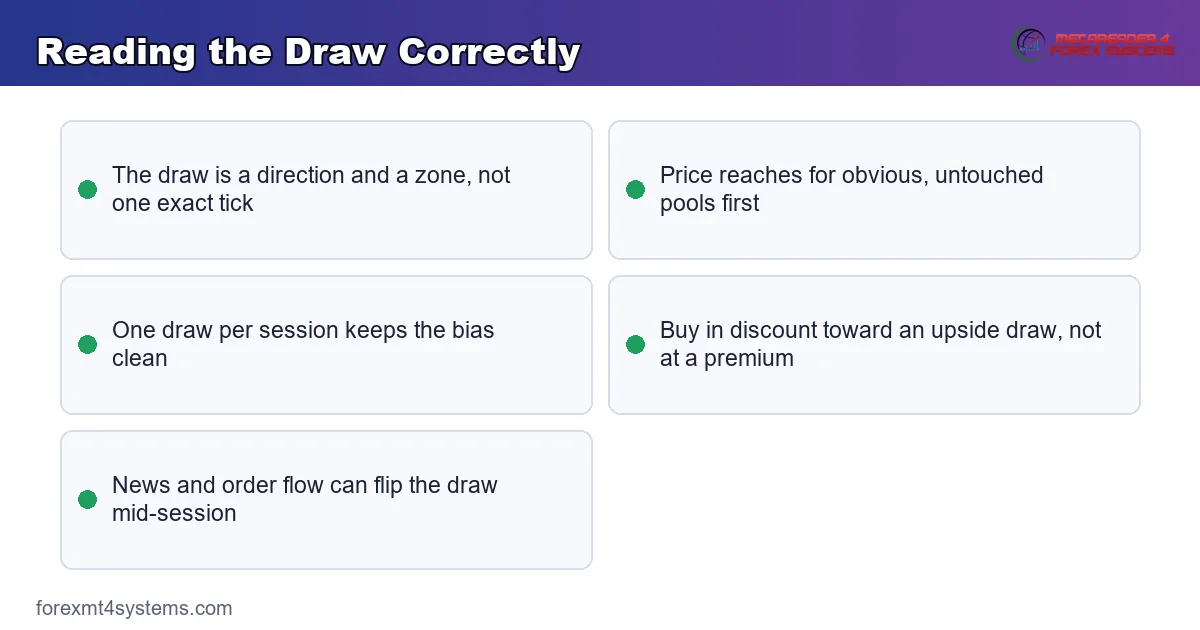
Naming Two Draws at Once
Marking both the high and the low as targets is the same as having no target. So commit to one draw per session based on the daily bias. If the bias is genuinely unclear, stand aside rather than trade both directions.
Ignoring Premium and Discount
Buying at a premium into an upside draw gives a poor price and a wide stop. Instead, wait for price to reach the discount half before you look for longs toward an upside draw. The location matters as much as the direction.
Chasing After the Draw Is Reached
Once price sweeps the draw, the move that fed it is often complete. So do not pile in at the target itself. Treat the draw as an exit zone, not a fresh entry, unless a new draw forms beyond it.
Forgetting the Session Clock
A draw named for a dead Asian session may not resolve until London arrives. Hence match your patience to the session. The move toward the draw usually needs an active window to unfold.
Fighting the Higher Timeframe
An intraday draw against a strong daily trend has weak pull. So weight the daily direction first, then pick the draw that agrees with it. A target that fights the trend is the least reliable one on the chart.
Confusing a Level With a Draw
Every support and resistance line is not a draw. A draw is a level the current bias points toward, backed by fresh liquidity. So a line with no resting pool behind it, or one that faces away from the bias, is just a mark on the chart. Grade each level by its pool and its direction before you call it the day’s target.
Quick-Reference Checklist
Run this short list before every session. A few minutes here frames the entire trading day.
- Daily bias marked as bullish or bearish before the open.
- PDH, PDL, and session highs and lows drawn on the chart.
- Any equal highs or lows flagged as heavy pools.
- The untouched pool in the bias direction named as the draw.
- Current price graded as premium or discount.
- An active session, London or New York, running now.
- Entry, stop, and target planned with the draw as the destination.
When the Draw Changes Mid-Session
Study the failure case as hard as the success case. Here is a common one. You name the PDH at 1.14217 as the bullish draw for EURUSD. Price pushes up and sweeps it to 1.14358, and the read looks perfect.
Then a high-impact news release hits. Price reverses hard, closes below the day’s opening range, and heads for the PDL near 1.13988 instead. The chart below shows the draw flipping, with the failed upside path marked.
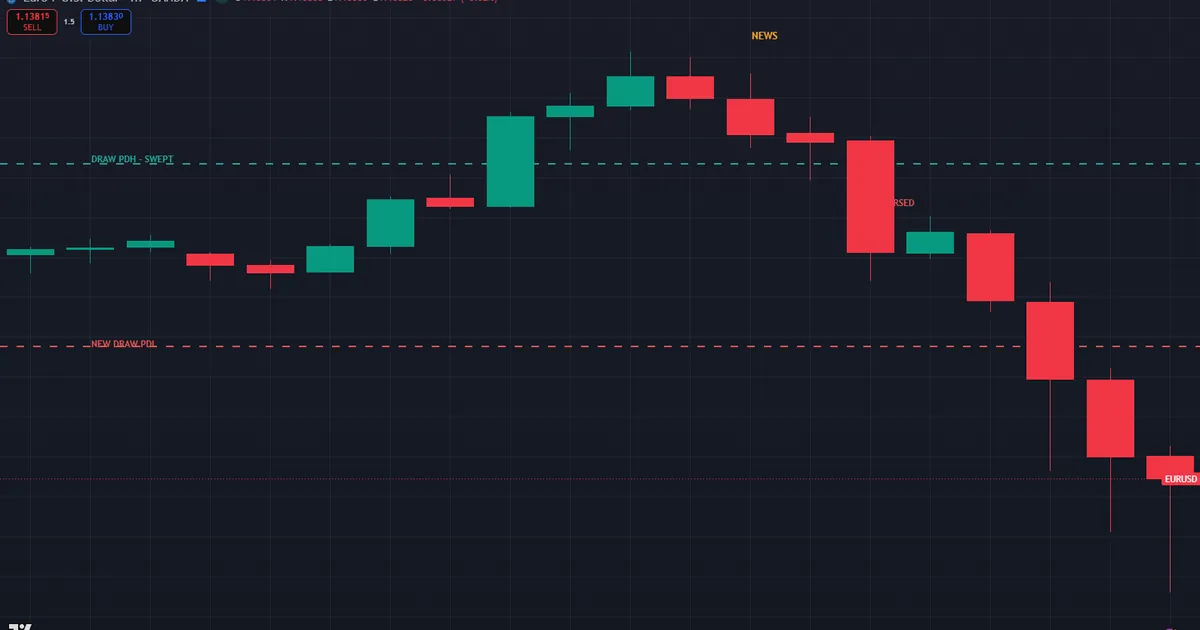
So what went wrong? The draw was reasonable, but conditions changed. News and a shift in higher-timeframe order flow can redirect the day. Hence the rule that limits the damage: once price closes firmly below your entry structure and breaks the opposite way, the original draw is void. Exit at once, and re-read the chart before acting again.
Then log the trade while it stays fresh. Note the draw you named, the bias behind it, and what redirected the day. Review a few dozen of these, and a pattern appears: draws fail most often around scheduled news and when the daily bias was weak to begin with. Our full guide to liquidity sweep trading covers reading the raids that confirm or void a draw.
Be Honest About the Limits
No read names the destination perfectly, and the draw is a probability, not a promise. Ranging days blur it, since price drifts between both pools without committing to either. So stand aside when the daily chart shows a sideways box. Scheduled news is the other trap. A release can override the cleanest analysis in a single candle. Hence check the economic calendar before you lean on any draw. No fixed success rate exists for this method, and anyone quoting one is selling something. Outcomes depend on the trader’s bias read, session timing, and discipline.
Related Concepts to Study Next
Draw on liquidity connects to a web of sibling ideas, and two deserve your next reading hour. The daily bias read named above tells you which way the draw points, so revisit it whenever your target feels unclear. Meanwhile, the equal highs and lows guide linked earlier shows how to spot the densest pools that so often become the draw.
For hands-free mapping, the wider set of smart money indicators marks the prior-day levels and pools automatically. Tools speed the work, but naming the draw is a judgment you keep making yourself. Practice on replayed charts first. Name the draw before the session plays, then watch whether price reaches it. That simple drill builds the read faster than any amount of live risk.
FAQ
What does draw on liquidity mean?
Draw on liquidity is the price target the market is most likely reaching toward. It is the pool of resting orders that acts as a magnet for price. Naming it gives you a direction and a destination for the session.
What are the main draw on liquidity targets?
The most common draws are the previous day’s high and low, the session highs and lows, and clusters of equal highs and equal lows. Each holds a dense pool of resting orders. Price tends to reach for the obvious, untouched pool first.
How do I pick the daily draw?
Start with the daily bias, then grade price as premium or discount. Next, find the nearest untouched pool in the direction of that bias. That pool becomes the draw, and your entries and targets line up behind reaching it.
Is draw on liquidity a specific price?
Not exactly. It is a target zone and a direction rather than a single tick. The market aims for the pool of orders around a level, so treat the draw as an area to reach rather than a precise number.
Can the draw change during the day?
Yes. News and a shift in higher-timeframe order flow can redirect price to the opposite pool. So treat the draw as your best current read, and void it if price breaks firmly the other way.
Should I enter when price reaches the draw?
Usually not. The move that fed the draw is often complete once the pool is swept. Treat the draw as an exit zone, wait for a new setup, and manage risk on every trade. Results are not guaranteed; past performance is not indicative of future results.
External references
- For background on this concept, see Market Depth at Investopedia.
- For broader market context, see Order Book at Corporate Finance Institute.

About the author
Written by Dominic Walsh, a Forex trader and MT4/MT5 indicator, Expert Advisor and script developer. Every tool on forexmt4systems.com is tested on live charts before release and ships with ready-to-use compiled MT4 (.ex4) and MT5 (.ex5) files. Learn more about the trader and developer behind this site.
How we build, test and correct every tool: Editorial & Testing Policy. Trading carries risk; see the disclaimer.