
Equal highs and equal lows are two or more swing points that stall at almost the same price. Traders see a clean ceiling or floor. Smart money sees a pool of resting orders waiting to be taken.
This guide explains what equal highs and equal lows really are, why they act as liquidity magnets, and how price sweeps them before turning. So by the end, you will spot these pools early, expect the raid, and stop placing stops in the most obvious spot on the chart.
What Equal Highs and Equal Lows Really Are
Equal highs form when price tests the same resistance level twice or more and rejects each time. The peaks line up like a flat ceiling. Equal lows are the mirror: two or more troughs that hold at nearly the same floor. Both look like tidy support or resistance to most chart readers.
The shape is common and easy to spot. You will see it as a double top, a triple top, or a flat base on almost any timeframe. So the pattern itself is nothing new. What changes is the meaning you attach to it once you read the resting orders behind the level.
Michael Huddleston, the Inner Circle Trader (ICT), framed these levels differently. In his model, an obvious flat level is not a wall. It is a shelf of stop orders and pending breakout orders, and that cluster is liquidity the market can use.
The distinction changes everything about how you act. Classic charting says buy the break above equal highs. Smart money says the break is the trap. So the same flat level produces opposite plans depending on which lens you use. This guide teaches the second lens, then shows exactly when it applies and when it does not.
Reading the Level on a Live Chart
Look at a concrete case. The chart shows GBPUSD on the fifteen-minute timeframe. Price tapped 1.33905 three times across the London morning and stalled each time. Those three matching peaks form a clean band of equal highs, with resting buy stops just above.
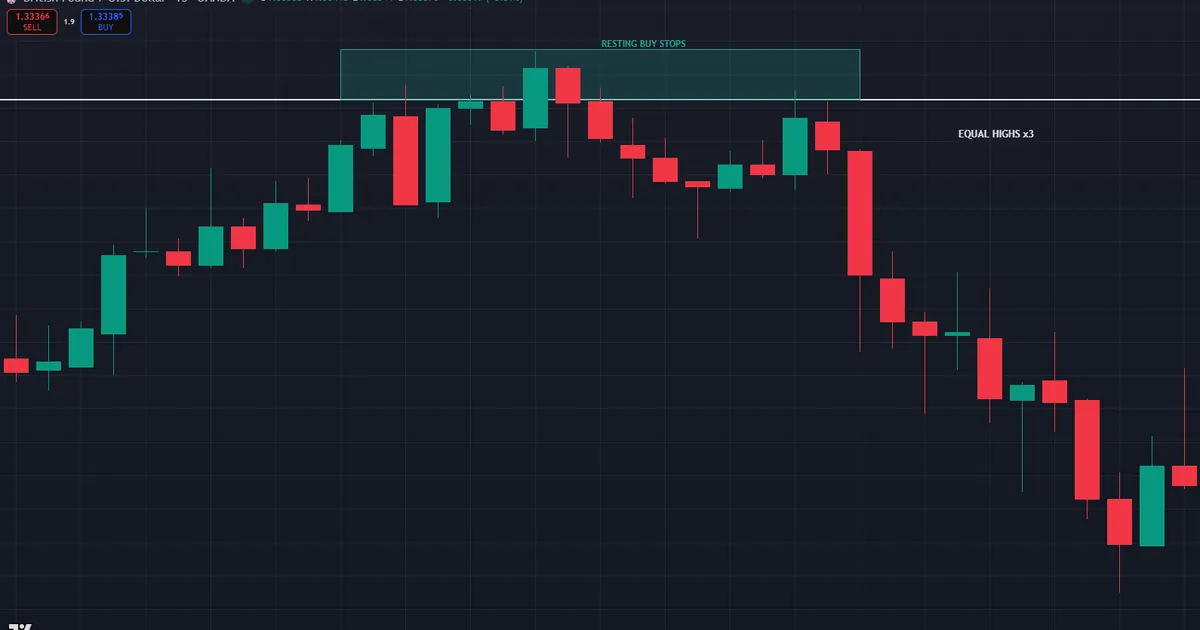
Now read the frame from left to right. Each touch of 1.33905 looked like solid resistance. So sellers piled in, and breakout buyers set stops just overhead. Because those stops sat in one tight band, they formed a target the market could reach for. That is the whole idea in one picture.
Why does this reframing matter for real trades? A trader who reads the level as a wall shorts it and sets a stop just above. Then the raid takes that exact stop before the real move begins. Meanwhile, a trader who reads the same level as a pool waits for the raid and joins the move afterward. So the label you choose decides whether you become the liquidity or use it.
Why Resting Liquidity Pools Form
Understand the order flow, and the pattern stops feeling like a trick. Every flat level collects two crowds of orders in the same place.
Two Crowds, One Price
First come the breakout traders. They watch the equal highs and place buy stops just above, hoping to ride the break. Second come the range sellers. They short the level and tuck protective buy stops right above it too. So both groups leave buy orders in the same narrow band.
Add a third crowd for good measure. Trend traders who missed the earlier move set buy stops above the highs to catch a fresh breakout. So three separate motives point orders at one price. That is why the pool grows so dense at a level everyone can see. The equal lows work the same way in reverse, gathering sell orders in one tight band beneath the floor.
Hence the pool grows dense. The more times price touches the level, the more obvious it looks, and the more stops stack overhead. Indeed, an equal-high level that everyone can see is exactly the one most likely to get raided.
There is a useful irony here. Textbook technical analysis calls a triple top a strong sell signal. Smart money reads the same shape as a loaded target. So the cleaner and more textbook the level looks, the more caution it deserves. Truly, obviousness is the point, not a flaw.
Why Larger Players Need the Pool
Size is the reason the pool exists. A large seller cannot fill a big position at a flat top without moving price against themselves. So they need a burst of buying to sell into. The stops above equal highs supply exactly that burst. When the level breaks, those buy orders fire and hand the seller the counterparties they need. Hence the raid is not malice. It is the practical way large orders get filled without slippage.
How the Raid Unfolds
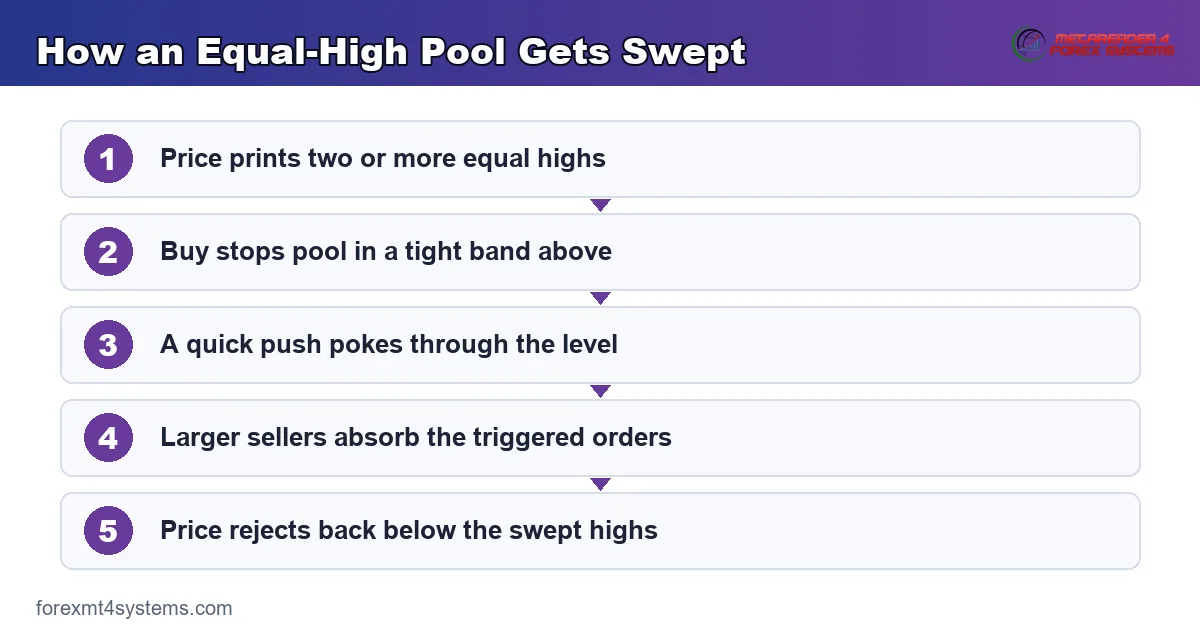
The sweep follows a simple sequence. Walk through it step by step.
- The level looks obvious. Price prints two or more equal highs, and the flat ceiling draws every eye on the chart.
- Stops build overhead. Breakout buy stops and short-seller protective stops pool in a tight band above the highs.
- Price pokes through. A quick push drives above the level and triggers that cluster of buy orders at once.
- Sellers get filled. Larger participants use the burst of buying to sell into, absorbing the orders they wanted.
- Price rejects. With the pool taken, price often snaps back below the level and reverses.
So the flat level was never the real story. The liquidity above it was. Notice how fast the whole sequence runs. Often the poke and the rejection print inside one or two candles, which is why chasing the break feels like a trap seconds after you enter. The concept graphic below turns that sequence into a reference you can keep beside your charts.
Relative Equal Highs vs Perfect Equal Highs
Do not wait for the peaks to match to the pip. In real markets they rarely do. ICT uses the term relative equal highs for a cluster of peaks within a few pips of each other. That small band still holds the same pool of stops.
So judge the level by intent, not by precision. Two peaks at 1.2910 and 1.2913 count as equal highs, because retail eyes read them as one ceiling. Meanwhile, a perfect double top with matching wicks is simply the tidiest version of the same idea.
Then focus on visibility. The question is never whether the highs match exactly. The question is whether most traders would draw one flat line across them. If they would, the stops are there, and the pool is real.
Also grade the pool by how it formed. Equal highs left by two sharp rejections carry more weight than a slow grind sideways. Sharp rejections signal that sellers defended the level with intent. Meanwhile, a lazy drift into a flat top leaves a thinner pool. So read the candles into the level, not just the level itself.
Equal Highs as Targets and as Entries
These pools play two roles, so keep them separate. As a target, an equal-high band tells you where a rally is likely heading before it stalls. As an entry cue, the same band tells you where to wait for a raid and a turn. First use the pool to project the draw. Then use its sweep to time the trade. Confusing the two roles leads to chasing price into the exact spot the market wanted to reach.
Where Equal Highs Sit in the SMC Workflow
Equal highs and lows are targets, not entries by themselves. The full smart money routine runs from the top down, and these pools mark where price is likely heading.
First, set the higher-timeframe bias on the daily and four-hour charts. Second, mark the obvious equal-high and equal-low pools as the liquidity price may reach for. Our guide to buy-side and sell-side liquidity shows how to label which pool feeds which move.
Then drop to the five-minute or fifteen-minute chart for the trigger. There you wait for the sweep of the pool, then a shift in structure back the other way. Only after that confirmation do you plan an entry, a stop beyond the sweep, and a target at the next pool. The wider idea of resting orders sits in our guide to the liquidity pool in forex.
Also respect the clock. Equal-high raids cluster around the London open, 2:00 to 5:00 a.m. New York time, and the New York morning, 8:30 to 11:00 a.m. Our free forex market hours tool shows when those windows arrive where you live.
Pair the timeframes deliberately. A common split marks the pools on the one-hour chart, then executes off the five-minute sweep. Because the higher timeframe holds the meaningful pools, that is where you draw your lines. Then the lower timeframe simply times the raid. So the one-hour answers where, and the five-minute answers when.
Worked Example: Equal Lows Below a Range
Picture EURUSD ranging through a quiet Asian session on the fifteen-minute chart. Price bounces off 1.0840 twice, leaving two equal lows and an obvious floor. Sell stops from range buyers pool just beneath that level.
Then London arrives. A sharp candle drives down to 1.0834, spikes through the equal lows, and triggers the resting sell stops. Larger buyers use that flush to fill long orders at a discount. Within one candle, price snaps back above 1.0840.
Now the trade builds itself. Price shifts structure up on the five-minute chart, and a long inside the reclaimed range carries a stop below the 1.0834 sweep low. Meanwhile, the first target sits at the equal highs capping the range near 1.0872. The pool below funded the move up.
The aftermath followed the plan. Price lifted off the reclaimed floor and reached the 1.0872 equal highs within two hours. So the range played out pool to pool: sell-side liquidity swept below, then buy-side liquidity targeted above. Notice that the two flat levels framed the entire trade. One marked the entry trigger, and the other marked the exit target.
Worked Example 2: Equal Highs Swept on GBPUSD
Now run the mirror case, step by step, in the opposite direction. GBPUSD trends up into the New York morning and stalls twice at 1.33905. Those two peaks form equal highs, and breakout buy stops build overhead.
First comes the raid. A fast candle pushes to 1.33934, triggers the buy stops, and stalls instantly. Sellers absorb the burst of buying and take control. The chart below marks the equal highs, the sweep, and the entry zone.
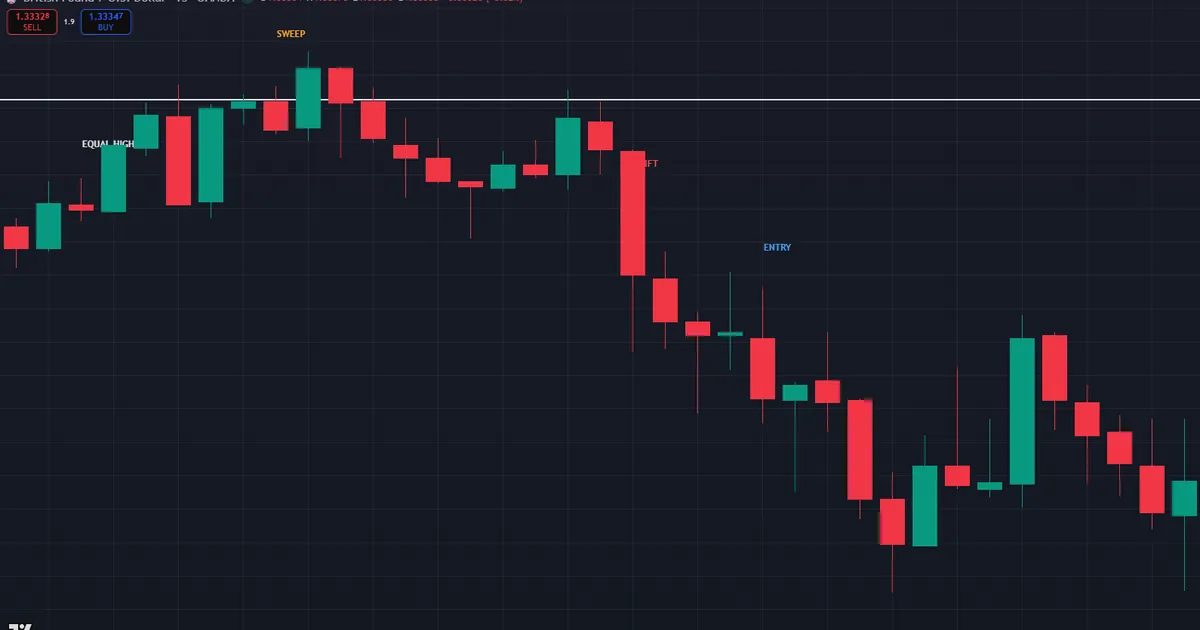
Then the confirmation arrives. Price shifts structure down on the five-minute chart and leaves a small gap near 1.33814. A short into that gap carries a stop above the 1.33934 sweep high, roughly 12 pips of risk. Meanwhile, the first target sits at the equal lows resting under 1.33650. The sequence never changed, only the direction did.
So the two examples share one skeleton. A visible pool forms, price raids it, larger players absorb the triggered orders, and structure shifts back. Because that skeleton repeats across pairs and timeframes, learning it once pays off everywhere. Also note that both trades kept risk tight, with the stop tucked just beyond the sweep extreme rather than at the obvious flat line.
Download the complete indicator database
Put these concepts on your charts. One email unlocks the full library of 1,380+ indicators with compiled MT4 and MT5 files, plus my TradingView scripts. No paywall, no spam, unsubscribe any time.
Get free access to my indicator database
One email unlocks 1,380+ free MT4, MT5 and TradingView indicators — the complete library. No single-tool download; you get the whole database.
Common Mistakes and How to Fix Them
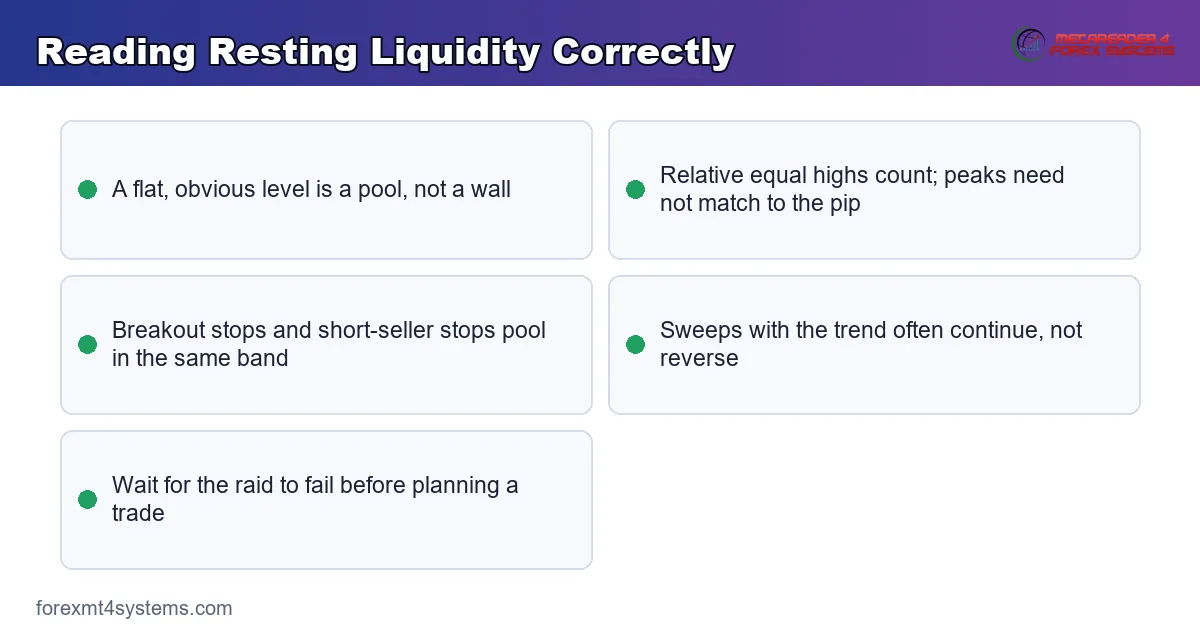
The concept is simple, yet the same execution errors repeat. The graphic below collects the traps we see most, and the fixes follow beneath it.
Trading the Breakout Itself
Buying the break above equal highs puts your order right where the pool sits. So you become the liquidity the sweep consumes. Instead, wait for the raid to fail, then trade the rejection back into the range.
Placing Stops in the Obvious Spot
A stop just above equal highs sits inside the densest pool on the chart. Hence it is the first order the market reaches for. Set stops beyond the sweep, or use a wider structural level, not the tidy line everyone else drew.
Expecting Every Pool to Reverse
Some sweeps run straight through and keep going. A pool taken in the direction of a strong trend often becomes fuel for continuation, not a reversal. So check the higher-timeframe bias before you fade any raid.
Ignoring the Session Clock
Pools built in dead Asian hours often wait for London to raid them. So do not expect an equal-high sweep at 3:00 a.m. New York time on a quiet pair. Match the pool to an active session.
Forcing Precision on the Level
Waiting for peaks to match to the pip means missing most real pools. Instead, treat any tight cluster of highs as one relative equal-high band. Visibility to the crowd matters more than exact price.
Fading Without Confirmation
A sweep alone is not an entry. Price can poke a level and keep running for many candles. So wait for structure to shift back the other way before you commit risk. That single filter removes most of the sweeps that never reverse.
Quick-Reference Checklist
Run this short list before you act on any pool. A few seconds here saves hours of regret later.
- Two or more swings stall within a few pips, forming a clear flat level.
- The level is obvious enough that most traders would draw one line across it.
- Higher-timeframe bias marked on the daily and four-hour charts.
- An active session, London or New York, is running now.
- You wait for the sweep, not the breakout, before planning a trade.
- A structure shift confirms the turn after the raid.
- Stop planned beyond the sweep, target at the next pool.
When the Sweep Never Reverses
Study the failure case as hard as the success case. Here is a common one. GBPUSD prints clean equal highs near 1.33816 on the fifteen-minute chart, and price pokes through as expected. You short the rejection, expecting a snap back into the range.
Then the reversal never comes. Price closes above the equal highs, retests them as support, and grinds higher toward 1.33934. The chart below shows that breakout holding, with the reclaimed level marked.
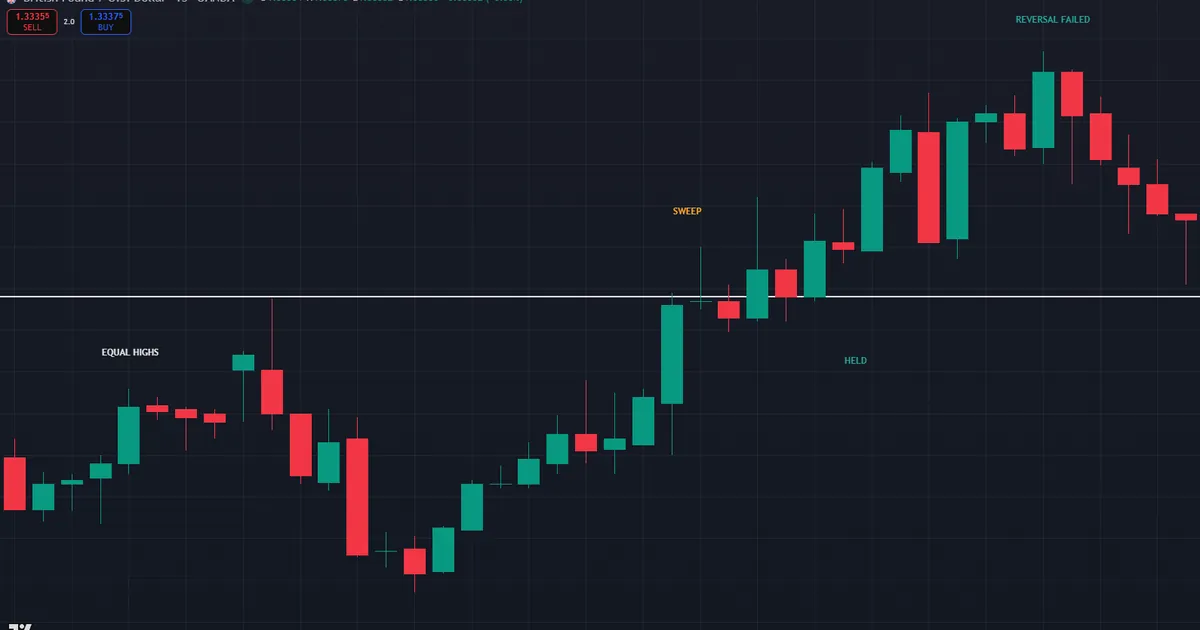
So what went wrong? Usually the trend. In this case the daily chart pointed firmly up, and the equal-high sweep was fuel for continuation, not a top. The market took the stops and carried on. Hence the invalidation rule that limits the damage: once price closes and holds above the swept highs, the fade idea is dead. Exit at once, without widening the stop.
Then log the trade while it stays fresh. Note the pair, the session, the higher-timeframe trend, and whether the pool sat with or against that trend. Our guide to stop hunting in forex covers why some raids reverse and others do not. Review a few dozen of these, and the pattern becomes clear: fades work best against the higher-timeframe trend, not with it.
Three journal fields matter most for pool trades. First, log whether the pool sat with or against the daily trend. Second, record whether price closed back through the level or merely wicked it. Third, note how quickly the rejection came after the sweep. Review those three columns monthly, and your filter rules practically write themselves. Truly, the written record turns each loss into tuition rather than pure cost.
Be Honest About the Limits
No pattern reads the market perfectly, and pools are no exception. Ranging days produce the messiest results, since price sweeps both flat levels in one session and reverses at neither cleanly. So stand down when the daily chart shows a sideways box. News is the second trap. A scheduled release can drive straight through a pool and never look back within the hour. Hence treat any sweep during high-impact news with extra suspicion. No fixed success rate exists for this setup, and anyone quoting one is selling something. Outcomes depend on the trader’s context, session filters, and discipline.
Related Concepts to Study Next
Equal highs and lows connect to a web of sibling ideas, and one deserves your next reading hour. Draw on liquidity explains which pool the market is most likely reaching for, so read our guide to draw on liquidity next. Meanwhile, the broader raid-and-reverse pattern lives in our full guide to liquidity sweep trading.
For hands-free detection, the wider set of ICT indicators for MT4 and MT5 marks these pools and their sweeps on the chart. Tools speed the work, but the logic above still drives every decision.
FAQ
What are equal highs and equal lows in trading?
They are two or more swing points that stall at nearly the same price. Equal highs form a flat ceiling, and equal lows form a flat floor. Smart money traders read them as pools of resting stop orders rather than simple support or resistance.
Why does price sweep equal highs and lows?
Obvious flat levels collect a dense band of stop orders and pending breakout orders. Larger participants push price through that band to trigger the orders and fill their own positions. So the raid is about reaching liquidity, not about the level itself.
Do equal highs and lows have to match exactly?
No. ICT uses the term relative equal highs for peaks within a few pips of each other. The band still holds the same pool of stops. What matters is whether most traders would draw one flat line across the swings.
How do I trade an equal-high sweep?
Most traders wait for the raid to fail rather than buying the breakout. After the sweep, they look for a structure shift back into the range, then enter with a stop beyond the sweep. The next opposite pool becomes a logical target.
Where should I place my stop near equal highs?
Avoid the tidy line just above the highs, since that is the densest pool on the chart. Set the stop beyond the sweep extreme or at a wider structural level. That keeps your order out of the most obvious raid zone.
Do equal-high sweeps always reverse?
No. A pool taken in the direction of a strong trend often becomes fuel for continuation. Always check the higher-timeframe bias before fading a raid, and manage risk on every trade. Results are not guaranteed; past performance is not indicative of future results.
External references
- For background on this concept, see Double Top Reversal at StockCharts ChartSchool.
- For broader market context, see Triple Top at Investopedia.

About the author
Written by Dominic Walsh, a Forex trader and MT4/MT5 indicator, Expert Advisor and script developer. Every tool on forexmt4systems.com is tested on live charts before release and ships with ready-to-use compiled MT4 (.ex4) and MT5 (.ex5) files. Learn more about the trader and developer behind this site.
How we build, test and correct every tool: Editorial & Testing Policy. Trading carries risk; see the disclaimer.