
Most explanations of the hammer candlestick meaning stop at “it signals a reversal”, which is both vague and wrong. A hammer records what happened during one period, and the geometry tells you exactly what that was.
This guide starts with the hammer candlestick meaning in precise terms: where the body sits, how long the lower wick runs, and what the close says. Location, confirmation and the failure case follow after that.
Hammer Candlestick Meaning at a Glance
A hammer is a single bar with a very lopsided shape. Sellers took price down through the period, and buyers lifted it back before the close.
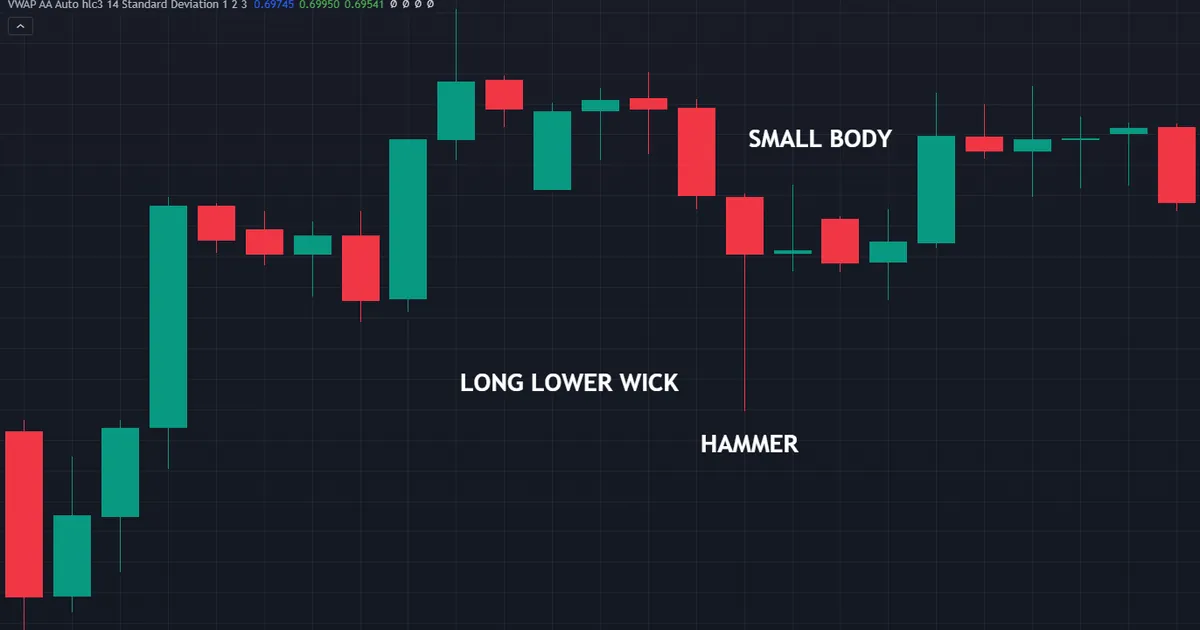
Study the marked bar in the chart above. Its body clusters near the top, while a long tail hangs beneath it.
The Short Definition
A hammer has a small body at the top of its range. Below that body runs a long lower wick, conventionally at least twice the body length.
Above the body sits little or no upper wick. Location completes the definition, because the bar only earns the name after a decline.
What the Bar Describes
Think of it as a report rather than a forecast. During that period, price fell a long way and then recovered most of the drop before the bar closed.
Nothing in the shape says what happens next. Traders who read a prediction into a single bar have added an assumption the data never contained.
Where the Name Comes From
The shape resembles a hammer standing on its handle. Japanese traders described the market as “hammering out” a base, which is where the English name originates.
Names carry no analytical weight though. A vivid label makes a pattern memorable, and memorability is not evidence.
A Short Historical Note
Candlestick charting grew out of Japanese rice trading. Writers commonly link it to Honma Munehisa, a merchant who traded at Osaka during the eighteenth century.
Much of that story stays unverified, so hold the attribution loosely. Steve Nison brought the technique to Western traders in the early nineteen nineties, and his books fixed the English names in place.
History explains the vocabulary rather than the value. These labels came from a market with daily sessions, which is worth remembering on a chart that never closes.
The Exact Anatomy of a Hammer
Four prices build every candle. Open, high, low and close define the body and both wicks between them.
Body Near the Top of the Range
The body spans open to close. On a hammer that span sits in the upper third of the whole high-to-low range.
Size matters as much as position. A large body defeats the point, since the pattern depends on a small body perched above a long tail.
The Long Lower Wick
The lower wick runs from the bottom of the body down to the low. Most definitions ask for a tail at least twice the body height, and many traders prefer three times.
That tail is the entire message. It marks a level price visited and then rejected within a single period.
Little or No Upper Wick
A short upper wick keeps the shape clean. Once the upper tail grows past a small fraction of the range, the bar drifts toward a long-legged doji or a spinning top instead.
Precision here saves arguments later. Write your own threshold down, then apply it the same way every time.
Colour of the Body
Classic definitions accept either colour. A bullish body closes above its open, and a bearish body closes below, yet both shapes still qualify.
Many traders prefer the bullish version anyway. Because a higher close shows buyers finished the period in control, the preference has a reason behind it, though tradition rather than measurement supports it.
Confirming One in Six Steps
Run this sequence before you call any bar a hammer. It takes seconds once you have done it a few times.
- Measure the full range. Note the high and the low of the candle.
- Measure the body. Take the distance between open and close.
- Locate the body. Check that it sits in the upper third of the range.
- Compare wick to body. The lower wick should run at least twice the body height.
- Check the upper wick. Anything more than a small nub weakens the shape.
- Check what came before. A decline into the bar is part of the definition.
Step six rejects more candidates than the other five combined. Without a prior decline the same geometry carries a different name entirely.

Location Turns the Shape Into Information
Geometry alone tells you very little. Where the bar appears does the work that the shape cannot.
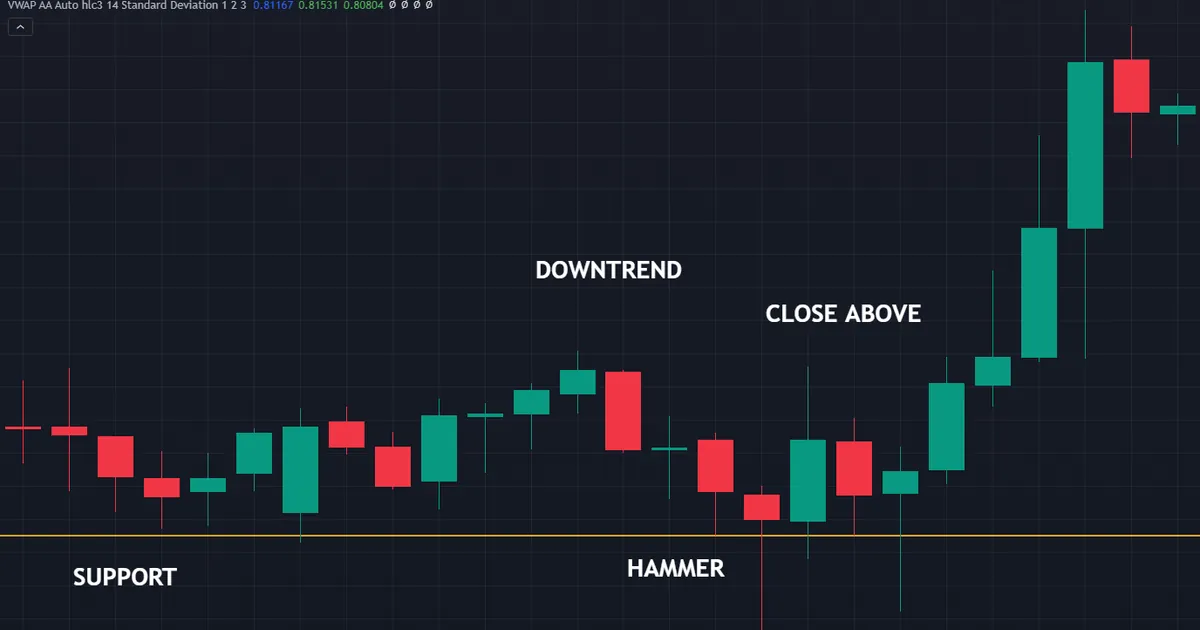
After a Decline
A hammer needs falling prices behind it. That context is what makes the long tail interesting, since it shows selling pressure failing at a moment when sellers held control.
Define the decline before you go hunting. Three lower closes, a break of a swing low, or a move away from a moving average all give you a testable version.
At a Level That Already Mattered
The strongest examples land where buyers were likely to act anyway. Support, a prior swing low, a session low or a weekly level all qualify.
Our guide to support and resistance covers how to mark those levels without cluttering the chart. A hammer far from any of them describes a session and nothing more.
Inside a Trend Pullback
Uptrends pull back before they continue. A hammer at the base of a shallow pullback shows the correction running out of sellers.
Higher-timeframe agreement matters here. Because your pullback might be somebody else’s downtrend, check the larger picture before assuming the trend still rules.
Session and Timeframe Context
Currency markets never close, so daily bars start whenever your broker’s server day starts. Two brokers with different session times can therefore show a hammer on one chart and nothing on the other.
Keep that in mind before treating any daily bar as universal. Our ATR position size calculator helps you judge whether a tail is genuinely long for that pair, rather than long by eye.
How Many Bars Count as a Decline
Vague context rules produce vague results. Decide in advance what a decline means on your chart.
Three simple versions work well. Count three consecutive lower closes, require a break of the previous swing low, or ask for price to sit below a chosen moving average.
Any of those beats a judgement call. Because the rule is testable, your notes from last month become comparable with this month’s.
Reading a Hammer Across Timeframes
The same shape carries different weight on different charts. Frequency is the reason.
Daily and Four-Hour Bars
Slower charts print fewer candidates. Each daily bar represents a full trading day of activity, so the rejection it records involved real participation.
Fewer signals also means easier record keeping. A daily chart on eight pairs gives you a manageable list rather than a stream.
Fast Charts and Noise
A one-minute chart produces hammers all day. Most of them describe a few pips of spread and a thin order book.
Filtering becomes essential down there. Restrict yourself to session opens, scheduled releases and marked levels, or the pattern turns into noise.
Dropping Inside the Bar
A lower timeframe shows what built the tail. Sometimes the low came from one violent spike, and sometimes from a slow grind that buyers gradually absorbed.
That distinction changes how you treat the level. A single spike often leaves an untested area behind, while a long absorption suggests real buying sat there.
Download the complete indicator database
Put these concepts on your charts. One email unlocks the full library of 1,380+ indicators with compiled MT4 and MT5 files, plus my TradingView scripts. No paywall, no spam, unsubscribe any time.
Get free access to my indicator database
One email unlocks 1,380+ free MT4, MT5 and TradingView indicators — the complete library. No single-tool download; you get the whole database.
The Hammer and the Hanging Man
These two bars share one shape and carry two names. The difference sits entirely in what came before.
Identical Geometry, Opposite Location
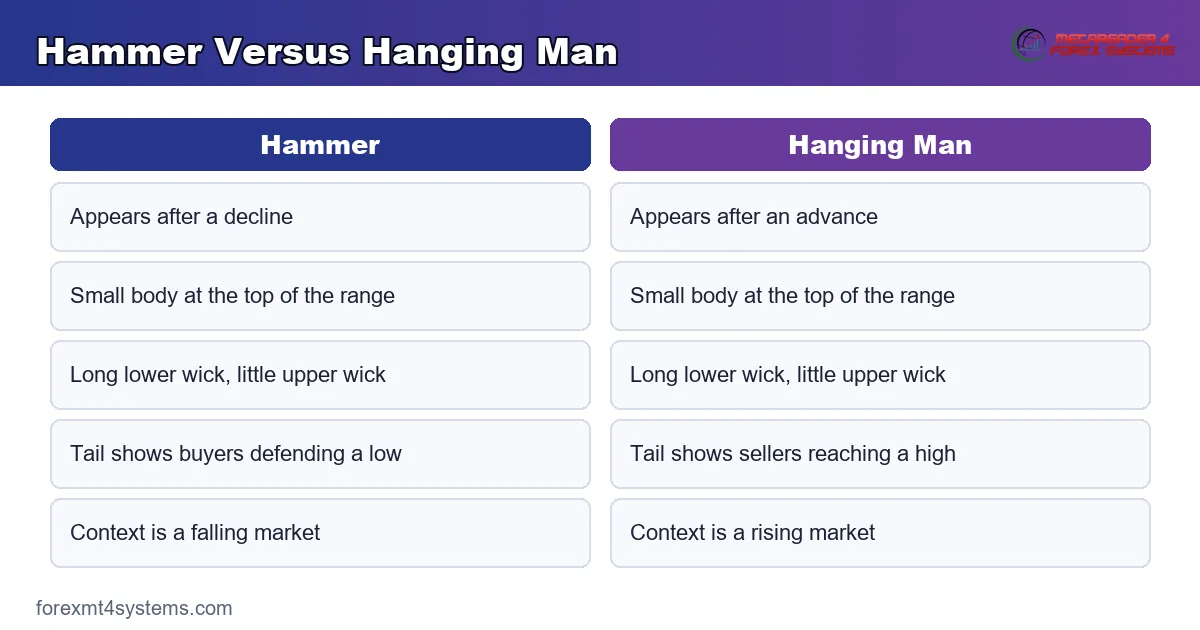
A hanging man has the same small body at the top and the same long lower wick. It simply appears after an advance rather than after a decline.
So the geometry cannot separate them. Only the preceding move decides which label applies, and our guide to the hanging man candlestick covers that sibling in detail.
Why Traders Separate Them
The same tail means different things in different places. After a fall it shows buyers defending, and after a rally it shows sellers appearing where none had been.
Our comparison of the hammer against the hanging man walks through both readings side by side. Treat the pair as one lesson rather than two patterns.
The Inverted Hammer and Shooting Star
Flip the shape and you get another pair. A small body at the bottom with a long upper wick after a decline is an inverted hammer, while the same bar after an advance is a shooting star.
Price-action traders fold all four into one label. Our explainer on the pin bar covers that overlap honestly instead of pretending they are unrelated ideas.
What Actually Happens Inside the Bar
A candle hides the order of events. Reconstructing that order makes the pattern far easier to trust or dismiss.
The Sequence of Prices
Price opens somewhere near the top of the eventual range. Selling then drives it down toward the low, sometimes quickly.
Buying arrives at that low and pushes price back up. By the close, most of the drop has disappeared from the chart.
What the Lower Wick Records
The wick marks territory the market rejected within the period. Somebody bought enough down there to reverse the move before the bar ended.
Volume adds nothing reliable in spot forex, since no central exchange reports it. Tick counts vary by broker, so treat volume-based confirmation cautiously on currency charts.
What the Wick Does Not Tell You
A long tail says nothing about who bought. Profit taking by short sellers looks identical to fresh buying on a candlestick chart.
Both motives produce the same shape. So the pattern cannot distinguish a genuine change of control from a brief squeeze, and no amount of staring will reveal the difference.
Accept that limit rather than inventing a story. The bar gives you a level and a rejection, which is useful enough without extra narration.
Why the Close Matters Most
An unfinished bar can look like anything. A tail that exists mid-session frequently disappears before the close, and the finished candle looks ordinary.
So judge the shape only once the period ends. Traders who act on a forming hammer are acting on a shape that may never exist.
How Traders Use a Hammer
No approach here carries any promise. Each one simply describes a common convention among traders.
Waiting for Confirmation
Many traders require the next bar to close above the hammer’s high. That extra step filters out bars that reject a low and then keep falling anyway.
Confirmation costs you entry price. So the choice trades a better fill against a cleaner sequence, and your own records should settle it.
Stop Placement Below the Wick
The conventional stop sits just below the hammer’s low. That low is the level the market already rejected, so a return through it removes the reason for the trade.
Long tails create wide stops. Cutting position size keeps the risk constant, and our risk reward calculator shows what the wider stop does to your ratio.
Sizing From the Wick Length
Stop distance drives lot size, never the reverse. Measure from your entry down to the wick low, then work the size from your risk per trade.
Some hammers are simply untradeable at your account size. Skipping those beats shrinking the stop to fit a position you wanted anyway.
Building the Hammer Into a Written Plan
A pattern you describe loosely gets traded loosely. Three short paragraphs in a plan document fix most of that.
Write the Definition Down
State your body position rule, your wick ratio and your upper wick tolerance. Numbers beat adjectives here, since “long” means something different at nine in the morning than at five in the afternoon.
Keep the definition stable for a decent sample. Changing thresholds after every loss destroys the comparison you were building.
Define the Context Rule
Name what must sit behind the bar before you act. A marked level, a trend condition and a minimum decline all belong in that sentence.
Then write down what disqualifies a signal. A release inside your holding window or a bar far from any level both make useful exclusions.
Define Entry, Stop and Invalidation
Decide whether you enter on the close or on a confirming bar. Fix the stop convention, then fix the risk per trade that sets your size.
Add one line about invalidation without a stop hit. Many traders exit when the reason disappears, even while the stop remains untouched.
Common Mistakes With Hammer Candles
The same errors appear again and again. The graphic below sets the hammer beside its identical twin, since mixing those two causes several of them.
Ignoring What Came Before
Without a decline, the bar is a hanging man rather than a hammer. Traders who skip that check invert the whole reading. So establish the preceding move before you name the candle.
Accepting a Fat Body
A large body with a modest tail is a different bar entirely. Loose standards turn half the chart into hammers. So measure the ratio instead of trusting a glance.
Trading Every Instance
Fast timeframes print these constantly during quiet hours. Taking them all pays your broker and nobody else. So filter by location first, then by timeframe.
Skipping the Level
A hammer floating in empty price has nothing to lean on. The pattern earns its keep where buyers had a reason to act. So mark your levels before you look for shapes.
Placing the Stop Inside the Wick
A stop tucked halfway up the tail sits inside territory the market just traded. Ordinary noise reaches it easily. So put the stop beyond the low and cut size instead.
Expecting a Turn Every Time
Plenty of hammers appear mid-decline and change nothing. Treating each one as a bottom produces a long series of small losses. So size for a shape that often fails.
Hammer Quick Reference
Work down this list whenever a candidate appears. It takes under a minute per bar.
- Confirm the bar has closed.
- Check the body sits in the upper third of the range.
- Check the lower wick runs at least twice the body height.
- Check the upper wick stays small.
- Confirm a decline preceded the bar.
- Name the level or trend that gives it context.
- Decide whether you need a confirming close.
- Place the stop beyond the wick low.
- Size the position from that stop distance.
Steps five and six reject most candidates. That rejection rate is the value, because the pattern works as a filter rather than as a trigger.
When the Hammer Fails
Failures are ordinary. The chart below shows a hammer whose low gives way within a couple of bars.
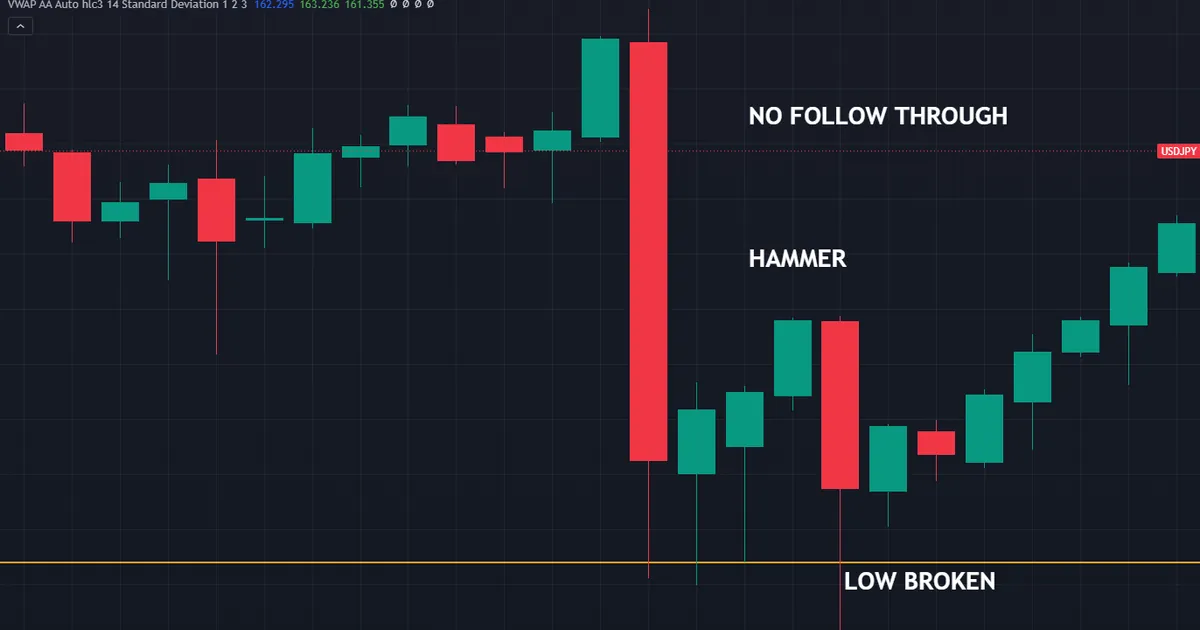
What a Failed Hammer Looks Like
The bar prints its long tail and closes near the top. Then a following candle trades straight through the wick low, and the stop under that tail disappears.
Anyone who entered on the close now holds a loss. Anyone who waited for confirmation avoided the trade completely, which is the argument for waiting.
Why Failures Are So Common
A single period of buying does not change a trend. Sellers who paused for one bar frequently return in the next one.
Stops also cluster beneath obvious wick lows. Reaching them produces exactly the kind of push that ends the pattern.
What the Research Suggests
Academic testing of candlestick patterns has generally found little consistent edge once costs enter the calculation. Findings also shift by market, by period and by the exact definition used.
None of that makes the shape worthless. It does mean the hammer belongs in a process as a location filter, rather than as a standalone reason to trade.
Setting Honest Expectations
Treat every instance as one input. Position size, the level behind it and a written invalidation point matter far more than the candle.
Traders who accept that stop hunting for a perfect pattern. They start asking whether the surrounding context justifies a trade at all.
Logging Every Instance You See
Keep a simple record of candidates rather than trades. Note the pair, the timeframe, the level behind the bar and what happened over the next few candles.
Thirty entries teach you more than thirty articles. Your own market, your own timeframe and your own costs all sit inside that file, which no general guide can capture.
Patterns in the log then guide your filters. Perhaps only hammers at weekly levels ever went anywhere, or perhaps only the ones with a confirming close did.
Related Concepts to Study Next
Two further guides finish this corner of the topic. Both cover shapes that turn up in the same places.
For automated marking of these bars, browse our candlestick indicators collection, and pair it with our support and resistance indicators so the levels behind each signal stay visible. Reading those two together keeps the shape and its context on the same screen.
FAQ
What does a hammer candlestick actually mean?
It means price fell a long way during that period and then recovered most of the drop before the close. The long lower wick records territory the market rejected. That description says nothing about the next bar on its own.
Does the colour of a hammer matter?
Classic definitions accept either colour, so a bullish or bearish body both qualify. Many traders prefer a close above the open, since it shows buyers finishing the period ahead. Treat that preference as a convention rather than a measured effect.
How long should the lower wick be?
Most definitions ask for a tail at least twice the body height, and plenty of traders prefer three times. Pick a threshold, write it down, then apply it consistently. Consistency matters more than the exact multiple you choose.
What is the difference between a hammer and a hanging man?
Nothing in the geometry differs at all. A hammer appears after a decline, while a hanging man appears after an advance. The preceding move is the only thing separating the two names.
Should I wait for confirmation before entering?
Many traders require the following bar to close above the hammer’s high. That step removes some bars that reject a low and then keep falling. Waiting costs entry price, so test both approaches against your own trade records.
Are hammer candles reliable on their own?
No single candle carries enough information to trade by itself, and testing of candlestick patterns has generally found little consistent standalone edge once costs are counted. Use the shape to judge trade location, lean on the level behind it, and size the position from the distance to your stop. Results are not guaranteed; past performance is not indicative of future results.
External references
- For background on this concept, see Hammer at BabyPips Forexpedia.
- For broader market context, see Five Bullish Candlestick Patterns at Investopedia.

About the author
Written by Dominic Walsh, a Forex trader and MT4/MT5 indicator, Expert Advisor and script developer. Every tool on forexmt4systems.com is tested on live charts before release and ships with ready-to-use compiled MT4 (.ex4) and MT5 (.ex5) files. Learn more about the trader and developer behind this site.
How we build, test and correct every tool: Editorial & Testing Policy. Trading carries risk; see the disclaimer.