
The hanging man candlestick has an odd name and a very simple shape. A small body sits at the top of the range, a long wick hangs below it, and almost nothing shows above.
What makes it interesting is not the shape at all. That exact geometry also forms a hammer, and only the move that came before decides which name applies.
So this guide leads with the geometry, spends most of its time on place, and ends where most articles stop: the failure case, where the bar prints and the market carries on regardless.
What a Hanging Man Candlestick Actually Shows
The bar appears after an advance. Price ran up for a stretch, then one session dropped hard, only to close back near its high.
That round trip is the whole story. Sellers found enough weight to push price well below the open, and buyers had to work to get the close back up.
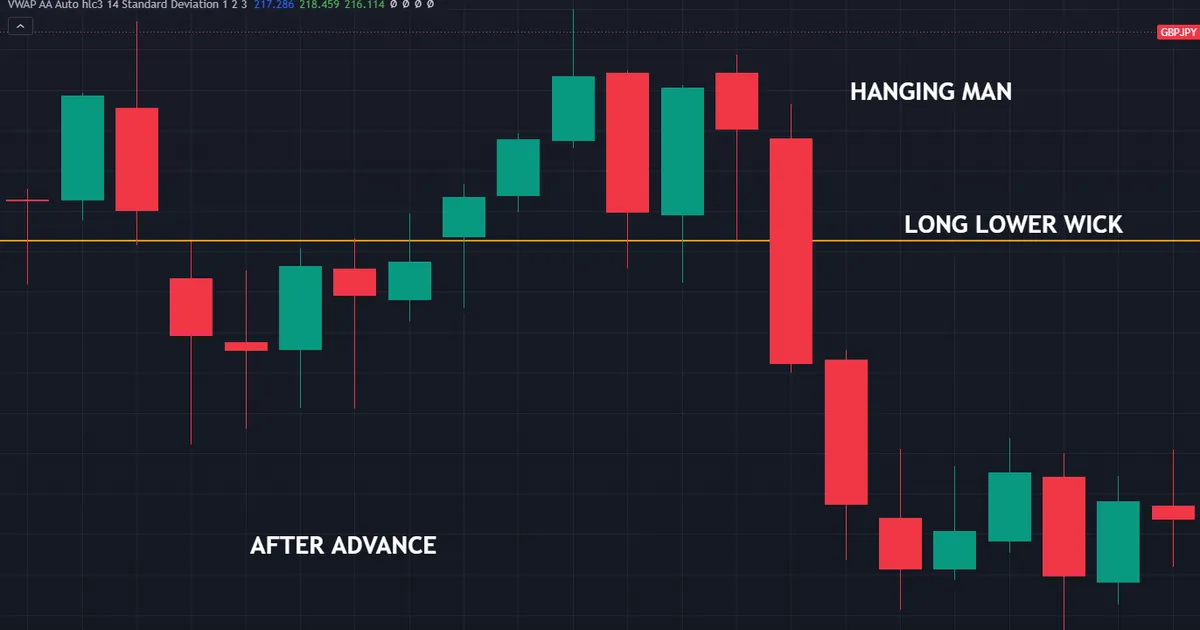
Notice what the bar does not say. It gives no target, no timing and no promise, so it describes one session and nothing beyond it.
Why the Name Sounds Ominous
The shape looks like a small figure with legs dangling, which is where the name comes from. Nothing in the name adds meaning, so treat it as a label rather than a warning.
Traditional books group it with bearish reversal shapes. That grouping reflects convention among traders rather than a measured result, and our note on do candlestick patterns work covers what testing has actually shown.
The Exact Geometry of the Bar
Four numbers define it: open, high, low and close. Get the ratios right and you never have to argue about whether a bar qualifies.
Write your own thresholds down once. A rule in numbers beats a rule in adjectives every time you meet a borderline case.
The Body Sits at the Top
Open and close both land near the high of the bar. The body may print either colour, though many traders treat a bearish body as the firmer read.
Body size should stay small. Compare it against the last ten bodies rather than judging it alone, since a big body means the session settled somewhere rather than merely wobbling.
Colour matters less than most people think. A bullish body still shows sellers driving price a long way down during the session, and that push is the point.
The Lower Wick Does the Work
The long lower wick marks ground price visited and gave straight back. Most definitions ask for a wick at least twice the body, and some ask for three times.
Longer wicks read louder. A wick four times the body says sellers took real ground before buyers dragged the close back near the top.
Our guide to candlestick wicks meaning goes deeper on those ratios. Wicks carry nearly all the information in single-bar shapes, so the detail repays a careful read.
The Upper Wick Stays Short
Little or no upper wick should show. A long upper wick turns the bar into something closer to a spinning top, which reads as plain indecision.
Set a cap in numbers here too. Many traders ask that the upper wick stay under a quarter of the body, which keeps the shape clean.
Some traders relax that cap on fast charts, where spread pads both ends of every bar. Loosening it costs you some clarity, so note the change in your rules rather than making it silently.
How the Bar Compares With Its Neighbours
Range matters as well as ratio. A hanging man whose total range matches the last ten bars describes a normal session that simply ended oddly.
A much wider range says more. Price covered unusual ground and still closed near the top, which points to a real scrap rather than a quiet drift.
So check the range against a recent average before you get excited. A tiny bar with perfect ratios often means very little happened at all.
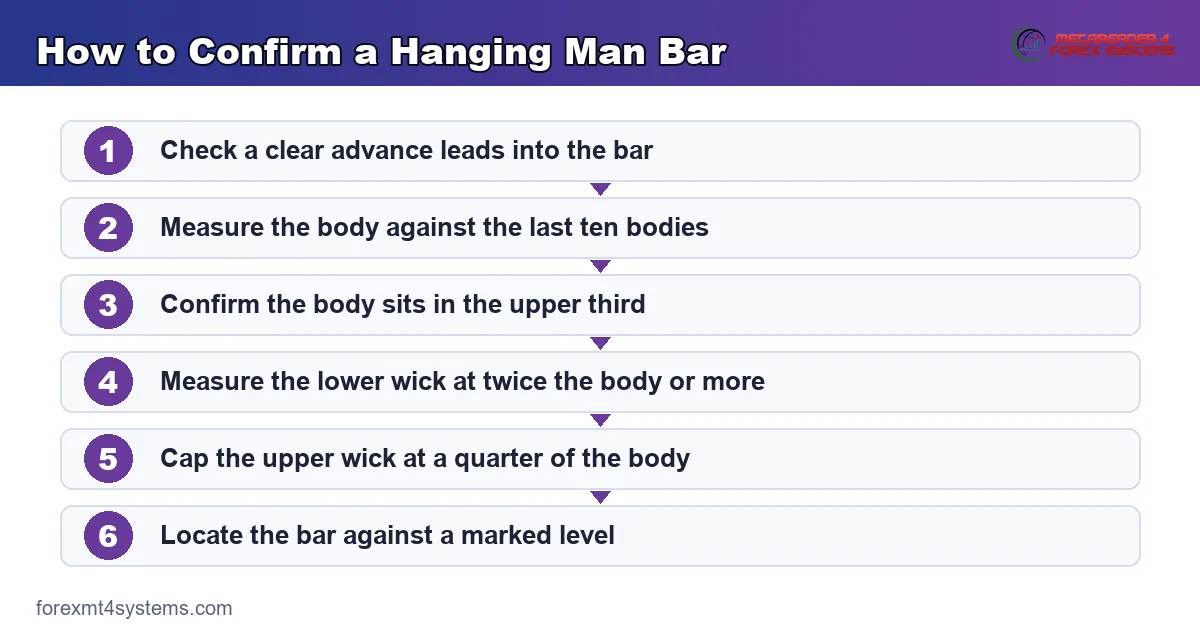
How to Confirm the Bar in Five Steps
Run this short routine before you call anything a hanging man. Five checks separate a real one from a bar that merely looks the part.
- Check the prior move. An advance must lead into the bar. No advance, no hanging man, whatever the shape looks like.
- Measure the body. Small against the last ten bodies, and sitting in the upper third of the bar’s range.
- Measure the lower wick. At least twice the body as a floor, and longer reads stronger.
- Measure the upper wick. Short, ideally under a quarter of the body, so the close stays near the high.
- Locate the bar. Note whether it prints at a level you marked earlier or drifts in open space.
That last step decides most outcomes. A textbook bar in open space describes a wobble, while a plain one at a prior high describes a fight somebody lost.
What the Bar Says About the Session
Step away from the label and picture the hours it covers. That mental replay teaches you more than any list of rules.
Price opened, sellers took control, and the market travelled a fair distance down. Then buyers came back and lifted the close almost to the open.
Two Groups Disagreed Sharply
A long wick always means two sides took opposite views. One group thought the level looked expensive, and another thought the dip looked cheap.
Neither group won outright. The close near the high says buyers finished on top, yet the wick says they had to fight for it.
That struggle is the useful part. In a healthy advance, sellers rarely get to move price that far in a single session.
Why the Close Still Favours Buyers
Here lies the awkward bit that most articles skip. The bar closes near its high, which by itself looks bullish rather than bearish.
The bearish reading comes from the wick and from the setting, not from the close. Sellers showed up in strength during a rise, and that appearance is the new information.
So the bar carries mixed evidence by design. Treat it as a warning to pay attention rather than as a reason to sell.
Where Volume Would Help
On shares and futures, traders often check volume on this bar. Heavy volume with a long wick suggests real supply met the advance.
Spot forex offers no central volume figure. Your platform shows tick counts from one broker, which measures activity rather than size, so treat it as a rough hint at best.
Why Place Does All the Work
Here is the part that separates this bar from a hammer. The two shapes are identical, and only the move before them differs.
A hammer follows a decline. A hanging man follows an advance, and no other rule changes at all.
The Same Bar, Two Names
Drop the same bar into a downtrend and every book calls it a hammer. Drop it into an uptrend and the same books call it a hanging man.
Our comparison of hammer vs hanging man works through that swap in full. Read it once and the pair stops causing confusion.
For the bullish side on its own, our note on hammer candlestick meaning covers the mirror in detail. Between them, the two guides cover every case you will meet.
What Counts as a Prior Advance
Vagueness here causes most of the bad calls. Fix a number: three or five higher closes in a row, or a run of some minimum size in recent range terms.
Then hold yourself to it. Traders who leave this loose end up seeing hanging men everywhere, since any small rise starts to qualify.
Which Levels Give the Bar Weight
Prior swing highs carry the most weight, especially ones that produced a sharp reaction before. Session highs, round numbers and the top of an old range all help too.
Our guide to support and resistance covers how to mark them. Keep the count small, because a chart with twenty lines makes every bar look important.
Check the Higher Timeframe First
A hanging man on the four-hour chart may sit halfway up a daily advance. Zoom out before you act, since the larger picture often shows plenty of room above.
Bars that print at a high on both timeframes read strongest. Two charts agreeing costs you nothing to check and removes a good share of the poor setups.
So make the zoom-out a habit rather than an extra step. It takes seconds and it changes how the same bar reads more than any ratio tweak.
A Worked Example at a Prior High
Picture a pair rising for eight sessions into a swing high from last month. The advance has slowed a little, and each of the last two bars closed less strongly than the one before.
Then the bar prints. Price opens near the previous close, drops sharply through the morning, and closes back within a few pips of its open near the top of the range.

Now the shape means something. Sellers appeared exactly where sellers appeared last time, and they moved price a long way before losing the ground back.
What the Next Bar Decides
Confirmation matters more than the bar itself. Watch whether the following session closes below the hanging man’s low, and whether it holds that ground into its own close.
A close back above the high changes the read completely. Buyers absorbed the selling and pushed on, so the level looks weaker than it did a day earlier.
Write your confirmation rule before the bar prints. Deciding afterwards turns every unclear case into an argument you will usually lose.
The Same Bar in Open Space
Move that identical shape to the middle of a quiet range and the read collapses. Nobody defended anything, so the wick reflects ordinary two-way trade.
So mark levels first and let the bars come to you. Waiting for the shape to land on a line you drew earlier filters out most of the noise.
This ordering matters more than any rule in this guide. Levels first, bar second, and a written size rule before either of them.
Download the complete indicator database
Put these concepts on your charts. One email unlocks the full library of 1,380+ indicators with compiled MT4 and MT5 files, plus my TradingView scripts. No paywall, no spam, unsubscribe any time.
Get free access to my indicator database
One email unlocks 1,380+ free MT4, MT5 and TradingView indicators — the complete library. No single-tool download; you get the whole database.
How to Act Without Front-Running the Bar
The shape gives you a place and a boundary. It gives you no target and no size, so the rest of the plan has to come from you.
Three decisions cover the practical work. Settle all three before the bar closes rather than in the heat of the moment.
Wait for the Close
A forming bar lies. A hanging man at midday can finish as a plain bullish bar by the evening, so the shape only counts once the session ends.
Patience costs you a few pips at worst. Acting early costs you the whole reason you waited for a shape in the first place.
Place the Stop Above the High
The bar’s high marks where your read stops making sense. Buyers reclaiming that level says the selling failed, so the stop belongs just beyond it.
Then work the size backwards from that distance. Our free ATR position size calculator sets the stop against recent range and returns a lot size in one step.
Tall bars therefore get smaller positions. That feels wrong when the shape looks dramatic, yet it keeps every setup on the same footing.
Take Targets From Structure
The bar carries no measured move. So take targets from the next level below, from a prior swing, or from a multiple of recent range.
Any target drawn from the candle alone rests on nothing. Structure at least marks places where traders reacted before.
Decide What Ends the Idea
Name the price that kills your reasoning before you click. For this bar that price sits above the high, since a close beyond it says the selling failed outright.
Keep that line separate from your stop. The stop guards your money, while the invalidation line tells you the read has broken, and the two sometimes trigger at slightly different prices.
Traders who write both numbers down argue with themselves far less. One line covers the cash, and the other covers the thinking.
Consider Scaling Rather Than Guessing
You need not treat this as one all-or-nothing call. Some traders take a partial position on the close and add only after price breaks the bar’s low.
That approach costs a little in fills and saves a lot in stress. It also keeps you out of the many cases where the bar prints and nothing follows.
Common Mistakes With the Hanging Man
Six habits account for most of the trouble traders report with this bar. The panel below lists the checks that strengthen a read.

Calling It a Hanging Man With No Advance
Without a rise leading in, the bar has nothing to turn. Fix a numeric rule for the prior move and apply it before you look at the shape at all.
Mixing It Up With a Hammer
Under pressure the two names swap easily, since the shapes match exactly. Say the prior move out loud first, because that one word settles which bar you hold.
Trading It Cold
One bar rarely stops a trend that has run for weeks. Use it to time an idea you already had, not to create one from scratch.
Ignoring a Long Upper Wick
A tall upper wick weakens the read badly. The close no longer sits near the high, so the bar drifts toward plain indecision.
Hunting the Shape on One-Minute Charts
Fast charts throw up this shape constantly, mostly from spread and thin trade. Stick to the timeframes where your levels genuinely live.
Skipping the Cases That Failed
People remember the bars that worked. Log every case, dull ones included, and your view of the shape changes within a month.
Reading the Bar Backwards Through History
Scroll back and every major top shows a bar like this somewhere near it. The same shape sits at dozens of spots where nothing followed, so walk your charts forwards instead.
Letting the Bar Set a Target
This shape carries no measured move at all, unlike a double top or a triangle. Take targets from the next level below and leave the bar to handle timing alone.
Hanging Man Quick Reference
Keep this table beside your chart while the rules settle. Six rows cover everything the bar can ask of you.
| Check | What to look for |
|---|---|
| Prior move | A clear advance into the bar, defined by a number you fixed |
| Body position | In the upper third of the bar’s range |
| Body size | Small against the last ten bodies, either colour |
| Lower wick | At least twice the body, longer reads stronger |
| Upper wick | Short, ideally under a quarter of the body |
| Location | At a prior swing high, session high or old range top |
| Confirmation | Next bar closes below the hanging man’s low and holds |
Print it once and stop looking things up. Because the geometry never changes, one sheet lasts you for years.
When the Hanging Man Fails
This bar fails often, and the failure has a clear shape. Price prints it, refuses to break lower, then closes back above the high and carries on up.
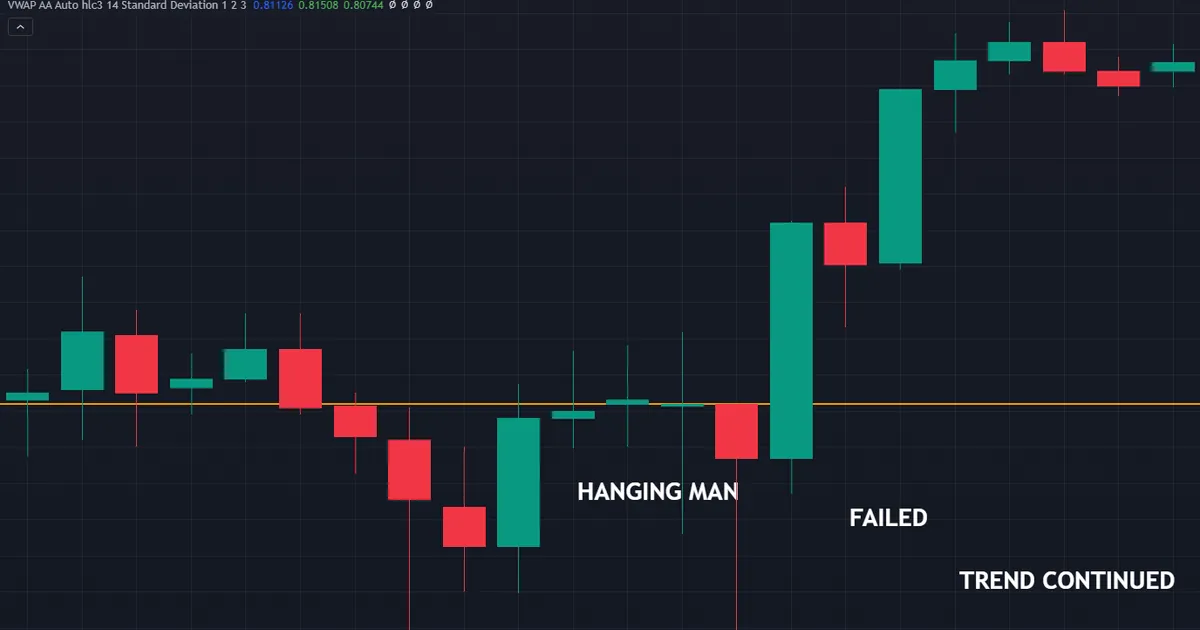
So treat that close as your exit. The reason for the trade has gone, and waiting for the stop simply costs you the gap between the two.
Failure Against a Strong Trend
Strong advances absorb single bearish bars all the time. Check the higher timeframe before you fade a move that has run for weeks on the strength of one session.
Failure at a Weak Level
Levels differ in quality. A line drawn from one brief touch attracts far less defence than a swing that produced two sharp reactions, so the same bar carries less weight there.
Failure in Thin Conditions
Rollover, holidays and quiet hours stretch wicks. Wide spreads draw a dip that barely traded, so a dramatic bar at a strange hour deserves doubt rather than excitement.
Failure Because the Advance Was Young
A rise of three bars gives the bar very little to reverse. Shapes that appear early in a move usually mark a pause, and the move resumes soon after.
How to Handle a Failure Well
Plan the exit before you enter, then act on the rule rather than on hope. Log the case afterwards, because a folder of failed bars teaches you more about your level choices than any run of winners.
Related Shapes to Study Next
Two nearby guides finish the picture. Each takes the topic somewhere a single-bar article cannot.
Read our note on the shooting star candlestick pattern for the other bearish single bar, which flips the wick to the top. The pair covers most of what you will see at a high.
If you want these shapes flagged while you learn, browse our candlestick indicators and price action indicators. Use them as a scanner and keep the level work in your own hands.
FAQ
What does a hanging man candlestick mean
It shows a session where sellers pushed price well below the open before buyers dragged the close back near the high, appearing after an advance. That round trip says selling turned up inside a rising market. It forecasts nothing on its own, so place and follow-through decide whether it matters.
Is a green hanging man still valid
Yes. Traditional rules accept either colour, since the long lower wick carries the message rather than the body. Many traders treat a bearish body as the firmer read, though that preference reflects convention rather than a measured result.
What is the difference between a hammer and a hanging man
Only the move that came before. A hammer follows a decline, and a hanging man follows an advance, while the geometry stays identical in both cases. Fix a numeric rule for the prior move so the two never blur under pressure.
How long should the lower wick be
At least twice the body as a working floor, and some traders ask for three times. Longer wicks describe a bigger round trip, so they read louder. Write your threshold down and keep it fixed, otherwise your own records stop comparing.
Which timeframe suits the hanging man best
Traders commonly favour the four-hour and daily charts, since each bar covers more trading and fewer shapes appear. That preference reflects convention rather than a measured rule. Check the higher timeframe as well, because a bar at a four-hour high can sit mid-range on the daily.
Where should the stop go
Just above the bar’s high, since a close back through that level removes the reason for the trade. Then set position size from that distance rather than using a fixed lot. Tall bars end up with smaller positions, which keeps every setup on the same risk footing.
Can I trade the hanging man on its own
You can, though most traders find the results thin once spread and swap come out. The bar works better as timing inside a plan that already marks levels, checks the higher timeframe and fixes risk in advance. Results are not guaranteed; past performance is not indicative of future results.
External references
- For background on this concept, see Hanging Man Candlestick Pattern on Wikipedia.
- For broader market context, see Hanging Man Candlestick at Corporate Finance Institute.

About the author
Written by Dominic Walsh, a Forex trader and MT4/MT5 indicator, Expert Advisor and script developer. Every tool on forexmt4systems.com is tested on live charts before release and ships with ready-to-use compiled MT4 (.ex4) and MT5 (.ex5) files. Learn more about the trader and developer behind this site.
How we build, test and correct every tool: Editorial & Testing Policy. Trading carries risk; see the disclaimer.