
One session climbs hard, meets sellers, and hands back everything it gained. The shooting star candlestick pattern records exactly that, in a single bar with a long tail above a small body.
Traders reach for it constantly, and most of them skip the part that gives it meaning. So this guide covers the exact geometry, the location that qualifies a bar, where a stop belongs, and what a failure looks like.
What the Shooting Star Candlestick Pattern Actually Shows
Read the bar as a story about one session. Price opened, rallied a long way, then closed back near where it started.
Buyers reached for higher prices and found sellers waiting. That rejection draws the long upper wick everyone recognises.
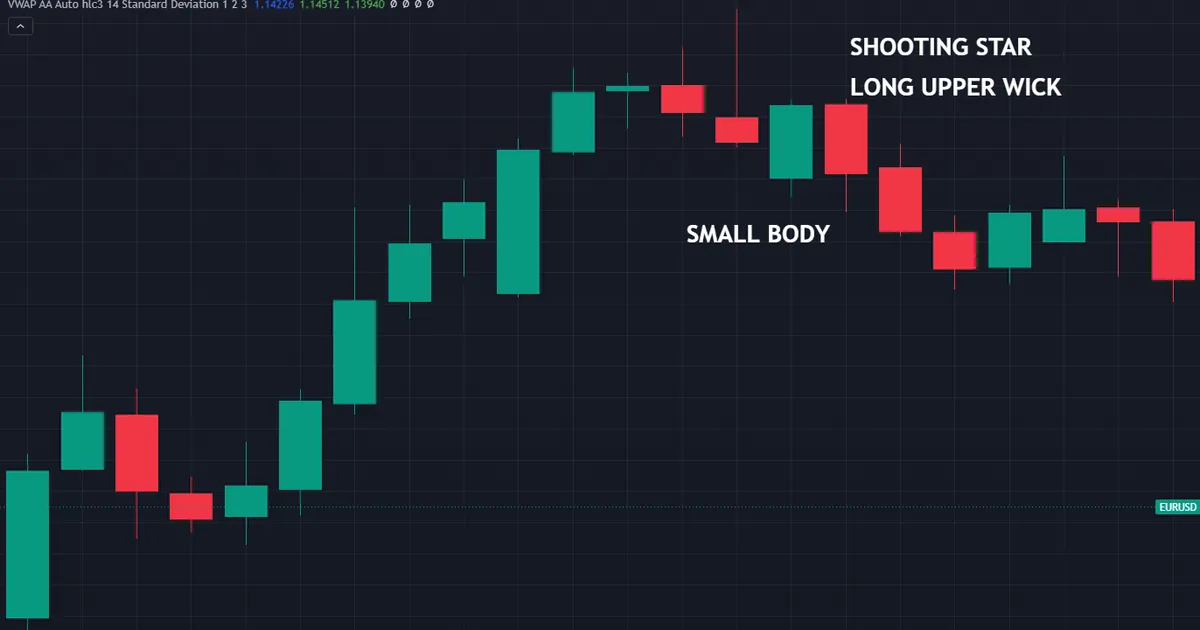
One condition turns the shape into a shooting star. The market must have advanced into the bar, because the same geometry after a decline carries a completely different name.
The Session Behind the Shape
Imagine the day tick by tick. Price grinds up for hours, spikes through an old high, then rolls over as supply appears.
By the close, almost all of that gain has gone. The chart keeps a record of the excursion in the wick, and a record of the outcome in the body.
So the tail marks a price the market visited and rejected. Nothing more dramatic than that sits inside the candle.
What the Bar Does Not Tell You
A shooting star describes one session. It makes no claim about the next one, and no candle ever has.
Plenty of them appear inside trends that carry on climbing for weeks. Treat the bar as evidence about supply at one price, then let the following bars decide what it meant.
Honest use starts there. Traders who demand a forecast from a single candle end up disappointed by every pattern they learn.
What the Research Actually Shows
Studies of individual candle shapes have struggled to find a durable edge once spread and commission come out. Outcomes also change with the instrument, the sample period and the definition each researcher chose.
That record does not retire the pattern. It moves the bar from a trigger to a filter, which counts as a smaller job done well.
Use it to pick where you look and where risk sits. Confirmation and position size then decide whether any trade happens at all.
Exact Geometry: the Numbers That Qualify a Bar
Vague definitions produce vague results. Six checks turn the shape into something you can measure the same way every time.
- Small body. The distance from open to close covers under a third of the whole session range.
- Body near the low. Both the open and the close sit inside the bottom third of the range.
- Long upper wick. The tail above the body measures at least twice the body height, and three times looks cleaner.
- Small lower wick. Anything below the body stays under about a quarter of the body height.
- Prior advance. The last several bars climbed into this one, which the name absolutely requires.
- Somewhere that matters. An old high, a round number, a session extreme or a moving average sits at the top of that wick.
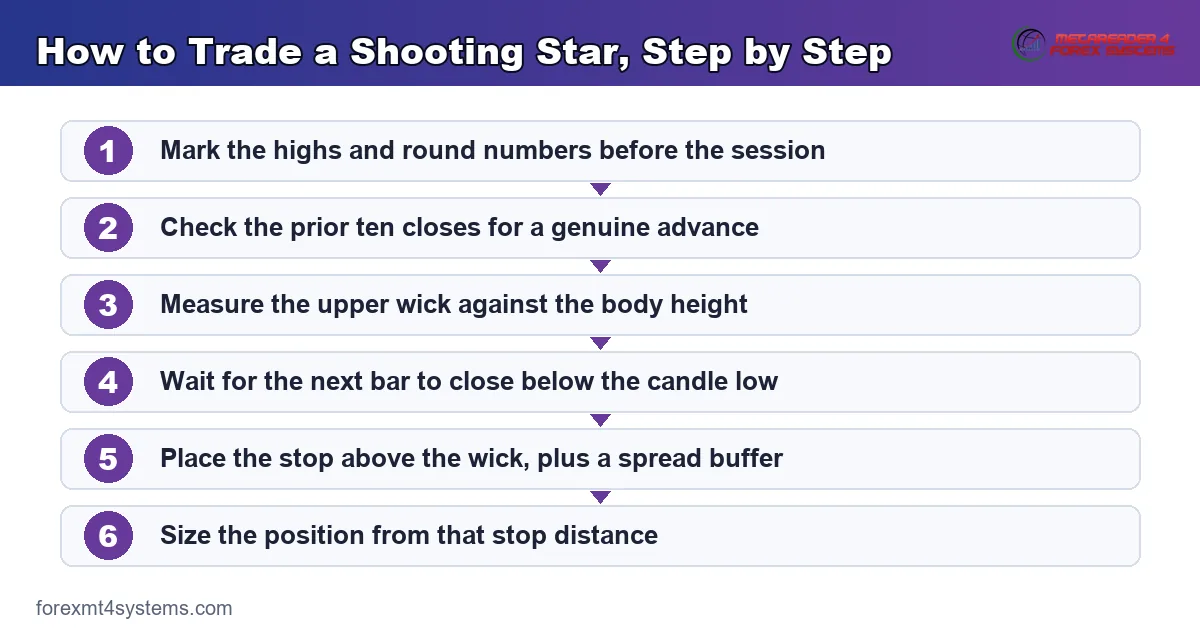
Write those thresholds down before you start hunting. A rule you can quote survives a bad morning, while a feeling does not.
The Wick-to-Body Ratio
Divide the upper wick height by the body height. Two or more meets the common convention, and many traders raise the bar to three.
Raising the threshold cuts your candidate list sharply. Fewer bars qualify, though the ones that do carry a much larger rejection.
Neither figure holds any magic. Consistency does the real work, so pick one number and apply it to every chart you open.
Body Position Inside the Range
The body belongs at the bottom. A body floating in the middle with tails on both sides gives you a spinning top instead, which says indecision rather than rejection.
Measure it as a fraction. Take the higher of the open and close, subtract the low, then divide by the range to get a number you can test.
The Lower Wick Tolerance
Textbook drawings show a flat base. Live charts almost never cooperate, so a small stub below the body still qualifies comfortably.
Trouble starts once that stub grows. A lower wick approaching the body height drags the bar toward the long-legged family, where the story changes.
Colour and Why It Barely Matters
A filled body suits the story best, since it means the close finished under the open. The classic definition accepts a hollow body too.
Colour adds a small amount of flavour and nothing structural. The wick, the body position and the prior trend carry all the weight.
The Location That Makes It Valid
Geometry alone qualifies a shape, not a setup. Location turns one into the other.
The Prior Advance Is Compulsory
Without a run up into the bar, the name simply does not apply. The identical shape after a decline becomes an inverted hammer, and our comparison of inverted hammer vs shooting star works through that split in detail.
Count the last ten closes for an objective test. Seven or more in the same direction gives you a genuine advance rather than a wobble.
Levels That Add Weight
Ask what the wick reached into. A prior swing high, a weekly level, a round number or the upper edge of a range all give the rejection a target.
Our guide to candlestick patterns at support and resistance shows how much the same bar gains from a level above it. Read it if location interests you more than shape.
Mark your levels before the candle prints. Levels drawn afterwards tend to appear wherever they flatter the trade you already want.
Note how far the wick pushed past the level as well. A deep piercing that snapped straight back shows a sharper rejection than a tail stopping politely underneath.
Open Space Drains the Reading
A shooting star halfway through a clean trend, with nothing above it, tells you very little. Somebody sold, and somebody sells during every session.
So filter hard on location. Most traders who complain the pattern does nothing have simply been taking every occurrence rather than the ones that sit somewhere meaningful.
How to Trade a Shooting Star, Step by Step
Four steps cover the whole process. Run them in this order, because each one depends on the last.

Step One: Mark the Level First
Draw the obvious highs, the round numbers and the weekly extremes before the session opens. Then wait and see whether a candle rejects one of them.
Working this way flips the usual habit. The level finds the candle, rather than the candle inventing a level.
Step Two: Wait for the Close Below the Low
Confirmation means the next bar closing under the shooting star’s low. Until that happens the trend still holds the upper hand.
Some traders enter on a break of the low instead of a close. That version fills earlier and gets shaken out more often, so pick one and record which you use.
Step Three: Place the Stop Above the Wick
The stop belongs above the extreme of the upper tail, plus a buffer for spread and ordinary noise. Anything tighter sits inside the range the market has already proved it can reach.
Add a few pips on a major pair and rather more on a volatile cross. Our note on ATR in trading covers a tidy way to size that buffer from recent volatility.
Step Four: Size From the Stop Distance
Long wicks create wide stops. So the lot size has to shrink, or your risk quietly doubles compared with a normal setup.
Work backwards from a fixed cash risk. Our free position size calculator turns the stop distance into a lot size in one step.
Step Five: Decide the Exit Before You Enter
Write down the target and the invalidation before the order goes in. A plan made afterwards bends to whatever the screen happens to show.
Nearest support, the last swing low or a fixed multiple of the risk all work as targets. Pick one method, then hold it steady across trades so the record means something.
Download the complete indicator database
Put these concepts on your charts. One email unlocks the full library of 1,380+ indicators with compiled MT4 and MT5 files, plus my TradingView scripts. No paywall, no spam, unsubscribe any time.
Get free access to my indicator database
One email unlocks 1,380+ free MT4, MT5 and TradingView indicators — the complete library. No single-tool download; you get the whole database.
A Worked Example on a Daily Chart
Picture a major pair that has climbed for eleven sessions into a high from three months ago. The next daily bar opens quietly, pushes thirty pips above that high, then closes four pips under its open.
Every geometric check passes. The body sits near the low, the upper wick runs roughly four times the body, and almost nothing hangs below.
Reading the Risk
Suppose the wick extreme sits fifty pips above the candle’s low. A stop five pips beyond the wick gives a risk of fifty-five pips from an entry at the low.
That distance decides everything else. On a fixed cash risk, the lot size falls to roughly half what a twenty-five pip stop would allow.
Traders who ignore the arithmetic take the same lot size regardless. Their loss on this trade then runs at double their usual figure, which no strategy survives for long.
Managing the Position
A first target often sits at the previous swing low or the nearest support shelf. Many traders bank part of the position there and leave the rest running.
Move the stop only when structure gives you a reason. Trailing it bar by bar usually ejects you during ordinary noise, long before the idea has genuinely failed.
Recording the Trade
Screenshot the setup, the level, the confirmation bar and the outcome. After thirty entries your own log tells you far more about this pattern than any article can.
Note the ones you passed on as well. Skipped setups reveal your filters, and filters decide results more than entries do.
The Alternative Entry
Traders who dislike giving up the whole candle sometimes sell a retest instead. They wait for the close below the low, then look for price to drift back toward the broken area.
Such an entry improves the price and misses some moves entirely. Neither approach wins outright, so choose one and write it into your plan.
Lookalikes and How to Separate Them
Four other shapes crowd the same space. A quick test separates each one.
Inverted Hammer
Identical geometry, opposite context. A decline into the bar makes it an inverted hammer, so check the prior ten bars before you reach for either name.
Gravestone Doji
Shrink the body until open and close land at essentially the same price. Traders then call it a gravestone doji and read it in much the same way.
Hanging Man
Rotate the shape and the wick moves below the body. Our article on the hanging man candlestick covers that bar, which also needs an advance in front of it.
Pin Bar
Price-action traders use one word for every long-tailed rejection candle. A pin bar with its tail on top covers the shooting star without contradicting it.
Bearish Engulfing
Two bars rather than one, and a body that swallows the previous body. Our round-up of bearish candlestick patterns places both shapes in the wider family.
Common Mistakes and Their Fixes
Six habits cause most of the trouble. The keypoints panel below collects the checks worth running on every candidate bar.

Trading the Shape Without the Trend
A long upper wick inside a range means nothing much. Count the last ten closes first, then decide whether the name even applies.
Shorting on the Candle Itself
The bar closes near its low, yet the trend still stands. Waiting for a close below that low costs a little entry price and removes plenty of noise.
Parking the Stop on the Wick Extreme
Spread widening clips stops sitting exactly on the high. Add a buffer, then reduce the lot size to keep your cash risk unchanged.
Keeping the Same Lot Size Every Time
Wide stops with a fixed lot size quietly double your loss. So size every trade from its own stop distance rather than from habit.
Taking Every Occurrence
Charts produce dozens of qualifying bars a week across a watchlist. Filter on location, and the list shrinks to something you can actually follow.
Trusting News Spikes
A tail built entirely during a data release reflects thin liquidity rather than considered selling. Check the calendar before you read too much into any spike.
Quick Reference Checklist
Run this table before every entry. Eight rows cover the whole decision.
| Check | What qualifies |
|---|---|
| Prior move | Seven or more of the last ten closes climbing |
| Body size | Under a third of the session range |
| Body position | Inside the bottom third of the range |
| Upper wick | At least twice the body height |
| Lower wick | Under a quarter of the body height |
| Location | Old high, round number, weekly level or range edge |
| Confirmation | Next bar closes below the candle’s low |
| Stop | Above the wick extreme, plus a spread buffer |
| Size | Calculated from the stop distance, never fixed |
Any row that fails ends the setup. That discipline matters more than finding another qualifying bar.
Two Optional Filters Worth Testing
Some traders add a rule about where the following bar closes relative to the body midpoint. Others require the wick to exceed the average range of the last fourteen sessions.
Both filters cut the candidate list. Test one at a time, since changing two rules at once teaches you nothing about either.
Timeframes and the Forex Session Clock
The shape appears on every timeframe, though it does not mean the same thing on each. A few practical points save a lot of frustration.
Higher Timeframes Carry More Weight
A daily bar collects a full session of orders. A five-minute bar collects five minutes, so its tail reflects far fewer participants.
Most traders work the four-hour chart and above for this pattern. Lower timeframes still show the shape, yet they produce far more of it.
Server Time Draws the Daily Bar
Spot forex runs around the clock, so daily candles start whenever your broker rolls the date. Two brokers on different offsets draw slightly different bars.
Check your server offset once and stay on one feed. Comparing charts across platforms wastes hours and settles nothing.
Thin Liquidity Manufactures Tails
Books thin out between the New York close and the Tokyo open. Spikes printed there look identical to genuine rejections and deserve a firm discount.
Weekend Gaps Distort the First Bar
Spot forex reopens with a gap often enough to matter. A Sunday or Monday candle can print a long tail purely from the reopening move rather than from any selling pressure.
Skip that bar or treat it separately. Most traders keep it out of their pattern log altogether.
Adding Evidence Around the Bar
One candle rarely justifies a trade on its own. Two or three independent pieces of evidence pointing the same way change the picture considerably.
Momentum That Disagrees With Price
Price makes a higher high while an oscillator makes a lower one. That disagreement, paired with a rejection wick at the same spot, says more than either observation alone.
Keep the tools independent, though. Two moving averages of the same price simply tell you one thing twice.
A Level Somebody Else Watches
Weekly highs, round numbers and pivot levels attract orders because everyone can see them. Rejections there involve real participants rather than a line you drew for yourself.
A Second Rejection at the Same Price
Two tails at one level over consecutive sessions form a double test. The market probed twice and failed twice, which carries more weight than a single session ever could.
Volume Behind the Rejection
Forex platforms report tick volume rather than traded contracts. A tail formed on heavy tick activity still shows wider participation than a quiet one, so treat it as a tiebreak.
When the Shooting Star Fails
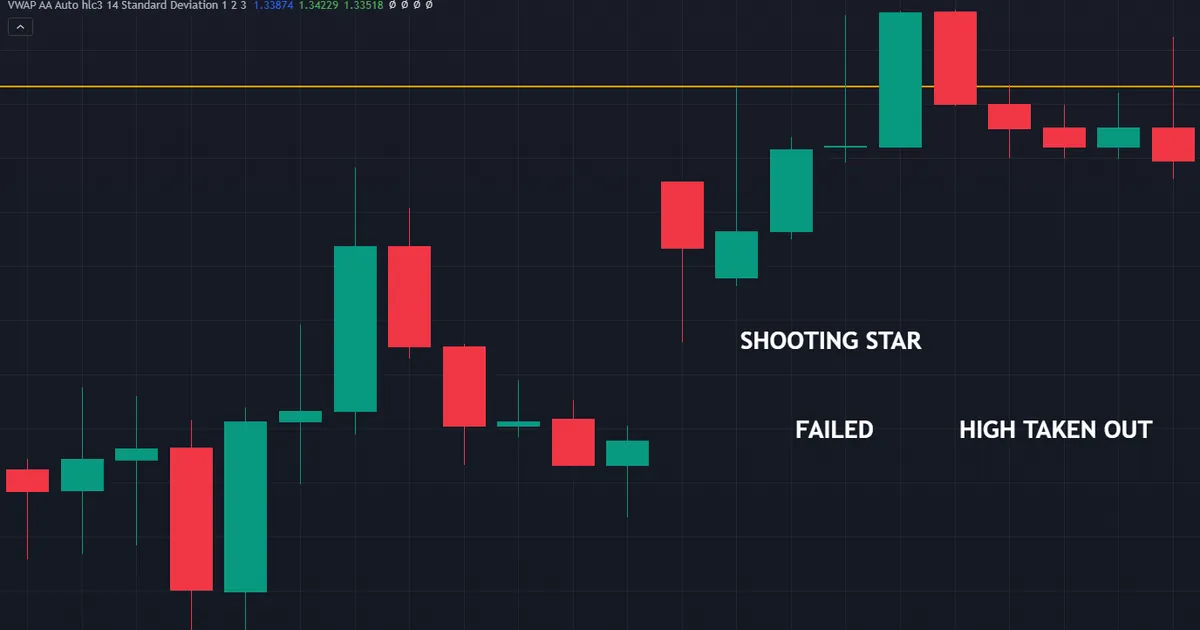
Failures teach faster than the tidy textbook cases. The chart below shows a clean bar whose marked high gave way three hours later.
The Trend Simply Absorbs It
Price closes above the candle’s high two sessions later and keeps climbing. Strong trends swallow single-bar warnings constantly, which is exactly why confirmation exists.
Confirmation Never Arrives
The next bar closes inside the shooting star’s range, then the one after that closes higher. No trade ever triggered, so no money moved.
The Level Was Not Real
Sometimes the wick rejects a line nobody else drew. Stick to obvious highs and round numbers, since crowded levels produce the reactions worth trading.
The Stop Sat Too Close
Price takes out the wick by two pips, then falls exactly as expected. Such trades hurt the most, and a sensible buffer prevents most of them.
Related Reading and Tools
This bar sits inside a family of single-candle rejections, and the neighbouring guides stop the names blurring. Each one covers a shape that looks similar at a glance.
Traders who prefer the levels drawn automatically can browse our support and resistance indicators archive. For the shapes themselves, the candlestick indicators archive collects tools that mark qualifying bars on a chart.
Above all, keep the order of operations intact. Level first, candle second, confirmation third, stop fourth, and size last.
FAQ
What is a shooting star candlestick pattern?
A single bar with a small body near the low of its range, a long upper wick of at least twice the body height, and little or nothing below the body. It only earns the name after an advance, where the tail records buyers reaching higher and meeting sellers.
Is a shooting star bullish or bearish?
Traders read it as a bearish signal in context, though the bar itself only describes one session. It shows supply appearing at a price the market rejected. Whether that matters depends on the level under the wick and on what the following bars do.
Where do I put the stop?
Above the extreme of the upper wick, plus a buffer for spread and ordinary noise. Placing it on the wick tip invites a clip during a routine spread widening. Because that distance often runs wide, calculate the lot size from the stop rather than trading a fixed amount.
How is it different from an inverted hammer?
Only the prior trend separates them. Both bars show the same small body near the low with a long upper wick. An advance into the candle names it a shooting star, while a decline names it an inverted hammer.
Which timeframe suits this pattern best?
Four-hour charts and above suit most traders, because each bar collects orders from a longer window. Lower timeframes still print the shape, yet they produce far more candidates and many of those come from thin liquidity rather than from real selling.
Can I trade it without confirmation?
Some traders do, entering on a break of the candle’s low rather than a close below it. That version fills earlier and gets stopped out more often. Whichever you choose, apply it the same way every time and log the results. Results are not guaranteed; past performance is not indicative of future results.
External references
- For background on this concept, see Shooting Star at BabyPips Forexpedia.
- For broader market context, see Shooting Star at Corporate Finance Institute.

About the author
Written by Dominic Walsh, a Forex trader and MT4/MT5 indicator, Expert Advisor and script developer. Every tool on forexmt4systems.com is tested on live charts before release and ships with ready-to-use compiled MT4 (.ex4) and MT5 (.ex5) files. Learn more about the trader and developer behind this site.
How we build, test and correct every tool: Editorial & Testing Policy. Trading carries risk; see the disclaimer.