
A candlestick tells you what just happened inside one bar. Candlestick patterns at support and resistance carry far more weight than the identical shapes printed in the middle of a range, and that difference decides most of your results.
This guide treats location as the first filter and the pattern as the second. You will learn how to mark a level worth trading, how to read a rejection bar that lands on it, and why the same bar mid-range deserves nothing at all.
Why Candlestick Patterns at Support and Resistance Read Differently
Every candle describes a fight over one session. The body shows where that fight settled, and the wicks show how far each side pushed before losing ground.
So a long lower wick simply reports rejection. It says sellers drove price down, buyers pushed back, and the close finished near the high.
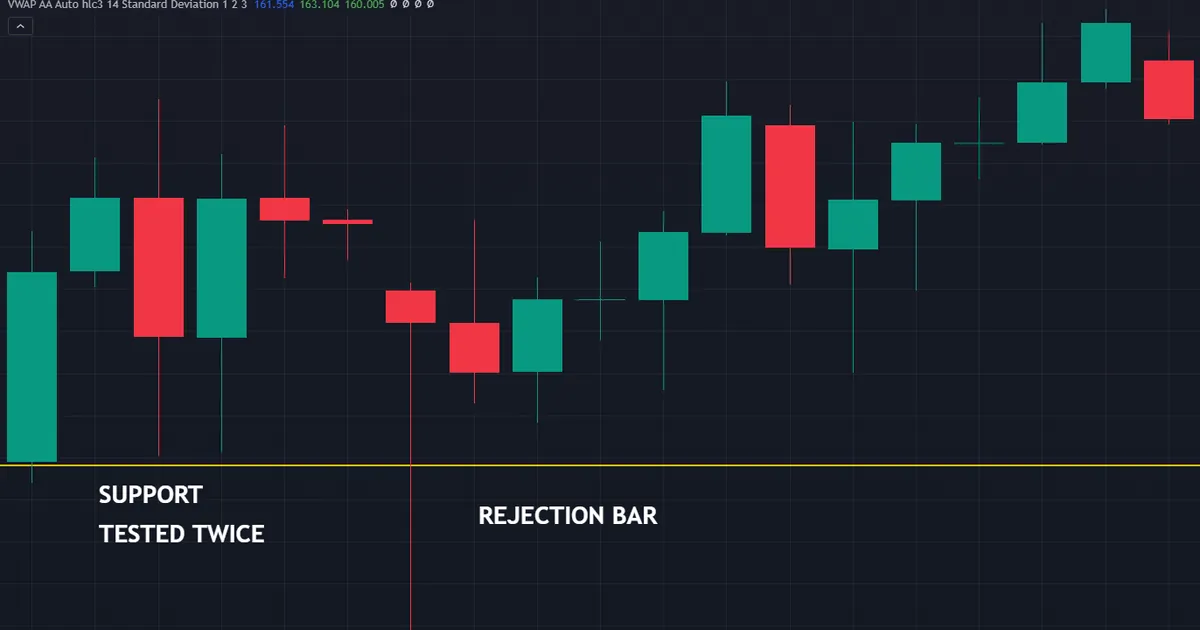
Now ask where the rejection happened. If price had already turned twice from the same area, other traders watched that area too, so their orders help explain the wick.
Mid-range, no such explanation exists. The wick still shows rejection, yet nobody had a reason to defend that spot, so the reaction rarely draws further interest.
A Pattern Describes, It Does Not Predict
Keep the language honest. A hammer does not forecast a bounce; it records one bar in which sellers lost control of the low.
Prediction needs context, and the level supplies it. Levels mark where resting orders already sit and where other traders plan to act.
Treat the candle as evidence, then, and treat location as the thing that prices that evidence. Neither half works alone.
Why the Crowd Effect Matters
Levels work partly because enough people believe in them. Traders mark the same swing high, orders cluster there, and price reacts to the cluster.
That reaction leaves a footprint on the chart. A long wick, a tiny body or a sharp reversal bar all record the same burst of clustered intent.
So the candle becomes a receipt for order flow you cannot see directly. Strip the level away and the receipt has no story behind it.
How to Mark a Level That Actually Matters
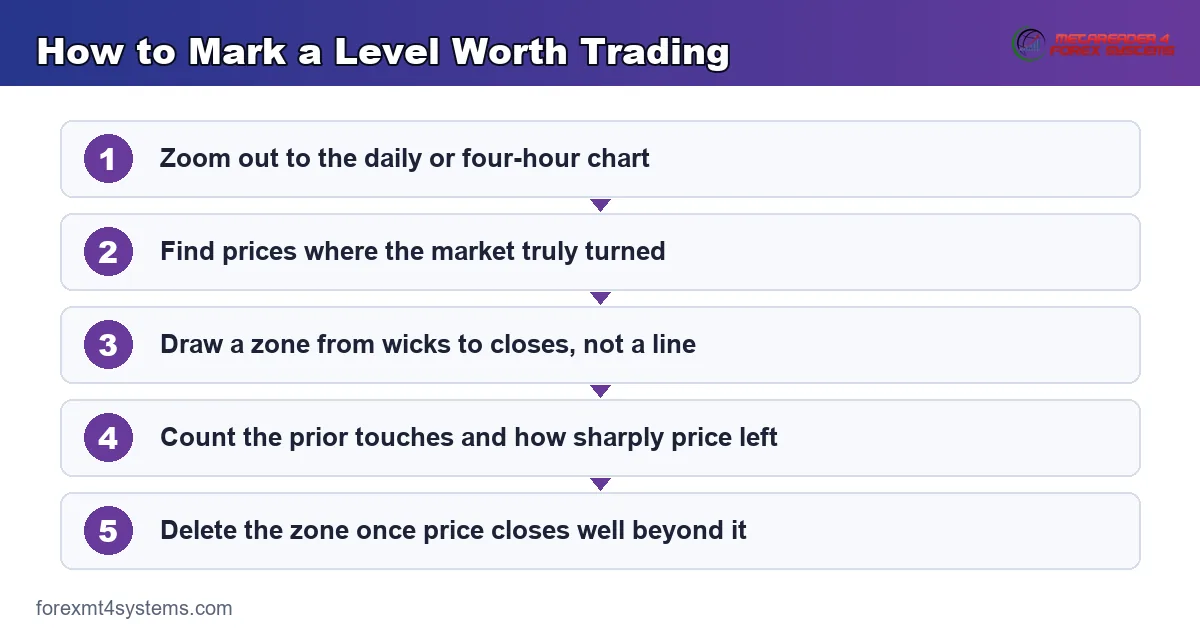
Most charts end up covered in lines that never mattered. A short, strict routine keeps only the areas with real history behind them.
- Zoom out first. Drop to the daily or four-hour chart before you mark anything, because higher timeframes hold the levels most traders share.
- Find the real turns. Look for prices where the market reversed sharply or stalled for several bars, not every minor pivot.
- Draw a zone. Use the cluster of wicks and closes to set a band rather than a single line, since price rarely honours an exact figure.
- Count the touches. Two prior reactions make a level; one makes a guess. Note how hard price left the area each time.
- Prune often. Delete a zone once price closes well beyond it for several bars, because stale lines clutter every later decision.
Five or six zones per pair covers almost everything you need. Our guide to support and resistance walks through the drawing routine in more depth.
Zones Beat Lines
Price never respects a one-pixel line. Wicks overshoot, spreads widen, and probes run a few points past the obvious figure.
So mark the band between the extreme wick and the cluster of closes. That band gives a candle signal room to form without breaking your idea.
Width matters as well. On a major pair’s daily chart a zone might span twenty to thirty pips, while an intraday zone runs far tighter.
Fresh Levels Versus Worn Levels
A zone tested once often holds again. Each further test chews through the orders sitting there, so a fourth touch usually carries less weight than a second.
Traders disagree about the exact count, and no fixed number settles it. Watch behaviour instead: a slow grind into the zone hints that the orders have thinned.
Sharp rejections tell the opposite story. When price snaps away from the band, plenty of interest still defends it.
Which Timeframe Owns the Level
A zone drawn on the daily chart outranks one drawn on the five-minute. More participants see it, so more orders gather around it.
Use the higher chart to place the zone and the lower chart to read the candle. That split keeps your levels meaningful and your entries precise.
Our walkthrough of multi-timeframe analysis covers the pairing in detail. Two charts usually suffice, and a third adds more noise than value.
What a Rejection Bar Says When It Lands on a Level
Picture a bar with a long lower wick, a small body near the top and almost no upper wick. Traders call that shape a hammer, or a bullish pin bar.
Read it literally first. Sellers pushed price down through the session, buyers reclaimed the ground, and the close landed near the high.
Now add the zone underneath. The wick pierced your support band and the close finished back inside it, so the band absorbed a genuine test.
The Three Questions to Ask
Ask where the wick ended. A wick that pokes into the zone and recovers reads very differently from one that stops short of it.
Ask where the close landed. A close back above the zone supports the defence, while a close below it does the opposite.
Ask what came next. One bar proves little, so the following bar often settles whether the level held or not.
Wick Length Against Body Length
Ratios help you sort a genuine rejection from a lazy one. Most traders want the wick to run at least twice the length of the body.
Compare the bar with its neighbours as well. A wick that dwarfs the previous five bars carries a different message from one that matches them.
Absolute size matters least of all. What counts is the proportion of the range that price handed back before the close.
The Same Bar in Open Space
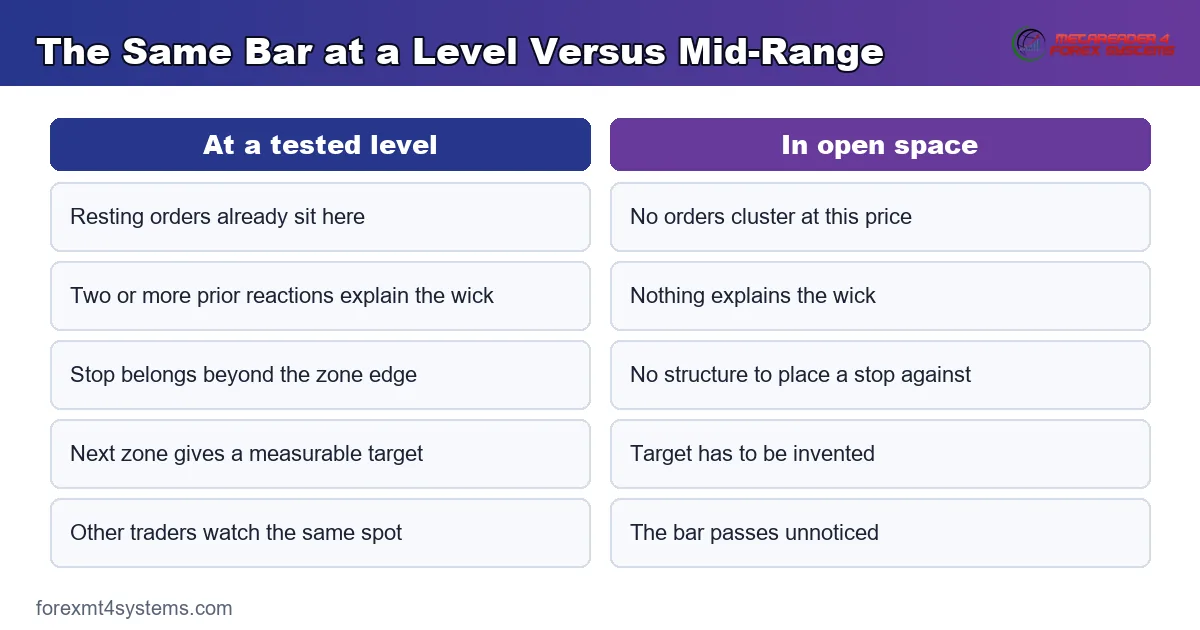
Take that identical hammer and drop it into the middle of a range. Nothing about the geometry changes, yet the meaning collapses.
No resting orders sit under it. The wick records a brief burst of selling against a brief burst of buying, and the two simply cancel.
So the bar becomes noise. Our note on candlestick wicks covers what a long tail can and cannot tell you on its own.
How Other Patterns Read at a Level
An engulfing bar at resistance shows a second body swallowing the first. That takeover matters more when it happens where sellers already stepped in twice.
A doji at a level reports indecision right where a decision was due. Traders treat it as a pause rather than a turn, and they wait for the next close.
An inside bar at a zone shows the range contracting on arrival. Contraction at a level often precedes a fast move, though the direction stays open until price breaks the small bar.
A Worked Example: The Same Bar, Two Locations
Take a cross that has stalled twice under one price on its four-hour chart. You mark the line, then price grinds back up to it.
One bar pokes above the line and cannot hold there. The next bar opens at that close, covers the whole of it, and finishes well underneath.
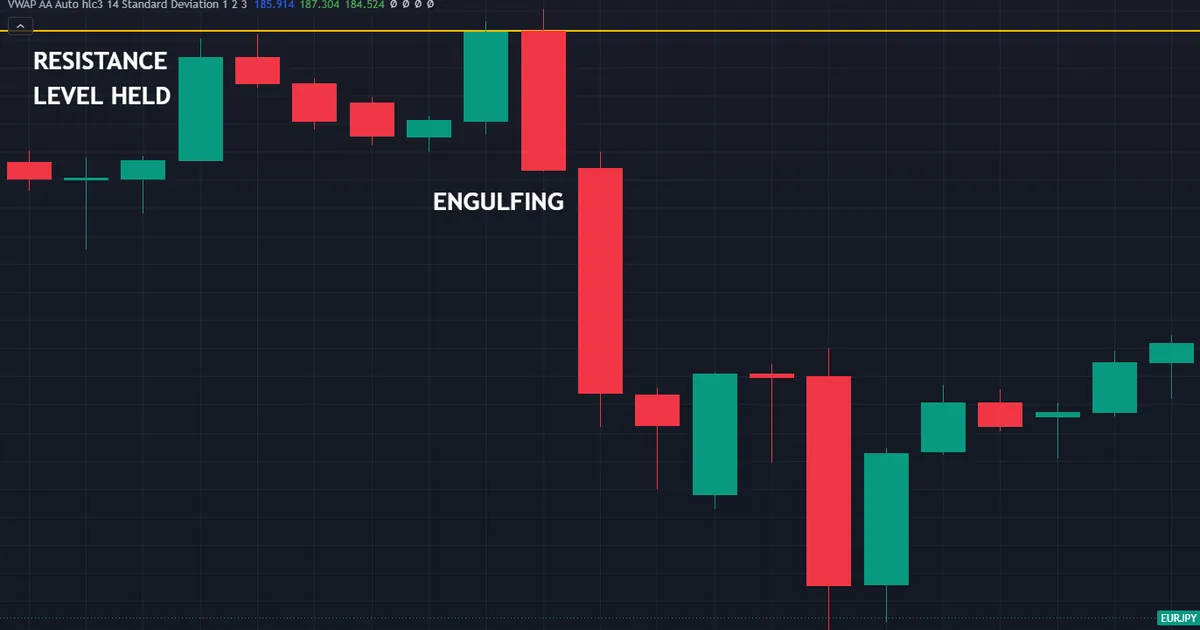
That bar earns attention. It arrived exactly where you already expected sellers, and it closed in a way that supports the idea.
Weeks later the same cross printed the same engulfing shape in the middle of its hourly range. Nothing marked that spot, so the bar passed without a trade.
Reading the Two Bars Side by Side
Both bars share the same structure. Each one opens at the prior close, then swallows the body before it.
Only the surroundings differ. One arrives at a line you drew in advance, while the other floats in territory price crossed without pausing.
So the filter costs you nothing to apply. Mark the zones first, then let candles decide only among locations you already care about.
What Confirmation Adds
Waiting one more bar removes a lot of poor entries. A close above the rejection bar’s high adds a second piece of evidence for a small cost in price.
Some traders enter on the close of the signal bar instead. That route buys a tighter stop, though it accepts more failed attempts in exchange.
Neither choice suits everybody. Test both against your own records and keep the one your temperament can repeat under pressure.
Grading the Two Setups
Score each candidate quickly before you risk anything. Three inputs cover it: the quality of the zone, the clarity of the bar, and the room to the next obstacle.
The bar at the band scores well on all three. Two prior reactions back the zone, the wick and the close read cleanly, and open space runs toward the previous swing high.
Meanwhile the mid-range bar fails the first input outright. A perfect candle cannot rescue a location that nobody else cares about.
Write those three scores in your journal beside every trade. After thirty entries, your own records will teach you more about location than any article can.
Download the complete indicator database
Put these concepts on your charts. One email unlocks the full library of 1,380+ indicators with compiled MT4 and MT5 files, plus my TradingView scripts. No paywall, no spam, unsubscribe any time.
Get free access to my indicator database
One email unlocks 1,380+ free MT4, MT5 and TradingView indicators — the complete library. No single-tool download; you get the whole database.
Building the Entry Around Location, Not the Pattern
Once a zone and a candle line up, the trade almost writes itself. Your stop belongs beyond the structure, and your first target belongs at the next level.
Notice the order of operations here. Location sets the risk, while the candle only picks the moment.
Where the Stop Belongs
Put the stop beyond the far side of the zone, not merely beyond the candle. A wick that pierced the band already showed you how far the market will probe.
Then add a small buffer for spread and volatility. Our guide to ATR shows one simple way to size that buffer from recent range.
A stop tucked right under the signal bar looks efficient on paper. It also sits exactly where the next probe runs, which turns a decent idea into a loss.
Where the Target Belongs
Look left for the next zone in the direction of the trade. That zone marks where the move plausibly stalls, so it makes a sensible first target.
Measure the distance before you commit. If the nearest obstacle sits closer than your stop, the trade fails on arithmetic alone.
Run the numbers through our free risk reward calculator before you click. A quick check removes most of the trades that never had room to work.
Position Size Follows the Stop
Your stop distance comes from the structure, so your position size has to follow it. A wider zone means a smaller position, never a tighter stop.
Fix the risk per trade in advance and let lot size adjust around it. That habit keeps a wide daily setup and a narrow intraday one equally survivable.
When Two Levels Agree
Sometimes a horizontal zone lines up with something else, such as a round number, a moving average or a retracement level. Traders call that agreement confluence.
Confluence raises your interest in the location rather than your certainty about the outcome. More participants watch the spot, so reactions there tend to arrive faster and travel further.
Keep the overlays few, though. A chart carrying six tools will always find agreement somewhere, which quietly turns every location into a good one.
Ranking Levels Before the Session Starts
Preparation beats reaction in this method. Ten minutes with a clean chart gives you a ranked list of zones and saves you from improvising later.
The table below sets out a simple grading scheme. Treat it as a starting point, then adapt the wording to match your own notes.
| Zone quality | What you see | How to treat a candle signal there |
|---|---|---|
| Strong | Two or three sharp reactions, drawn on the daily chart, untouched for weeks | Plan a normal-size trade if the close confirms |
| Fair | Two reactions on the four-hour chart, or a daily zone already tested three times | Trade smaller, or wait for a second bar |
| Weak | One shallow pivot, or a zone price recently sliced straight through | Watch only, and take no signal from it |
| None | Open space between marked zones | Ignore every candle shape that forms here |
Notice that the candle never appears in the left column. Location grades the opportunity first, and the bar simply decides the timing afterwards.
Keeping the Watchlist Small
Four or five pairs give you plenty of zones to work with. A longer list forces you to rush the marking, which is precisely where the errors start.
Review that list once a week and again each morning. Levels rarely change fast, so the daily pass takes only a couple of minutes.
Common Mistakes With Candle Signals at Levels
A handful of errors account for most of the disappointment in this approach. Each one carries a simple fix.
Marking Levels After the Candle Appears
Hindsight will find a level under any attractive bar. Draw your zones before the session opens, then judge candles against lines you cannot move.
Using a Single Line Instead of a Zone
An exact price gets pierced routinely. Mark the band between the wick extreme and the closes, and let the candle form anywhere inside it.
Ignoring the Prevailing Trend
A bullish rejection inside a strong downtrend faces far more supply than the same bar inside a range. Check the higher timeframe direction before you treat any zone as a springboard.
Trading Every Single Touch
Levels get tested often, and most tests produce nothing tradable. Wait for a candle that closes back inside the zone rather than reacting to first contact.
Forgetting the Session Clock
A zone tested during a quiet hour behaves differently from the same zone tested at the London open. Note the time before you read the bar.
Chasing the Bar Instead of the Level
Entering three bars later usually means paying for somebody else’s edge. When price has already run, skip it and wait for the next zone.
Judging the Bar Before It Closes
A hammer can turn into an ordinary red bar in the final seconds. Wait for the close, because an unfinished candle tells you nothing reliable about the session.
Quick Reference Checklist
Run this list before any trade built on a candle at a level. Seven answers cover the whole decision.
- Did I mark this zone before price arrived, using a higher timeframe?
- How many times has price reacted here, and how sharply each time?
- Did the candle’s wick actually reach into the zone?
- Did the close finish back inside the zone or beyond it?
- Where does the next opposing zone sit, and does it leave room?
- Does my stop sit beyond the structure rather than beyond the bar?
- Does the higher timeframe trend help this idea or fight it?
Any answer you cannot give quickly points to a trade you have not thought through. Skip that one and wait for something cleaner.
When Location Trading Goes Wrong
Levels break, and often. Yet the commoner failure is simpler still: a strong bar with no level under it at all.
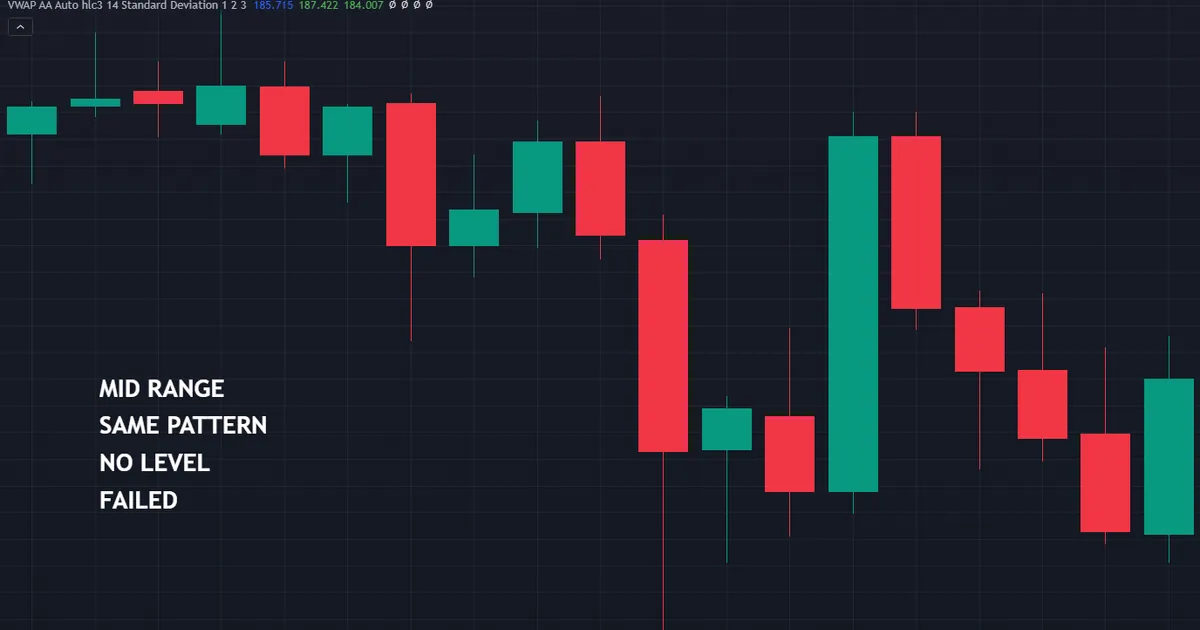
Look at the failure honestly. The bar reported real buying, and then real selling simply overwhelmed it. No marked level gave those buyers anything to lean on.
Strong Trends Eat Levels
Inside a powerful move, support gives way with barely a pause. Countertrend candle signals fail most often in exactly those conditions.
News Overrides Structure
A scheduled release can push price through three zones in a minute. Check the calendar, because structure loses much of its meaning during a repricing event.
The Level Was Never Real
A zone drawn from one weak pivot has no order flow behind it. Two clear prior reactions remain the minimum before you trade a level at all.
Too Many Zones on One Chart
Twelve lines put a candle near one of them at all times. Cut the list back to the handful with genuine history, because a crowded chart manufactures signals rather than finding them.
Stop Placement Invited the Loss
Plenty of losses trace back to a stop parked at an obvious figure. Push it beyond the zone and cut size to keep the money risked unchanged.
The Break Itself Was the Signal
Sometimes the useful trade runs the other way. A zone that fails after several tests often starts a move, so a break and retest deserves its own plan.
Our note on liquidity sweeps covers the version where price takes the stops first and then reverses. Both outcomes come from the same level, which is why one candle can never decide the trade for you.
Related Concepts to Study Next
Location works best beside a solid grasp of the patterns themselves. A few neighbouring guides finish the picture.
Start with our overview of candlestick patterns for the anatomy and the families. Then read our even-handed look at whether candlestick patterns work, since the evidence shapes how much weight any single bar deserves.
For tooling, browse our support and resistance indicators to automate the zone drawing. Our candlestick indicators flag the shapes as each bar closes, which saves screen time on lower timeframes.
FAQ
Do candlestick patterns work better at support and resistance?
Traders widely treat location as the deciding factor, and the reasoning holds up: a level marks where resting orders already sit, so a rejection there has a cause behind it. Nobody can promise a better outcome, though. Treat the level as the reason to look and the candle as the reason to act.
How many touches make a level worth trading?
Two clear prior reactions form a workable minimum. One reaction gives you a guess rather than a level. Beyond three or four touches, the orders sitting there tend to thin out, so watch how sharply price leaves the zone on each test.
Should I draw a line or a zone?
Draw a zone. Price overshoots exact figures constantly, and a band between the extreme wick and the cluster of closes tolerates that noise. Your candle signal then has room to form without invalidating the idea on a one-pip technicality.
Which candlestick patterns suit levels best?
Rejection shapes fit naturally, since a long wick shows price probing the zone and failing. Hammers, shooting stars, engulfing bars and outside bars all report that struggle clearly. The shape matters far less than where it forms and where it closes.
Where do I put the stop on a candle signal at a level?
Place it beyond the far edge of the zone, plus a buffer for spread and volatility. A stop hidden just under the signal bar sits in the most obvious spot on the chart. Widen the stop and reduce the position size so the money at risk stays the same.
Can I trade a candlestick pattern without a level?
You can, but you give up the context that makes the bar meaningful. A rejection in open space records a short tussle that nobody had a reason to join. Location remains the cheapest filter available, and it costs nothing except patience. Results are not guaranteed; past performance is not indicative of future results.
External references
- For background on this concept, see Resistance at BabyPips Forexpedia.
- For broader market context, see Rectangle at StockCharts ChartSchool.

About the author
Written by Dominic Walsh, a Forex trader and MT4/MT5 indicator, Expert Advisor and script developer. Every tool on forexmt4systems.com is tested on live charts before release and ships with ready-to-use compiled MT4 (.ex4) and MT5 (.ex5) files. Learn more about the trader and developer behind this site.
How we build, test and correct every tool: Editorial & Testing Policy. Trading carries risk; see the disclaimer.