
Every candle on your chart carries two stories. The body records where the session started and finished, while the wicks record everywhere price went and failed to stay.
Candlestick wicks meaning starts with that one idea: a wick marks ground taken and then given back. Learn to read the thin lines and most named patterns stop feeling like magic.
What Candlestick Wicks Meaning Comes Down To
A wick draws the distance between the body and an extreme. On the upper side it runs from the top of the body to the high; on the lower side it runs from the bottom of the body to the low.
So a long upper wick says price traded up there and could not hold it. A long lower wick says the same thing in reverse.

Nothing about that description predicts anything. It reports a round trip inside a fixed window, and the round trip only matters when it happens somewhere that already mattered.
Keep that framing throughout. A wick is evidence about the past, not a forecast about the next bar.
Wick Anatomy in Plain Terms
Four numbers build every candle: open, high, low and close. The body spans open to close, and the wicks fill whatever range remains.
Upper Wick and Lower Wick
The upper wick measures high minus the top of the body. On a bullish bar that means high minus close; on a bearish bar it means high minus open.
The lower wick works the same way at the bottom. It measures the distance from the low up to whichever end of the body sits lower.
Both lines describe rejected prices. Somebody traded there, and by the close nobody wanted to keep the position at that level.
Shadow, Tail and Wick
Three words describe one thing. Classic Japanese texts say shadow, price-action traders say tail, and most charting software says wick.
Do not read meaning into the vocabulary. Some writers reserve tail for the longer of the two lines, which is a habit rather than a rule.
Pick one word and stay with it in your notes. Consistency in your own record beats matching anybody else’s terminology.
What a Wick Does Not Record
A wick shows no timing. Price might have spent one minute at the extreme or half the session there, and the candle looks identical either way.
It also shows no volume in spot forex, where feeds report tick counts rather than traded size. So a dramatic line proves activity, not commitment.
Finally, it shows no order flow. You cannot tell from the chart whether the reversal came from real selling or from a lack of buyers.
Where Wicks Come From
A wick appears when price reaches a level and then leaves it. Two very different mechanisms produce that, and they look identical on the chart.
Orders Waiting at a Price
Resting limit orders absorb the flow arriving at a level. Buyers meet a wall of offers, the push stalls, and price drifts back toward the body.
That version fits the classic rejection story. Something sat there, and it held.
You cannot see the order book from a candle, though. The chart shows an outcome, and the explanation remains a reasonable guess rather than a fact.
Orders Missing at a Price
The opposite mechanism produces the same picture. Thin liquidity lets a modest order push price a long way, and price snaps back once normal quoting resumes.
Here nobody rejected anything. The book simply emptied for a few seconds, then refilled.
Session timing separates the two cases better than anything else on the chart. A line built during the London and New York overlap usually reflects real orders; a line built at rollover usually does not.
Stops Feeding the Move
Clusters of stop orders sit just beyond obvious highs and lows. Once price reaches them, those stops turn into market orders and extend the spike.
That mechanism explains why extremes frequently overshoot a level by a small margin before turning. The overshoot belongs to the structure rather than to a flaw in your level.
So place invalidation levels with a buffer. Sitting exactly on the obvious price puts you inside the crowd that the spike goes looking for.
How to Read a Wick, Step by Step
Reading a wick well takes about twenty seconds. Work through the sequence rather than reacting to the picture.
- Measure the line. Express each wick as a percentage of the bar’s total range, not in pips.
- Compare the bar. Check the whole range against the recent average, because a long wick on a tiny bar means little.
- Locate it. Ask which level, swing or trend line the extreme touched.
- Check the clock. Note the session, since thin hours stretch ranges for their own reasons.
- Drop a timeframe. Look at how the extreme formed, because one spike reads differently from a long grind.
- Write the invalidation. The wick extreme gives you a natural line, and that distance sets your position size.

So the measurement comes first and the story comes last. Reverse that order and you will find a narrative for every bar on the chart.
Because step six sets your risk, it deserves the same attention as the interpretation. A dramatic wick creates a wide stop, and a wide stop shrinks the position.
Wick-to-Body Ratios
Raw length tells you almost nothing on its own. A forty-pip wick means one thing on a quiet pair and something else entirely on a volatile one.
Why the Ratio Beats the Raw Length
Dividing the wick by the total range gives you a figure that travels between pairs and timeframes. It also survives changes in volatility.
Most single-bar patterns hide a ratio rule inside them. A hammer asks for a lower wick around two-thirds of the range with a small body at the top, which is simply a ratio wearing a name.
Our note on hammer candlestick meaning works through that example. Read it as a ratio and the pattern becomes much easier to spot.
Rough Bands Traders Use
No official thresholds exist, so treat the following as common conventions rather than measured facts. A wick under about a tenth of the range barely registers.
Between roughly a tenth and a third, the line describes ordinary two-way trade. Above about half the range, traders start calling it a rejection.
At the extremes the shape gets its own names. A bar with no wicks becomes a marubozu candlestick, while a bar with no body becomes a doji.
Where the Body Sits Inside the Range
Ratio alone misses one thing: position. A bar can carry a long lower wick with the body at the top or with the body in the middle.
Body at the top means the close finished near the high, so the recovery ran all the way. Body in the middle means the recovery stopped halfway.
So record both figures. Wick percentage tells you how much ground price gave back, and body position tells you how convincingly it came back.
Two Wicks on One Bar
Plenty of bars carry long lines at both ends. That combination describes a fight rather than a rejection.
Price probed both directions and finished near where it started. Our page on doji candle meaning covers the version where the body disappears completely.
Treat those bars as information about uncertainty. They rarely support a directional decision on their own.
Recording the Numbers
Judging ratios by eye drifts over time. One habit fixes that: note the wick percentage and the body position for every bar you act on.
Most platforms show the four prices in a tooltip, so the arithmetic takes seconds. Two numbers per trade build a genuine sample within a month.
Then review by band rather than by pattern name. Grouping your trades by wick percentage often reveals more than grouping them by label.
Wicks at Levels Against Wicks in Open Space
Location decides whether a wick carries information. The identical line means two very different things depending on where it prints.
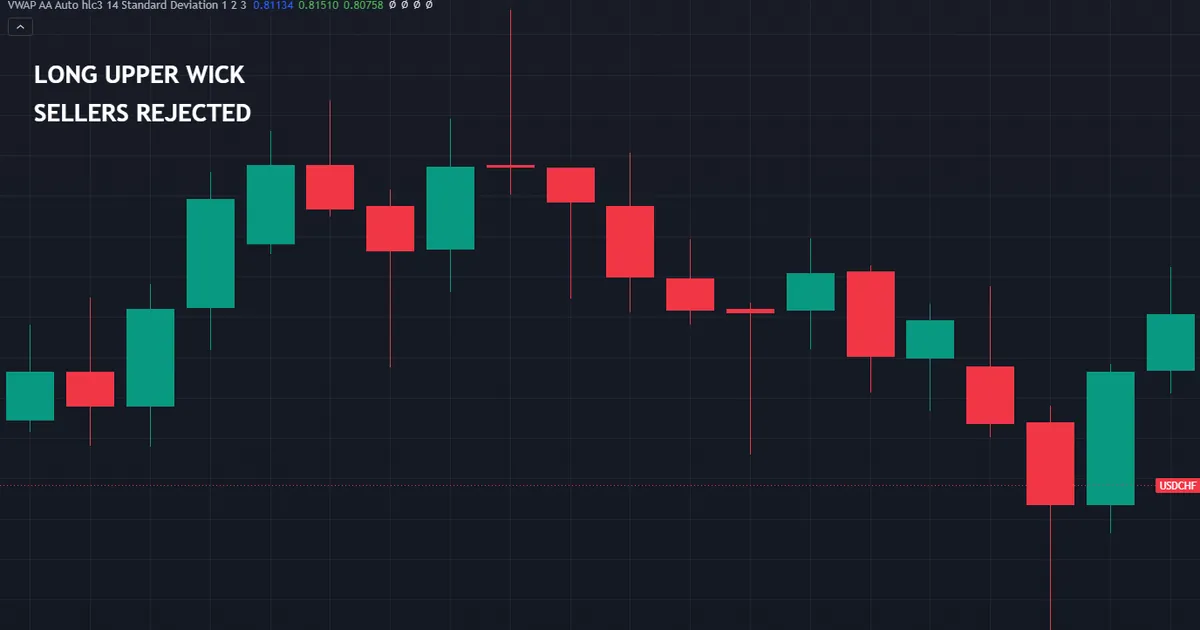
A Wick at a Tested Level
Draw a level from two previous reactions, then watch price poke through it and snap back within one session. That wick tells you something specific.
Orders sat there before, and orders appear to sit there still. The market tested the price and rejected it, which is exactly the event your level predicted.
So the level does the analytical work and the wick supplies the timing. Reverse those roles and the reading falls apart.
A Wick in Open Space
Now picture the same line in the middle of a range with nothing drawn near it. Price stretched, came back, and told you nothing you could act on.
Markets produce these constantly. Ordinary two-way trade generates long lines without any level, story or shift in control.
Mark your levels before you look for candles. That single habit removes most bad wick readings from your process.
Repeated Wicks at the Same Price
Three or four bars poking into the same zone and closing back out builds a stronger case than any single bar. The market keeps testing and keeps failing.
Traders call the cluster a wick rejection zone or, in smart-money language, a liquidity area. Our guide to liquidity sweep trading covers the version where price runs the stops beyond the zone before turning.
Still, repetition can also mean the level is wearing thin. Each test consumes some of the orders that made it matter.
Download the complete indicator database
Put these concepts on your charts. One email unlocks the full library of 1,380+ indicators with compiled MT4 and MT5 files, plus my TradingView scripts. No paywall, no spam, unsubscribe any time.
Get free access to my indicator database
One email unlocks 1,380+ free MT4, MT5 and TradingView indicators — the complete library. No single-tool download; you get the whole database.
The Same Wick on Different Timeframes
One wick on a daily chart is a whole afternoon on a fifteen-minute chart. That difference changes the reading more than most traders expect.
What the Lower Timeframe Reveals
Drop down and the extreme resolves into a shape. Sometimes you find a single violent spike; sometimes you find twenty bars grinding at the high before a slow retreat.
Both produce the same daily wick. They describe different events, though, and the slow grind usually reflects genuine two-way trade.
So drop a timeframe before you commit to an interpretation. Our page on multi-timeframe analysis sets out a workable routine for that.
Why a Daily Wick Hides Three Sessions
Forex trades around the clock, so a daily bar bundles Asia, London and New York together. A long upper wick might belong entirely to one of them.
An extreme set during the quiet Asian hours carries less weight than one set during the London and New York overlap. Same line, different crowd behind it.
Check the clock as a matter of routine. Session timing explains a surprising share of odd-looking wicks.
Nesting the Two Together
The practical routine stays simple. Find the level on the higher chart, then inspect the wick on the lower one.
Structure comes from above and detail comes from below. Two timeframes answer the question; four usually start an argument with yourself.
Keep the pairing fixed as well. Daily with hourly, or four-hour with fifteen-minute, gives you a consistent ratio between the two charts.
Consistency matters more than the exact combination. Switching pairs of charts by mood makes your own review data almost useless.
When a Wick Is Just Thin Liquidity
Not every long line describes rejection. Some describe an empty order book and nothing more.
Rollover, Holidays and the Weekly Open
Spreads widen at the daily rollover, around public holidays and at the Sunday open. Thin books let small orders travel a long way.
A wick formed in those windows records a shortage of participants. Nobody rejected anything; there was simply nobody home.
So flag those periods on your chart. A rule that skips the first hour of the trading week removes a lot of noise.
News Spikes
Scheduled releases produce dramatic lines in seconds. Price gaps through the book, then snaps back once liquidity returns.
Those wicks record an event and a temporary vacuum. They rarely describe a considered rejection by anybody.
Keep an economic calendar beside your charts. A wick you can explain by a release deserves far less weight.
Feed and Broker Differences
Two brokers can print different extremes on the same bar, since each aggregates its own liquidity. The bodies usually match closely, while the wicks often do not.
That matters for stop placement. A stop sitting a fraction beyond a wick extreme may survive on one feed and not on another.
So build a buffer into the invalidation. Our ATR position size calculator helps you fund that buffer without inflating the risk.
Chart Type and Settings
Your chart settings quietly change what you see. Bid-only charts and bid-ask charts print different extremes, and switching between them moves every wick on the screen.
Timezone settings matter just as much. A daily bar starting at midnight in one zone splits sessions differently from one starting five hours later, so the same market produces different wicks.
Fix both settings once and leave them alone. Comparable charts week after week beat any single clever configuration.
Common Mistakes, and How to Fix Them
Wick reading goes wrong in predictable ways. Each error has a short correction.

Measuring Wicks in Pips
Pip length varies with volatility, pair and timeframe. The fix: convert every wick into a percentage of the bar’s range before you compare anything.
Reading a Wick With No Level
A rejection needs something to reject. The fix: draw your levels first, then only interpret wicks that touch them.
Acting Before the Close
A forming bar’s wick can vanish in the final minutes. The fix: wait for the close, and set alerts rather than watching every tick.
Ignoring the Body Position
A long lower wick with the body in the middle says something weaker than the same wick with the body at the top. The fix: record body position alongside the ratio.
Trusting Wicks on Thin Instruments
Exotic crosses stretch their extremes for structural reasons. The fix: stick to pairs whose spreads stay tight during the hours you trade.
Comparing Wicks Across Pairs
A thirty-pip line on a quiet cross and the same line on a volatile one describe different events. The fix: normalise against each pair’s own average range before you compare anything.
Letting the Wick Set Your Risk
A huge line creates a huge stop. The fix: convert the invalidation into position size first, then decide whether the trade still fits your plan.
Quick Reference Checklist
Run these questions on any wick that catches your eye. Seven answers settle it.
- How long is the wick as a percentage of the bar’s total range?
- Where does the body sit inside that range?
- Does the bar’s range clear the recent average for this pair?
- Which level, swing or trend line did the extreme touch?
- Which session produced the extreme?
- Did a scheduled release or a thin period create it?
- Where does the invalidation sit, and what size does that allow?
What Each Shape Reports
| Shape | Wick pattern | What it records |
|---|---|---|
| Long lower wick, body at top | One long line below | Price traded down there and came all the way back |
| Long upper wick, body at bottom | One long line above | Price traded up there and came all the way back |
| Long wicks both ends | Two long lines | Both directions tested and both failed |
| Short wicks, long body | Barely any lines | One side held ground for the whole session |
| Long wicks, no body | Two lines, flat middle | The session finished where it started |
When a Wick Reading Fails
Wicks mislead often enough to deserve their own list. Below, a bar stretches both ways in a quiet hour. Then the next candle closes straight through its low.
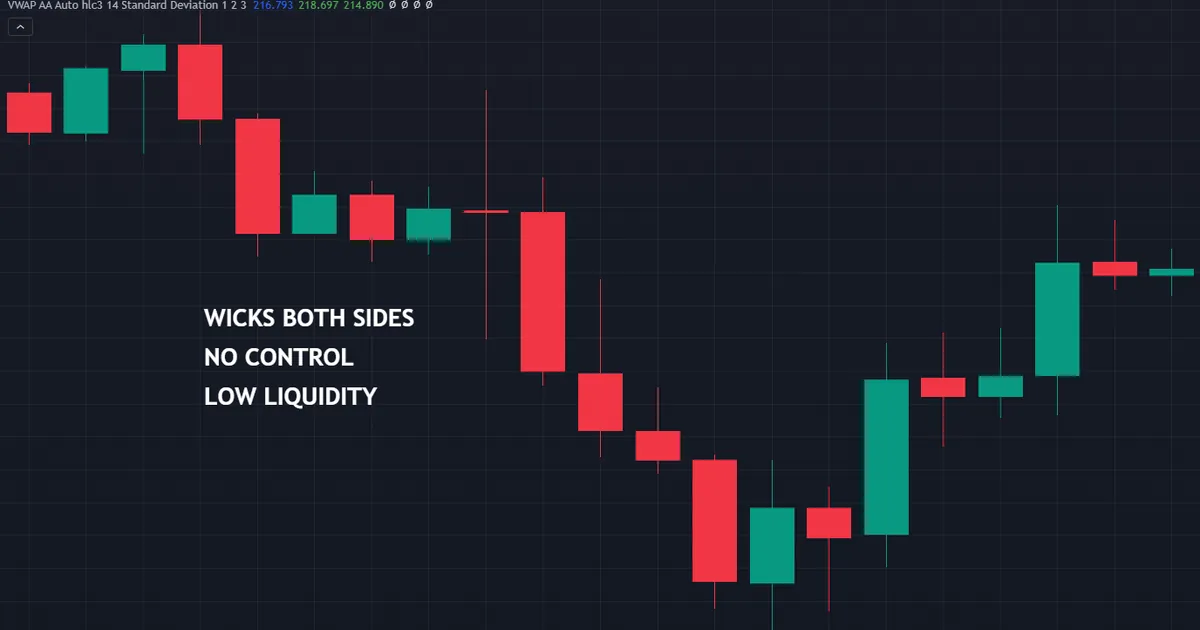
The Extreme Breaks on the Next Bar
A perfect rejection line prints, then the following session closes straight through the extreme. One window of failure carries no obligation to repeat.
The Spike Was a Data Artefact
Bad ticks and feed glitches produce lines that never really traded. Compare a suspicious extreme against a second source before you build anything on it.
The Wick Sat in Open Space
Without a level, the line describes ordinary volatility. Our note on pin bar meaning covers how the same shape gets over-read when nothing sits beneath it.
The Zone Wore Out
Repeated tests can exhaust a level rather than reinforce it. A fourth wick into the same price often precedes a clean break rather than another turn.
The Stop Sat Too Close to the Extreme
Feeds disagree by a fraction, and stop hunts target obvious lines. A correct reading can still lose if the invalidation sits exactly where everybody else placed theirs.
Related Concepts to Study Next
Wicks underpin most single-bar patterns, so this page pairs well with several others. A short reading list finishes the job.
Browse the wider candlestick indicators library for tools that measure these ratios automatically, then look through the price action indicators collection for level-marking tools that give your wicks somewhere to land.
After that, build your own sample. Log thirty wicks with the ratio, the level, the session and what followed, because your record teaches you more than any general claim about the shape.
FAQ
What does a long wick on a candlestick mean?
It means price traded to that extreme during the session and finished somewhere else. Buyers or sellers took ground and then gave it back. That description says nothing about the next bar, which is why location matters far more than the line itself.
How long does a wick need to be before it counts?
No official threshold exists. Many traders start paying attention above roughly half the bar’s total range, and treat anything under a tenth as noise. Choose your own figure, write it into your plan, and apply it the same way on every chart.
Are wicks and shadows the same thing?
Yes. Shadow comes from the classic Japanese literature, wick comes from most charting software, and tail comes from price-action traders. All three describe the line between the body and an extreme, so the choice of word carries no meaning.
Do wicks mean anything without a support or resistance level?
Very little. Ordinary two-way trade produces long lines all day without any change in control. A wick becomes useful when it lands on a price you had already marked, because then it confirms something you expected rather than inventing a story.
Why do wicks differ between brokers?
Each broker aggregates its own liquidity, so extremes vary slightly between feeds while bodies usually match. That difference matters most for stop placement. Leave a buffer beyond the extreme rather than sitting exactly on it.
Does a wick show how long price stayed at the extreme?
No. A candle records only four prices, so a single violent spike and a slow grind at the high produce an identical line. Dropping to a lower timeframe shows you which one actually happened, and that detail frequently changes the reading.
Can I trade wicks on their own?
Treat them as a location and timing tool inside a plan that already defines levels, risk and exits. A wick describes what happened during one window, and nothing more. Results are not guaranteed; past performance is not indicative of future results.
External references
- For background on this concept, see Shadow at Investopedia.
- For broader market context, see Doji at Corporate Finance Institute.

About the author
Written by Dominic Walsh, a Forex trader and MT4/MT5 indicator, Expert Advisor and script developer. Every tool on forexmt4systems.com is tested on live charts before release and ships with ready-to-use compiled MT4 (.ex4) and MT5 (.ex5) files. Learn more about the trader and developer behind this site.
How we build, test and correct every tool: Editorial & Testing Policy. Trading carries risk; see the disclaimer.