
Morning star pattern meaning rests on three consecutive bars rather than one. A large bearish candle, a small indecision candle, and a strong bullish candle that closes deep into the first body.
That sequence describes a handover. Sellers dominated, then stalled, and buyers took the next session convincingly.
So the shape reports what already happened. It makes no promise about the bars that follow, and the honest version of this guide keeps that distinction visible throughout.
Morning Star Pattern Meaning: The Three-Bar Anatomy
Each candle in the group carries a specific job. Miss one requirement and you have a different formation wearing the same name.
Work through the three bars in order, left to right. The third bar does the confirming, so judgement waits until it closes.
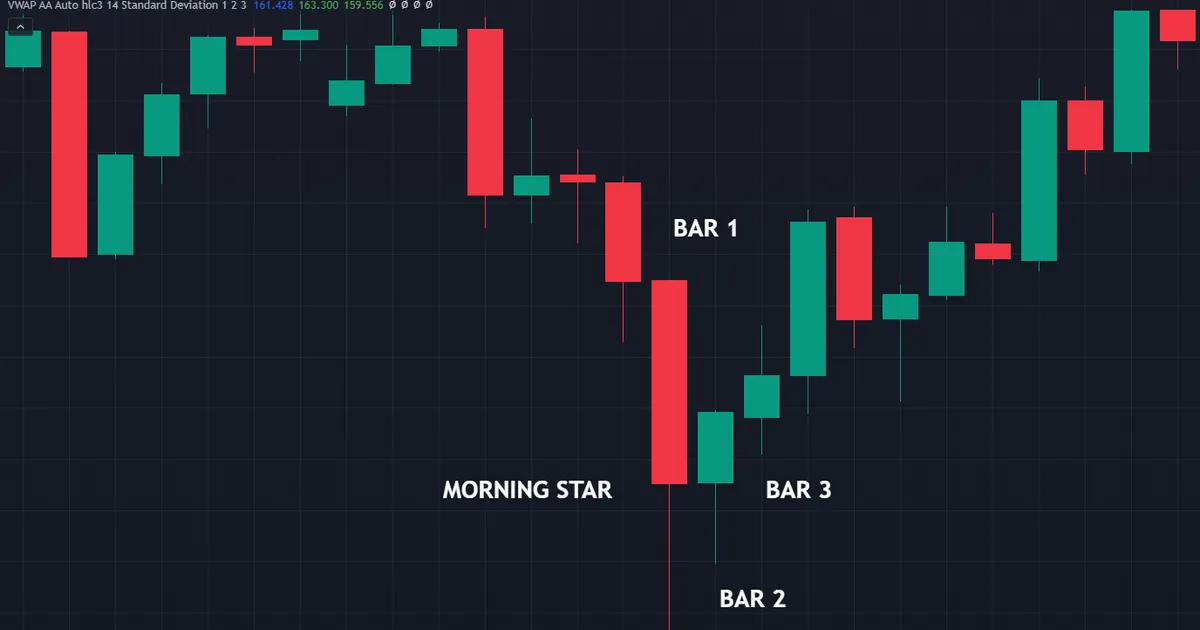
Notice that the pattern needs a prior decline to mean anything. The identical three bars in the middle of a range describe noise.
Bar One: The Large Bearish Body
The first candle prints a long body with a close near its low. It should look like a continuation of whatever decline preceded it.
Its size matters because the third bar has to reach back into it. A tiny first body makes the whole measurement meaningless.
Traders usually want that body larger than the recent average. A quick glance across the last ten bars settles the question.
Bar Two: The Small Indecision Bar
The middle candle carries a small body, and its colour hardly matters. A doji here works perfectly well, which produces the morning doji star variant.
Classic definitions ask this bar to gap below the first close. Rice and equity markets deliver such gaps routinely, and currency charts almost never do.
The essential idea survives without the gap. Selling pressure failed to extend, and the session closed near where it started.
Bar Three: The Strong Bullish Close
The third candle does the real work. It opens near the middle bar and closes well up inside the first candle’s body.
Volume, if your feed offers it, tends to rise on this bar. That rise adds a little weight, though tick volume in forex only approximates the real thing.
Without a decisive third close you have no pattern. Two bars and a hope describe a very different situation.
How Far Into the First Body
Definitions vary, and you should pick one deliberately. A common convention asks the third close to clear the midpoint of the first body.
Stricter readings want a close above the first candle’s open. Looser readings accept anything past a third of the way back.
Write your version down and measure it the same way every time. Consistency turns a fuzzy picture into a rule you can review later.
Where the Wicks Fit In
Traditional definitions measure bodies, not wicks. The third bar’s close matters, while its high adds only a little colour to the reading.
Long wicks on the middle bar still deserve a glance. A wide two-way session there says something different from a genuinely quiet one.
So record the bodies for the rule and the wicks for the notes. Mixing the two produces a definition nobody can reproduce.
Where the Pattern Came From
Candlestick charting traces back to Japanese rice trading, and traders link its early development to Munehisa Homma. Plenty of the Homma story remains unverified, so the safe line stops at the attribution.
Steve Nison brought these techniques to Western traders in the early 1990s. His writing supplied the English names, including the star family that this group belongs to.
Why the Name Says Star
The middle bar earns the label. A small body separated from its neighbours resembled a star sitting apart from the rest of the sequence.
That separation came from gaps in the original markets. The name survived into forex charts even though the visual separation largely did not.
Reading Older Material Carefully
Books written for stock charts assume daily bars and overnight breaks. Their rules often carry hidden assumptions about how a session begins.
So translate rather than copy. Ask what each requirement was measuring, then find the equivalent measurement on a continuous chart.
The Gap That Usually Is Not There
Here sits the biggest gap between textbook and screen. Most candlestick literature grew up on markets with an overnight break.
Spot forex trades continuously from Sunday evening to Friday evening. So the open of each bar sits within a pip or two of the previous close.
Why the Classic Definition Assumes a Gap
A gap lower carried real information in the original setting. It showed sellers pressing hard enough to reprice the market before trading even resumed.
When price then refused to fall further, the failure looked dramatic. The gap made the exhaustion visible in a single glance.
What Continuous Trading Changes
Without gaps, the middle bar simply prints a small body against the first bar’s close. The exhaustion still shows, though it shows through range rather than through a jump.
So forex traders read a contracted middle bar as the equivalent. The pattern loses some of its drama and keeps most of its logic.
Weekend gaps remain the one exception. A Sunday open away from Friday’s close can produce a textbook version, and those instances stay rare.
Adapting the Rule Honestly
Two adaptations serve most traders well. Drop the gap requirement, then compensate by demanding a genuinely small middle body.
Some traders add a second condition instead. They ask the middle bar’s range to fall below the average range of the previous several bars.
Either route keeps the spirit intact. Neither route turns the shape into something more predictive than it ever was.
Confirming a Morning Star Step by Step
Run the same sequence every time you spot the shape. Five checks cover the anatomy and the context together.
- Confirm the prior decline. The bars before the group must slope down, otherwise the name does not apply.
- Measure the first body. It should stand out as large against the recent average, with a close near its low.
- Check the middle bar. A small body, any colour, ideally with a narrow range compared with its neighbours.
- Measure the third close. It must land deep inside the first body, past whichever threshold your plan states.
- Mark the location. Note whether the group sits at support, at a prior swing, or in open space.
Only the fifth check decides whether the shape deserves attention. The first four merely confirm the label.
Give that fifth step the most time. Naming a level takes a moment on a chart you already marked, and rather longer on one you did not.
Traders who reverse the order almost always find what they wanted. A shape spotted first tends to summon a level to justify it.

So run them in that order and stop early when a check fails. Traders who work backwards from the location talk themselves into patterns that are not there.
What the Three Bars Actually Describe
The group records a change in the balance of pressure across three sessions. Nothing in it forecasts the fourth session.
Academic testing of standalone candlestick formations has generally found little consistent edge once costs enter the sum. Outcomes vary with the market, the period and the precise definition applied.
That finding does not retire the shape. It relocates it, from a trigger to a piece of evidence about location.
A Handover Between Two Groups
Read the three bars as a story about who controlled each session. Sellers owned the first, neither side owned the second, and buyers owned the third.
Such handovers happen constantly at every scale. Only the ones occurring where price already mattered tend to hold.
Why Location Decides the Weight
A morning star inside a range describes a wiggle. The same three bars at a level buyers defended twice describes something worth noting.
Our guide to support and resistance covers marking those levels in advance. Draw the lines before the candles arrive, never after.
Because the level exists independently of the pattern, it keeps you honest. You cannot invent a line to justify a shape you already like.
Confirmation Beyond the Third Bar
Plenty of traders wait one more session. A fourth bar holding above the third close adds weight without costing much distance.
Others require a break of the swing high that preceded the decline. That condition trades entry price for a clearer structural change.
What Volume Adds, and What It Does Not
Rising activity on the third bar supports the handover reading. Real exchange volume makes that argument cleanly.
Spot forex offers tick volume from one broker rather than true market volume. So treat any volume confirmation in currencies as a hint, never as proof.
Futures charts on the same currency behave better here. Traders who care about volume often check the futures contract alongside the spot chart.
Morning Doji Star and Other Variants
The family holds several close relatives. Learning the boundaries keeps your notes accurate when you review trades months later.
Morning Doji Star
Swap the small middle body for a doji and the name changes slightly. The middle session then finished exactly level, which many traders read as sharper indecision.
Our guide to doji candle meaning covers that bar in detail. The variants of the doji itself change the flavour of the group.
The Abandoned Baby
A rarer relative isolates the middle bar with gaps on both sides. Its entire range sits below the wicks of the bars either side.
Continuous forex delivers this version almost never. Treat any claimed sighting on a currency chart with real suspicion.
The Evening Star Mirror
Flip everything and you get the evening star after an advance. A large bullish bar, a small indecision bar, then a decisive bearish close into the first body.
Our comparison of the morning and evening star sets the two side by side. The geometry mirrors exactly, and the context requirement mirrors with it.
A Worked Morning Star at the Low of a Move
Picture a pair falling for several sessions into the low of the whole move. The decline reaches that point and stalls rather than accelerating.
One large bearish bar arrives first. A tiny-bodied bar follows, and the third session closes back above the midpoint of the first body.

Reading the Sequence
Three facts now sit together. Price reached the low of the move, selling failed to extend there, and the close came back above the first bar’s midpoint.
None of that promises an advance. It does describe a location where a long idea carries a clear invalidation point.
Entry, Stop and Target
The low of the middle bar usually serves as the invalidation level. A close beneath it means the handover failed.
Entry choices split into two camps. Some traders act on the third close, while others wait for a small pullback toward it.
Size from the distance to the stop rather than from habit. Our position size calculator converts that distance into a lot size in seconds.
Managing After the Entry
Once price leaves the group, the three bars stop guiding anything. Structure takes over from that point onward.
Trail behind swing lows rather than behind the pattern. A candle from four sessions ago cannot manage a live position.
Download the complete indicator database
Put these concepts on your charts. One email unlocks the full library of 1,380+ indicators with compiled MT4 and MT5 files, plus my TradingView scripts. No paywall, no spam, unsubscribe any time.
Get free access to my indicator database
One email unlocks 1,380+ free MT4, MT5 and TradingView indicators — the complete library. No single-tool download; you get the whole database.
Common Morning Star Mistakes and Fixes
Most errors trace back to a single confusion: the textbook version against the version a currency chart actually prints. The comparison panel below sets the two side by side.

Demanding a Gap on a Currency Chart
Traders who insist on the classic gap find almost nothing in forex. Drop that requirement and replace it with a strict rule about the middle body.
Accepting a Weak Third Bar
A third close that barely enters the first body proves very little. Set a measured threshold and reject anything short of it.
Skipping the Prior Decline
Without a decline before it, the group loses its meaning entirely. Check the previous ten bars before you reach for the label.
Trading It in Open Space
A perfect shape in the middle of nowhere still lacks a reason to hold. Require a level, a session extreme or a clear trend context first.
Reading Three Bars on a One-Minute Chart
Three minutes of trade rarely reflects a genuine handover. Move up the timeframes until the group represents real participation.
Forgetting the Calendar
A scheduled release can overwrite any three-bar story instantly. Check the economic calendar before acting on a group that formed just ahead of one.
Morning Star Quick Reference
Keep these seven questions beside your charts. Each one takes seconds and prevents an expensive assumption.
- Did a genuine decline precede the three bars?
- How large is the first body against the last ten bars?
- How small is the middle body, and how narrow is its range?
- How deep into the first body did the third bar close?
- Which level, if any, does the group sit on?
- Where exactly does the invalidation price sit?
- What does the calendar hold for the next session?
Record the answers in writing rather than in your head. Our trade journal keeps them attached to the trade for later review.
When a Morning Star Fails
Every shape fails regularly, and this one fails in recognisable ways. The chart below shows a clean group that gives way within two sessions.

The Third Bar Marks the High
Sometimes the strong bullish close turns out to be the last buying of the move. Price stalls immediately and rolls back through the middle bar’s low.
That outcome usually appears in a strong downtrend. Trends absorb three-bar interruptions without much difficulty.
The Sweep Beneath the Middle Bar
Stops gather under the middle bar’s low, and clusters attract price. A brief dip through them can remove you seconds before the move you expected.
Place the stop a sensible distance beyond the obvious point. Paying a few extra pips often buys a far better outcome.
News Overwrites the Story
A rate decision or an inflation print can reverse three sessions of behaviour in one minute. Nothing in the geometry survives that.
The Pattern Appears Mid-Range
Ranges produce these groups constantly at both edges and in the middle. Only the edges carry any structural meaning.
A Slow Grind Sideways
Failure does not always look dramatic. Price sometimes drifts sideways for a fortnight after a textbook group, taking your stop nowhere and your patience everywhere.
Time stops handle that outcome well. Decide in advance how many bars the idea gets before you close it and move on.
The Second Test That Breaks Lower
A group can hold once, then fail on the retest a week later. Support rarely gives way on the first attempt.
So treat each test as a separate decision. Reusing the original invalidation price after a bounce leaves your stop far too far away.
Turning the Shape Into a Written Rule
A pattern you can measure behaves consistently. A pattern you eyeball behaves however your mood dictates that morning.
So convert the anatomy into four numbers and store them in your plan. Each number removes one judgement call under pressure.
The Four Numbers
First, the minimum size of the first body against a recent average. Second, the maximum size of the middle body.
Third, the minimum penetration of the third close into the first body. Fourth, the minimum timeframe you will act on at all.
Reviewing Them Monthly
Pull every trade taken on this shape and sort by location. Levels and open space usually separate cleanly once you look.
Change one number at a time afterwards. Adjusting all four at once teaches you nothing about which one mattered.
Logging the Ones You Skipped
Record the groups you passed on as well as the ones you traded. Skipped setups carry the same information and cost nothing to collect.
After twenty entries a pattern usually appears. Many traders discover that their rejected setups performed no worse, which points straight at the filter rather than the shape.
So keep the log dull and complete. A spreadsheet with location, threshold and outcome beats any amount of remembered impression.
Related Concepts to Study Next
Three-bar groups make more sense once you understand the two-bar and one-bar versions. Two short reads cover most of the ground.
Start with our guide to engulfing candle meaning, which compresses a similar handover into two bars. The comparison sharpens both ideas quickly.
Then read our honest assessment of whether candlestick patterns work. It sets sensible expectations before you build rules around any shape.
A single-bar version rounds out the picture as well. The hammer candlestick meaning guide covers rejection compressed into one session rather than three.
For tooling, browse the candlestick indicators archive and the reversal indicators archive. Automatic marking frees your attention for the location question.
FAQ
What does the morning star pattern mean?
It describes three sessions in which sellers dominated, then stalled, and buyers produced a strong close deep inside the first bar’s body. The group reports a handover of pressure. It carries no forecast about the sessions that follow.
Does a morning star need a gap in forex?
No, and insisting on one leaves you with almost no examples. Spot currencies trade continuously, so gaps appear mainly at the Sunday open. Traders replace the gap requirement with a strict rule about the middle bar’s body and range.
How deep must the third candle close?
Conventions differ. A common threshold asks for a close above the midpoint of the first body, while stricter versions want a close above the first candle’s open. Pick one, write it down, and measure it identically every time.
Can the middle candle be a doji?
Yes, and that version carries its own name: the morning doji star. A doji middle bar shows the two sides finishing exactly level, which many traders read as sharper indecision than a small coloured body.
What is the opposite of a morning star?
The evening star, which appears after an advance. It runs a large bullish bar, a small indecision bar, then a decisive bearish close back inside the first body. The geometry mirrors exactly, and so does the need for context.
Should I trade a morning star on its own?
Most experienced traders do not. They require a level or a clear trend context first, then use the group to time an entry and locate an invalidation price. Results are not guaranteed; past performance is not indicative of future results.
External references
- For background on this concept, see Morning Star at BabyPips Forexpedia.
- For broader market context, see Star Candlestick Patterns at Investopedia.

About the author
Written by Dominic Walsh, a Forex trader and MT4/MT5 indicator, Expert Advisor and script developer. Every tool on forexmt4systems.com is tested on live charts before release and ships with ready-to-use compiled MT4 (.ex4) and MT5 (.ex5) files. Learn more about the trader and developer behind this site.
How we build, test and correct every tool: Editorial & Testing Policy. Trading carries risk; see the disclaimer.