
Ask do candlestick patterns work and two loud camps answer at once. One treats every hammer as a signal, and the other calls the whole thing folklore.
The honest answer sits between them. It rests on real testing rather than opinion, because these shapes have been run through decades of price data in several markets.
So this guide covers what that testing found, why the answers clash, what costs do to a thin edge, and where candles still earn a place. No anatomy lesson follows, since other guides handle the shapes themselves.
Do Candlestick Patterns Work on Their Own
Used alone, as a trigger to enter, the published work gives them little support. Several careful tests found no steady gain once real costs came off.
That result should not shock anyone who has traded them. A shape tells you what one closed bar looked like, and one bar says little about the next.
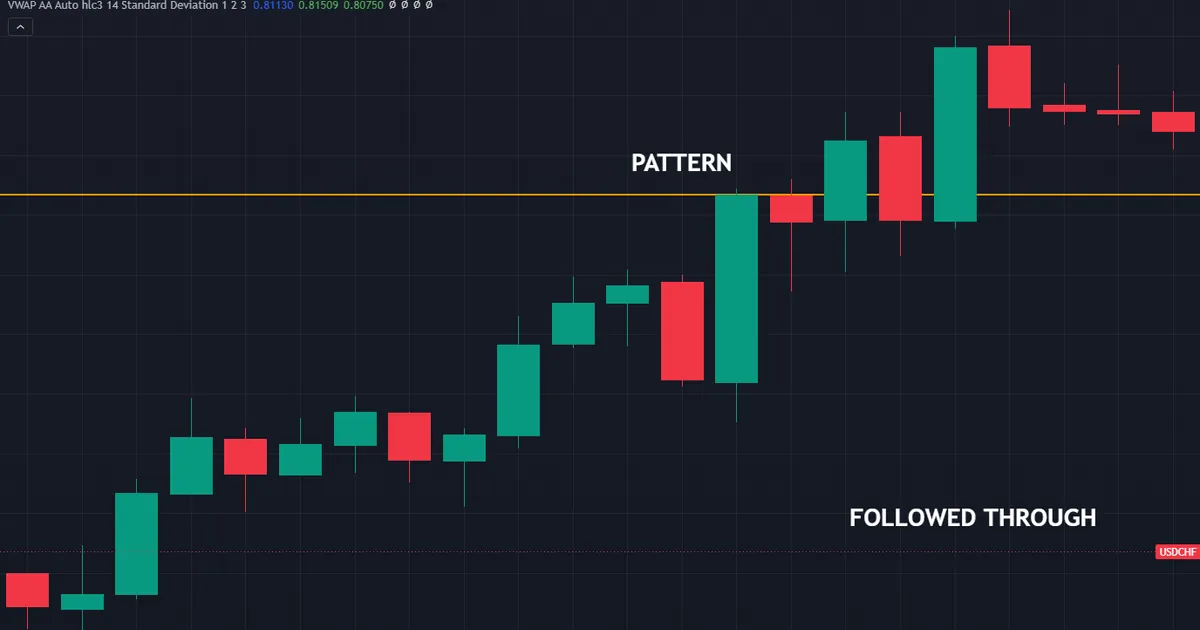
Yet the picture holds more shade than a flat no. Answers differ by market, by decade, and above all by the exact rule each tester used.
The Short Answer
Candle shapes forecast weakly. They describe well, and the gap between those two words shapes how you ought to use them.
So drop the question of what the bar predicts. Ask what it describes, where it printed, and whether that spot already mattered to you an hour before.
Our guide to candlestick patterns explained covers the shapes and the families. Read it first if the names still slow you down.
What the Studies Found
Work on candles goes back about three decades. The studies differ in market, method and period, which explains much of the noise around this topic.
Read a few and one theme repeats. Small effects tend to shrink or vanish once someone adds the cost of trading.
The Study That Set the Tone
Marshall, Young and Rose ran the best known test, published in the Journal of Banking and Finance in 2006. They asked whether candlestick trading rules create value for investors, using the Dow stocks over about a decade.
Their method held the key. They compared real signals against random price paths, so a rule had to beat chance rather than simply produce some winners.
Their answer went against the patterns. The rules showed no value on those stocks, which the authors read as a sign of an efficient market.
Results That Point the Other Way
Other teams found other things. Work on Taiwanese and Chinese shares has reported short-term gains for some patterns, in a few cases even after a cost allowance.
How a market works may explain part of that split. Tick sizes, daily limits, retail share of volume and trading hours all differ from the Dow.
Forex work leans the other way. Tests of candle signals on major pairs such as EURUSD have mostly found no real gain once costs came off.
Why Both Can Be True
Nothing forces these answers to agree. A shape that mattered in one market in one decade need not matter in another market ten years later.
Rules differ too, and that point matters more than most readers expect. One paper asks for a lower wick twice the body, the next asks for three times, and the two flag mostly different bars.
So treat any single headline with care. The fair summary runs like this: the case for a steady edge on its own looks weak, and results move with market, period and rule.
What a Fair Test Has to Rule Out
Two traps catch weak studies. The first is luck, and the second is the drift of the market itself.
Luck gets handled by a random benchmark. If your shape beats coin flips over thousands of cases, you have something worth a second look.
Market drift is subtler. Shares tend to rise over long spans, so any rule that buys often will show a profit that owes nothing to the shape at all.
The Sample Size Problem
Strict rules yield few cases. A tight hammer rule on daily bars might turn up a couple of dozen cases per pair across ten years.
Two dozen cases prove almost nothing. Random runs of that length swing wildly, so a good average there may be noise wearing a suit.
Loosen the rule and the sample grows, yet the shapes get weaker. That trade-off sits at the heart of why this whole debate stays unsettled.
How a Pattern Gets Tested
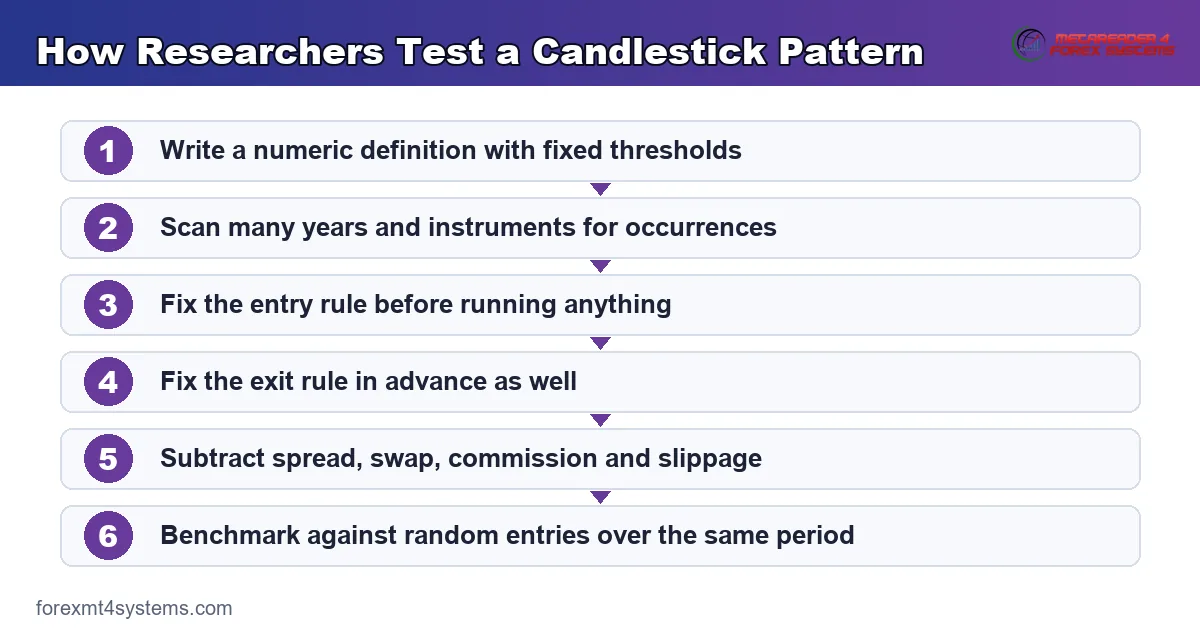
Knowing the method helps you read the answers. Every serious test runs through six stages, and each stage hides a choice.
- Write the rule in numbers. Fix the wick-to-body ratio, the body size and the prior trend as figures, not adjectives.
- Scan the history. Run that rule across many years and many pairs to gather every case.
- Fix the entry. Usually the next open, since the shape only completes at the close.
- Fix the exit. A time exit, a target, a stop, or some mix, all chosen before the test rather than after.
- Take off the costs. Spread, fees, swap and a slippage allowance come off every round trip.
- Set a fair yardstick. Random entries, buy and hold, or shuffled prices all work as a benchmark.
Change any one of those six and the answer can flip. That is why two able testers reach opposite views on the same shape.
The Rule Problem
No official rulebook exists. Steve Nison made the names popular, yet the exact numbers differ between books, platforms and scanners.
So a test of hammers really tests one author’s hammer. Tighten the ratio and you get few clean cases, while a loose ratio floods the sample with plain bars.
Write your own numbers down before you test. Then at least you know what you measured.
The Exit Problem
Patterns name an entry and say nothing about the exit. Every test therefore bolts on an exit the shape never asked for.
That choice drives the result. A ten-bar time exit, a two-to-one target and a trailing stop give three answers from the same entries.
So read the exit rule before the verdict. Half the fights about candle results come down to two people testing different exits.
What Costs Do to a Thin Edge
Costs settle more of this debate than maths does. Short-horizon rules trade often, and each trade pays the same tolls twice.
A small raw edge can vanish at the broker. That one point explains most of the gap between a bright backtest and a dull account.
Spread on Every Round Trip
You cross the spread when you enter and again when you leave. On a major pair that costs a fraction of a pip, and on a thin cross it costs far more.
Multiply by a hundred trades and the sums bite. A rule that nets a few pips per trade hands most of that back to the spread.
Swap, Slippage and Fees
Hold a trade overnight and swap applies. Trade near news and your fill lands worse than the price on screen.
Raw-spread accounts add a fee per lot on top. None of these show up in a plain backtest, which is why plain backtests look so cheerful.
Our free expectancy calculator shows how fast costs eat a thin average. Feed in your own figures and the picture gets clear quickly.
Why Fast Timeframes Suffer Most
Costs stay roughly fixed per trade while the target shrinks with the timeframe. A one-pip toll barely dents a daily-chart swing, yet it can swallow a five-minute scalp whole.
So the same shape can pass on one chart and fail on another. Nothing about the pattern changed, and only the size of the move it aims at did.
Traders often learn this the hard way. A rule that looked fine on daily bars gets moved down to five minutes for more action, and the tolls quietly take the lot.
A Worked Test of One Shape
Say you call a bar a hammer when the lower wick runs at least twice the body. Add an upper wick under a quarter of the body, and five falling closes before it.
Now fix the rest. Enter at the next open, stop below the hammer low, leave after ten bars or at a level, and take off one pip of cost per round trip.
Run that across several pairs and ten years of daily bars. You end up with an average per trade, a spread of outcomes, and a count of cases.
What the Result Must Beat
Only one check matters. Does that average beat the same rules fired at random dates, once costs come off both sides.
Most traders skip that check. They scan a list of winners, feel good, and never run the one test that would teach them something.
Our note on candlestick patterns at support and resistance shows what a location filter changes. The sample shrinks hard, and what remains looks quite different.
What the Output Usually Shows
Run a test like that and one shape of result keeps turning up. The raw average sits a shade above zero, and the cost line drags it back to roughly nothing.
Add a level filter and the average often improves. Yet the case count drops so far that you can no longer tell skill from luck.
Neither outcome kills the idea. Both simply push you towards the same place: use the shape to sharpen a decision you already had a reason to make.
Download the complete indicator database
Put these concepts on your charts. One email unlocks the full library of 1,380+ indicators with compiled MT4 and MT5 files, plus my TradingView scripts. No paywall, no spam, unsubscribe any time.
Get free access to my indicator database
One email unlocks 1,380+ free MT4, MT5 and TradingView indicators — the complete library. No single-tool download; you get the whole database.
Where Candles Still Earn a Place
Weak trigger evidence does not make candles junk. It makes them the wrong tool for one job and a fair tool for two others.
Three roles hold up well. None of them treats a shape as a reason to trade.
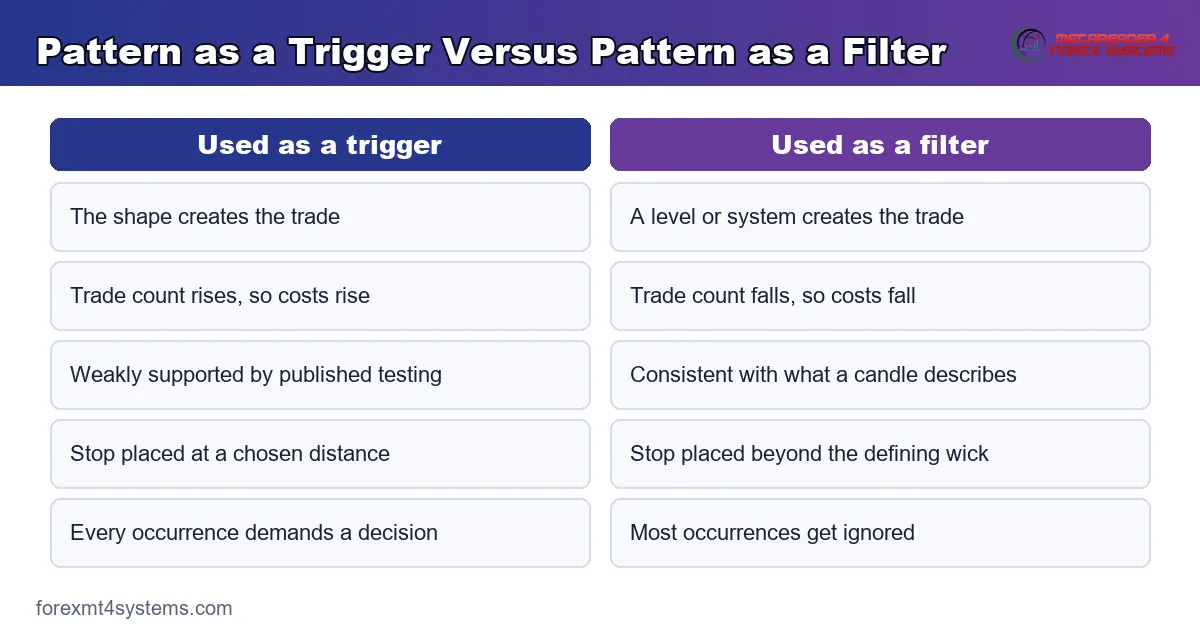
As a Filter, Not a Trigger
Start with a reason that has nothing to do with candles. A level, a trend, a session habit or a tested system gives you that reason.
Then let the candle veto the trade. A long wick against your plan argues for waiting, and a close in your favour argues for acting now.
Used this way, the shape removes trades rather than creating them. Fewer trades means fewer tolls, which quietly fixes part of the cost problem.
As a Way to Place a Stop
Candles give you exact prices. The wick that made the rejection marks a natural line, so your stop has a clear reason behind it.
A tight stop lifts your reward for the same risk. That gain comes from the shape of the bar, not from a forecast, so it does not rely on the pattern being right about direction.
Our free trade journal makes this easy to see. Log stop distance beside outcome and the benefit shows up in your own records.
As a Note on Who Showed Up
A candle at a level tells you someone defended it. That fact counts even when you skip the trade, since it marks the area as live for later.
So read candles as notes about levels, not orders about direction. The level does the guessing, badly, and the candle just records who turned up.
As a Cue to Do Nothing
The best use of a shape often ends in no trade. A long wick against your plan tells you the other side still has weight there.
Skipping that trade costs you nothing and saves you a toll. Over a year those skipped trades add up to a real slice of your costs.
So count vetoes as work done. Traders rarely log the trades they avoided, which hides one of the few clear gains candles offer.
Common Mistakes in This Debate
Six habits twist almost every talk about this question. The panel below sets out the two ways traders really use a shape.
Judging From a Few Screenshots
Any shape looks great in a picked gallery. Gather every case across a year instead, dull ones included, before you form a view.
Leaving Out the Cost Line
A backtest with no spread, swap or slippage flatters every fast rule. Add real costs first, then decide whether the result still holds your interest.
Reading Charts Backwards
Scroll back and every big turn shows a shape near it. The same shapes sit where nothing happened, so walk your charts forwards instead of hunting back from big moves.
Changing the Rule Mid-Test
Tweaking the wick ratio until the output improves fits the rule to the past. Fix the numbers first, then let the data answer, however dull that answer turns out.
Mixing Up Story and Forecast
A shape does describe what happened inside a session. Treating that story as a forecast asks it to do a job the evidence says it cannot do.
Wanting One Answer for Every Market
Results differ across shares, futures and spot forex, and across periods inside each. So test on what you trade, not on what the paper traded.
Trusting a Scanner’s Built-In Rule
Every scanner ships with one fixed set of numbers, and few tools tell you what those numbers are. Check them before you trust the flags, since your idea of a hammer may not match the code.
Quoting a Success Figure You Cannot Trace
Neat percentages travel fast and check out rarely. Ask what rule, what exit, what market and what costs produced the figure, and most of them fall apart on the first question.
An Even-Handed Verdict
Set the two sides side by side and the picture reads clearly. This table sums up where the case lands on each claim.
| Claim | What the evidence supports |
|---|---|
| Patterns forecast the next move | Weak at best; several studies found no steady edge on its own |
| Patterns survive trading costs | Often not; costs eat small edges on short horizons |
| Results are the same everywhere | No; answers move with market, period and rule |
| Patterns describe what a session did | Yes, directly, and nobody disputes it |
| Patterns help place stops and entries | Yes, through the shape of the bar rather than a forecast |
| Patterns read better at marked levels | Widely held among traders, and it fits the descriptive reading |
So the verdict splits by job. As a trigger the case looks thin, and as a filter and a stop guide it holds up well.
What This Means for Your Chart
Keep the candles. Drop the habit of trading them cold, and give the level work the weight it deserves.
Then measure your own results. Your costs, your pairs and your rules differ from any study, so your log beats any paper for your purposes.
Give that log a fair span too. Fifty trades tell you little, while three hundred start to show whether your filter earns its keep.
Why the Debate Never Ends
Both camps hold a piece of the truth, which is why neither side ever wins. The sceptics point at the tests, and the fans point at the levels the tests ignored.
Neither camp usually writes its rule in numbers. Without that, the two sides argue about different shapes while using the same words.
So write yours down and step out of the argument. A rule you can measure beats a view you can only defend.
When a Shape Goes Nowhere
Failure forms part of the normal picture, not an odd exception. Knowing what a failure looks like keeps the sting small.
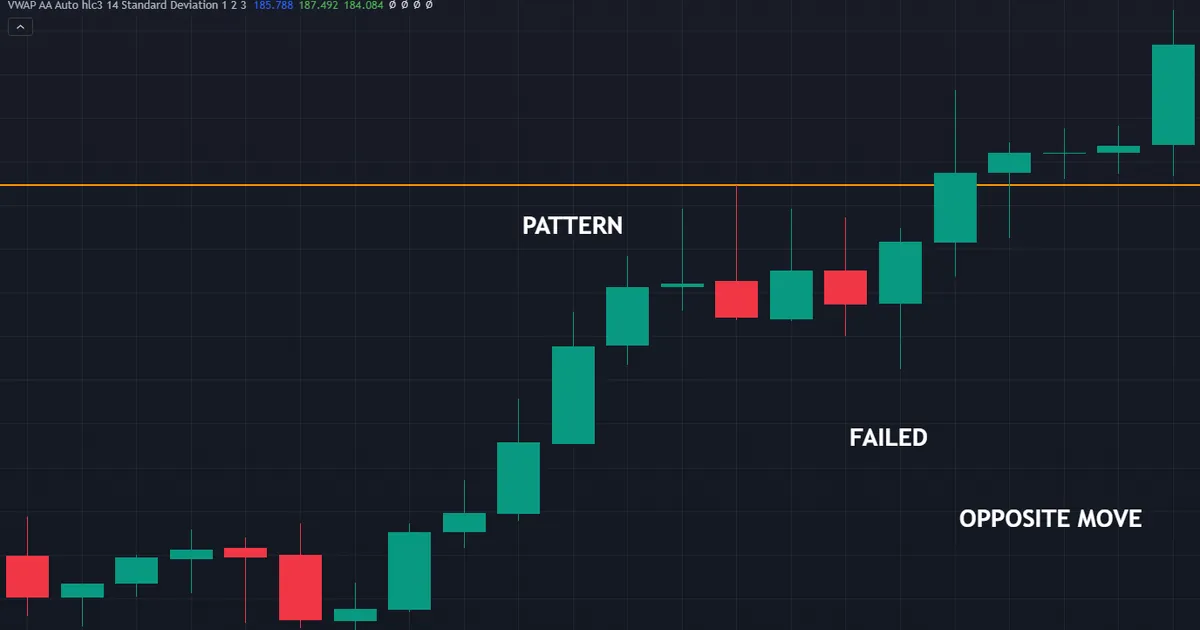
Watch for the same run of events each time. Price prints the shape, never moves the expected way, then closes straight back through the wick that made it.
Failure in Open Space
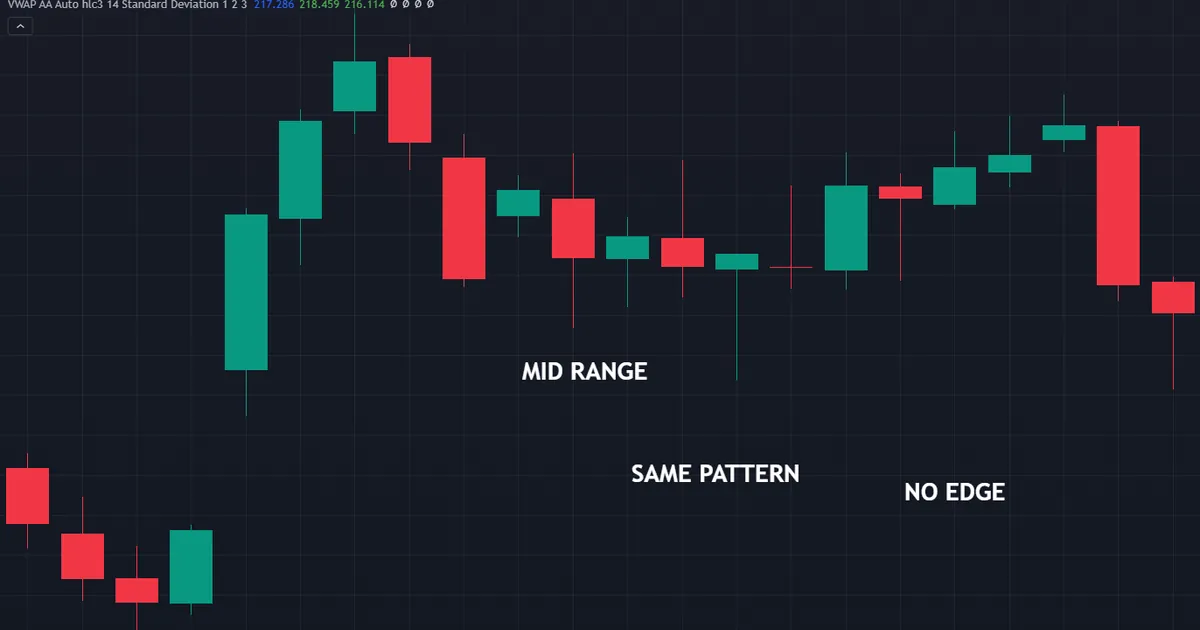
A shape in the middle of a range describes noise. Nobody stood at that price, so the wick shows plain two-way trade rather than a stand.
Failure Against a Big Trend
Shapes that fight a strong move fail more often, as most traders will tell you from their own logs. Check the higher timeframe before you fade a run on one bar.
Failure in Thin Hours
Rollover, holidays and quiet gaps between sessions throw up odd bars. Wide spreads draw drama that never traded, so a wild bar at a strange hour deserves doubt.
How to Leave a Failed Trade
Plan the exit before you enter, and leave when price closes back through the defining wick. Then log the case, because a folder of failures teaches you more about your filters than a folder of winners.
Related Reading
Two nearby guides take this further. Each covers ground an evidence review cannot.
Read our note on the hanging man candlestick to see how place decides what one shape means. Then work through how to combine indicators, which covers the filter role in a wider setting.
If you want shapes flagged for review rather than for trading, browse our candlestick indicators and pattern recognition indicators. Treat them as a scanner that saves you time, and keep each call in your own hands.
FAQ
Do candlestick patterns work in forex
Tests on major pairs have mostly found no clear edge on their own once costs come off. Spot forex also trades round the clock, which removes the gaps that several classic shapes assume. Candles still help with timing and stop placement inside a plan that already sets levels and risk.
Why do some studies find candlestick patterns profitable
Market type, period and the exact rule all differ between studies. Work on Taiwanese and Chinese shares has reported short-term effects that work on US shares did not. A different wick-to-body number alone can change which bars enter the sample.
Which candlestick pattern performs best
No shape holds a fair claim to that title, and any source quoting a neat figure has usually skipped the cost line. Results depend on the rule, the exit, the market and the years tested. Judge a shape by what it describes and where it prints instead.
Should I stop using candlestick charts
No, because the chart type itself costs you nothing. Candles show open, high, low and close far better than a line, which helps with entries, stops and reading a session. The caution applies to trading shapes cold, not to the chart.
Are candlestick patterns better than chart patterns
They answer different questions, so the comparison misleads. Chart patterns such as a double top span many bars and carry a rough measured move, while candles cover one to three bars and carry no target at all. Both face the same cost problem once you trade them often.
How do I test a shape on my own data
Write the rule in numbers, scan your history, fix entry and exit up front, take off real costs, then compare against random entries over the same span. Keep the rule fixed all the way through. Changing it after you see the output just fits the past.
Can candlestick patterns improve my results at all
They can help, mainly by cutting trades and by giving stops a clear line to sit behind. Both gains come from what the bar shows rather than from a forecast. Any gain still rests on your own process, your costs and your discipline. Results are not guaranteed; past performance is not indicative of future results.
External references
- For background on this concept, see Random Walk Hypothesis on Wikipedia.
- For broader market context, see Candlestick Patterns at Corporate Finance Institute.

About the author
Written by Dominic Walsh, a Forex trader and MT4/MT5 indicator, Expert Advisor and script developer. Every tool on forexmt4systems.com is tested on live charts before release and ships with ready-to-use compiled MT4 (.ex4) and MT5 (.ex5) files. Learn more about the trader and developer behind this site.
How we build, test and correct every tool: Editorial & Testing Policy. Trading carries risk; see the disclaimer.