
Flip a hammer upside down and you get a bar with a long tail above the body. The inverted hammer vs shooting star question then works exactly like its right-way-up cousin, because both names describe that one shape.
A small body sits at the bottom of the range, a long wick runs above it, and almost nothing hangs below. So the swing that ran into the candle picks the name, and this guide shows you how to read that swing.
Inverted Hammer vs Shooting Star: the Distinction in One Line
An inverted hammer appears after a decline. A shooting star appears after an advance, and no other feature separates them.
Print both bars on paper and they overlay perfectly. Only the chart to the left tells you which label belongs on which candle.
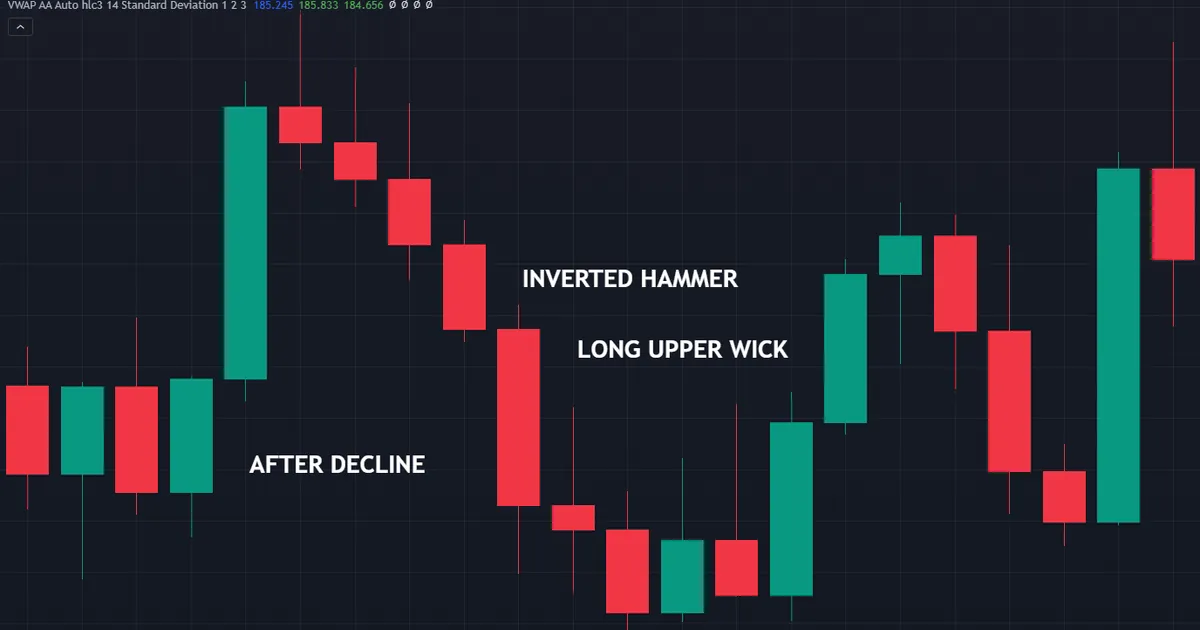
That single rule saves a lot of confusion. Learn it once, then apply it to the upright pair as well, since our comparison of hammer vs hanging man follows the identical logic.
The Shape Both Bars Share
Picture a session that opens, rallies hard, then hands almost all of it back. The close lands near the open, close to the low of the day.
That path draws a small body at the bottom with a long spike above. Traders call the spike the upper wick, the upper shadow, or the tail, and all three words mean the same thing.
Nothing about the shape says what happens next. It simply records a rally that sellers wiped out inside one session.
What the Prior Trend Decides
After a decline, that failed rally still counts as a sign of life. Buyers pushed price a long way up, which had not happened for a while.
After an advance, the same failed rally reads as exhaustion. Buyers reached for more, found nothing, and gave the ground straight back.
So the wick means one thing at the bottom of a move and another at the top. Context flips the reading without touching a single pixel of the candle.
The Mirrored Anatomy, Check by Check
Run five checks before you name anything. Four of them cover geometry, and the fifth covers the chart around it.
- Small body near the low. The open and the close sit close together, inside roughly the bottom third of the session range.
- Long upper wick. The tail above the body runs about two or more times the height of that body.
- Little or no lower wick. Price closes near the low, so almost nothing extends below the body.
- Either colour qualifies. A filled body suits a shooting star and a hollow one suits an inverted hammer, yet the classic definitions accept both.
- Trend before the bar. A decline into the candle names it an inverted hammer, while an advance names it a shooting star.

Keep the order fixed. Because check five carries the meaning, running it first tends to bias the four measurements that follow.
Measuring the Upper Wick
Divide the wick height by the body height. Two or more meets the usual convention, and many traders prefer three for a cleaner filter.
An alternative rule looks at the whole range instead. Ask that the upper tail cover at least two thirds of the high-to-low distance, which produces a very similar screen.
Our guide to candlestick wicks meaning goes deeper on ratios and what a long tail actually records. Read it if the measurement side interests you.
How Small the Lower Wick Must Stay
Textbooks ask for none at all. Real charts rarely oblige, so most traders accept a small stub below the body.
Use the body height as your yardstick. Once the lower wick approaches the body size, the bar starts drifting toward a spinning top instead.
Both tails long and the body tiny gives you a long-legged doji. Our note on doji candle meaning covers that family and what indecision really implies.
Why an Inverted Hammer Reads Bullish at All
This part trips up almost everyone. A bar that gave back its entire rally hardly looks encouraging.
The Counter-Intuitive Part
Sellers won the session. Price closed near the low, and the buyers who chased the spike ended the day underwater.
Yet something changed. After a long decline, a hard push upward shows demand appearing where none had shown up for days.
So the bar records an attempt rather than an achievement. That distinction explains why traders treat it as a hint and not as an answer.
What the Bar Actually Records
Two facts sit inside the candle. Buyers found enough size to lift price sharply, and sellers found enough size to push it back down.
Neither side finished the argument. The bar simply proves that both sides turned up, which beats the one-sided selling that came before it.
Read it as a change of character, not as a turn. Character changes usually arrive before turns, though plenty of them lead nowhere at all.
Why Confirmation Carries Extra Weight Here
Because the close sits at the low, the bar ends on the sellers’ side. So an inverted hammer needs the next session to agree more than most patterns do.
Confirmation here means a close above the candle’s high. Until that arrives, the chart still shows a failed rally inside a downtrend.
Traders who skip the wait accept a much weaker read. Patience costs a little entry price and removes a great deal of noise.
What the Evidence Actually Supports
Academic tests of single candlestick shapes have generally found little consistent edge once trading costs enter the sum. Results also shift with the market, the period and the exact definition applied.
None of that makes the bar useless. It does mean the candle works as a filter and a location tool rather than as a trigger on its own.
So use it to decide where to look and where a stop belongs. Let the level, the trend and your risk rules decide whether a trade happens at all.
Why a Shooting Star Reads Bearish
The bearish version needs less explaining. Its story matches what the eye already sees.
Buyers Ran Out of Room
Price had been climbing for days. Then one session reached higher still, met sellers, and closed back near where it started.
That rejection lands exactly where buyers had grown confident. So the tail marks the first place the rally met real supply.
Location Does the Heavy Lifting
A shooting star in clear air says little. The same bar under an old high, a round number or a weekly level says considerably more.
Our dedicated article on the shooting star candlestick pattern works through the geometry, the stop placement and the failure case in detail. Use it as the deep dive behind this comparison.
The Range Tells You How Much Got Rejected
Compare the wick length against recent bars. A tail twice the size of the average range shows a far bigger rejection than one that barely matches it.
Average true range hands you that yardstick in a single number. So a shooting star whose wick spans a whole daily range carries more information than a modest one.
Note the session as well. A spike printed during London or New York hours involved many more participants than one printed overnight.
Telling the Two Apart on a Live Chart
Naming errors nearly always come from a fuzzy trend read. Three tests fix that quickly.

The Trend Test
Count how many of the last ten bars closed in the same direction. Seven or more gives you a clear run, and anything near five gives you a range.
Swing structure works just as well. Higher highs with higher lows point to an advance, and the mirror pattern points to a decline.
The Level Test
Ask what sits immediately above the wick. An old high, a session extreme or a round number turns the tail into a rejection of something specific.
Draw those levels before the candle prints. Our guide to trend lines covers a simple way to keep the important ones on the chart.
The Timeframe Test
A four-hour rally often sits inside a daily decline. So the same bar can qualify as a shooting star on one chart and an inverted hammer on another.
Pick the timeframe you actually trade and name the bar there. Trying to satisfy both views at once produces paralysis rather than clarity.
Download the complete indicator database
Put these concepts on your charts. One email unlocks the full library of 1,380+ indicators with compiled MT4 and MT5 files, plus my TradingView scripts. No paywall, no spam, unsubscribe any time.
Get free access to my indicator database
One email unlocks 1,380+ free MT4, MT5 and TradingView indicators — the complete library. No single-tool download; you get the whole database.
A Worked Example on a Major Pair
Take a pair that has fallen for two weeks into a weekly support shelf. One session opens, spikes forty pips higher, then closes two pips above its open.
The prior move fell, so the bar earns the inverted hammer name. The shelf underneath gives the attempt somewhere sensible to start from.
Where the Stop Would Sit
Traders who wait for confirmation buy only after a close above the candle’s high. A stop then sits below the candle’s low, plus a small buffer for spread.
Notice how wide that distance can grow. Long wicks stretch stops, so lot size has to fall to hold the cash risk steady.
Our free ATR position size calculator handles that arithmetic for you. Feed it the stop distance and it returns a size that keeps your risk constant.
What the Shooting Star Version Looks Like
Now run the mirror. A pair rallies for two weeks into an old high, spikes through it, then closes back near the session low.
The prior move climbed, so the bar becomes a shooting star. Confirmation flips too, since sellers now need a close below the candle’s low.
Stops move to the other side as well. A short taken after that close sits with its stop above the wick, above the spike that took out the old high.
Managing the Trade After Entry
A confirmed entry still needs a plan for the middle. Many traders bank part of the position near the next obvious level and leave the rest running.
Move the stop only when structure allows it. Dragging it along bar by bar usually ejects you during ordinary noise, long before the idea has actually failed.
Lookalikes That Cause Trouble
Three other shapes crowd this space. Knowing where each one ends keeps your naming honest.
The Gravestone Doji
Shrink the body until the open and close sit at essentially the same price. The bar becomes a gravestone doji rather than a shooting star.
Traders read both similarly, since the story matches. The doji version simply removes any hint of direction from the body itself.
The Pin Bar
Price-action traders use one word for every long-tailed rejection candle. A pin bar with the tail on top covers the shooting star and the inverted hammer together.
No conflict exists between the two vocabularies. The candlestick names split the shape by prior trend, while the pin bar name groups them by behaviour.
The Upright Pair
Rotate the shape and you land on the hammer and the hanging man. Same trend logic, opposite wick, and exactly the same need for confirmation.
Traders who want the shapes flagged for them can browse our pattern recognition indicators archive. Treat any such tool as a spotter and keep the trend read yourself.
Common Mistakes and Their Fixes
Six habits cause most of the trouble here. The keypoints panel below collects the checks that keep the two names straight.
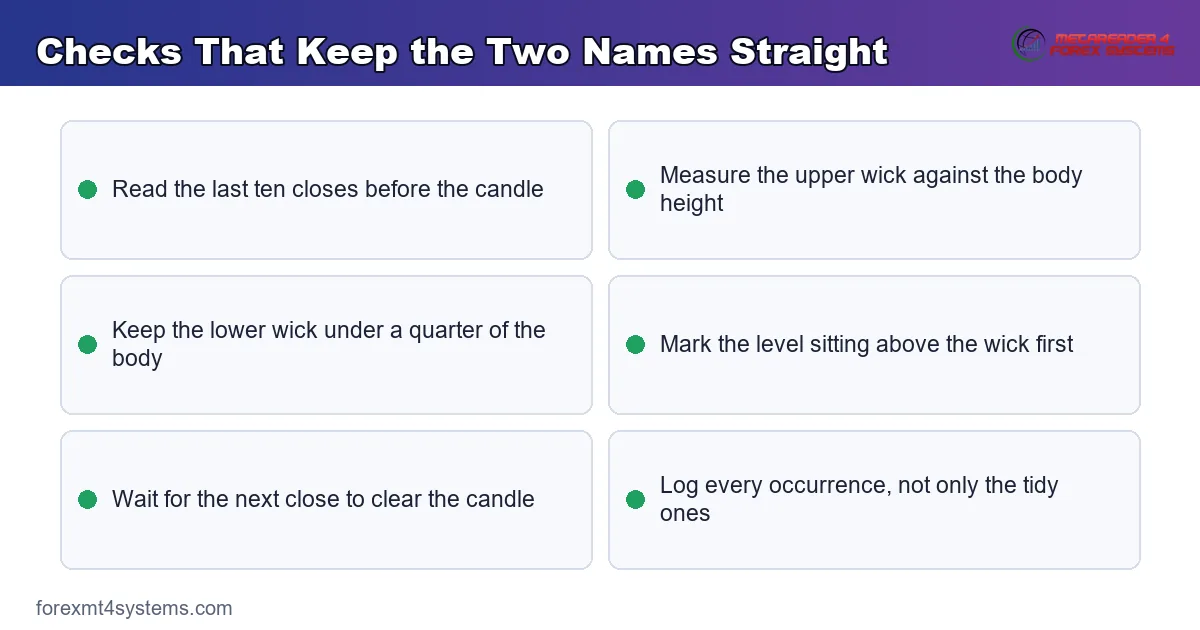
Reading the Candle Before the Chart
The long tail grabs attention, and the label follows the feeling. Instead, scroll left first and let the previous ten bars choose the name.
Shorting Every Long Upper Wick
A tail inside a strong uptrend often marks a pause rather than a top. So wait for the close below the low before you treat it as anything more.
Buying an Inverted Hammer Immediately
The bar closes on its low, which hands sellers the last word. Waiting for a close above its high turns a hopeful read into an evidenced one.
Ignoring What Sits Above the Wick
A rejection matters where somebody had a reason to sell. Mark the level first, then judge the candle against it rather than on its own.
Mixing Up the Two Vocabularies
Calling a bar a pin bar and then arguing about its candlestick name wastes time. Pick one naming system for your notes and stay with it.
Forgetting About Spread and Wick Extremes
Stops parked exactly on the wick extreme get clipped by ordinary spread widening. Add a small buffer, then size the position around the wider distance.
Writing the Shape as a Screening Rule
Eyes get tired and standards drift. A written rule keeps every bar measured the same way, whether you scan by hand or with a script.
Four Numbers Define the Candle
Body height over range, upper wick over body, lower wick over body, and the direction of the last ten closes. Those four numbers settle the name completely.
Common thresholds run like this: body under a third of the range, upper wick at least twice the body, lower wick under a quarter of the body. Adjust them to your market, then leave them alone.
Why a Screen Beats a Glance
A screen never talks itself into a marginal bar. It also finds candles on pairs you had not thought to open, which widens your sample quickly.
Review whatever the screen returns by hand. Automation supplies the list, while you still supply the trend read and the level.
Keep the Threshold Stable
Loosening a filter after a quiet week feels productive. Instead, log the bars your current rule found, then judge that rule on thirty entries rather than three.
Where These Bars Show Up Most Often
Long upper wicks cluster in a few predictable places. Knowing them saves you from treating every spike as meaningful.
At Prior Highs and Round Numbers
Stops and resting orders pile up just above old highs. Price reaches for them, fills whatever sits there, then drops back, which draws the tail.
Around Scheduled News
Data releases produce violent spikes in both directions. A shooting star built entirely on a news wick tells you about liquidity rather than about sellers.
At Session Boundaries
Books thin out between the New York close and the Tokyo open. Thin books exaggerate small orders, so tails printed there deserve a discount.
Inside Ranges
Sideways markets throw long tails at both edges every day. Without a clear run into the bar, neither name really applies to what you see.
Quick Reference Grid
This grid holds all four single-bar rejection names in one place. Read down the column that matches your prior trend.
| Feature | Inverted hammer | Shooting star |
|---|---|---|
| Prior move | A decline into the bar | An advance into the bar |
| Body position | Bottom third of the range | Bottom third of the range |
| Upper wick | Two or more times the body | Two or more times the body |
| Lower wick | Tiny or absent | Tiny or absent |
| What the tail records | Demand appearing after selling | Supply appearing after buying |
| Level that adds weight | Support, prior swing low | Resistance, prior swing high |
| Confirmation bar | Close above the candle high | Close below the candle low |
| Stop reference | Below the candle low | Above the candle high |
| Upright equivalent | Hammer | Hanging man |
Print the grid and keep it near the screen. After a few weeks the distinctions stop needing a reference at all.
When Neither Bar Follows Through
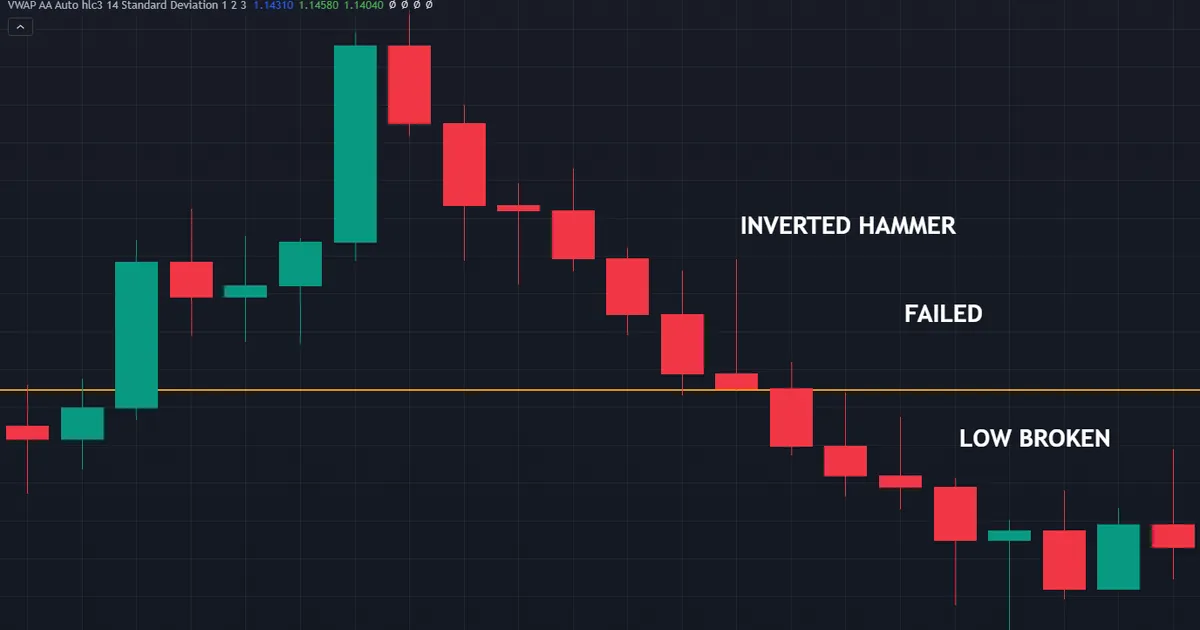
Both shapes fail regularly, and the failures teach more than the tidy examples. The chart below shows an inverted hammer whose low gave way the following week.
The Trend Rolls Straight Over It
A shooting star prints, then price gaps up on the next session and never looks back. Strong trends swallow single-bar warnings all the time.
The Rally Fades Without Confirming
An inverted hammer forms at support, then the following bar closes below the candle’s low. Because confirmation never arrived, no trade existed to lose.
The Wick Was Just Thin Liquidity
Spikes around the daily rollover or a news release come from thin books rather than from real supply. Such tails look identical and mean far less.
The Level Turned Out to Be Wrong
Sometimes the rejection lands at a level nobody else watched. So the tail rejected nothing in particular, and the market carried on unmoved.
The Sample Was Too Small
Two good outcomes in a row feel like proof. Keep a written log of every occurrence instead, and let thirty entries tell you what two never could.
Related Reading to Sharpen the Distinction
These two bars belong to a family of four single-candle rejections. Reading the neighbouring guides stops the names blurring together.
Start with our reversal indicators archive if you want the shapes marked automatically on a chart. Then work through the upright pair and the wick article linked above, since the same trend logic runs through all of them.
Above all, keep the honesty rule in view. A candle describes what happened during one session; the level and the trend decide whether anybody should care.
FAQ
What is the difference between an inverted hammer and a shooting star?
Only the prior trend. Both bars show a small body near the low of the range with a long upper wick and little or no lower wick. A decline into the candle makes it an inverted hammer, while an advance into it makes it a shooting star.
Why does an inverted hammer read as bullish when it closes low?
Because it records demand appearing where none had shown up for days. Buyers lifted price sharply during the session, even though sellers pushed it back. Traders treat that as a change of character rather than as a turn, which is why the next close matters so much.
How long should the upper wick be?
The common convention asks for a tail roughly two or more times the body height, with almost nothing below the body. Some traders instead require the upper wick to cover two thirds of the total range. Either filter works, provided you apply it consistently.
Is a shooting star the same as a gravestone doji?
They sit next to each other rather than on top of each other. A gravestone doji has essentially no body, since the open and close land at the same price. A shooting star keeps a small body near the low, so the doji version simply removes the last hint of direction.
Do I need confirmation on both bars?
Most traders use it on both, and the inverted hammer needs it most. That bar closes on its low, so the chart still favours sellers until a later close clears the candle’s high. Confirmation for a shooting star means a close below its low.
Do these candles behave differently in forex?
The geometry transfers to any market, since it only describes buying and selling inside one session. Spot forex runs around the clock, so daily bars depend on your broker’s server time and long wicks often appear during thin liquidity. Read both bars as context, confirm with what follows, and size every trade from the stop distance. Results are not guaranteed; past performance is not indicative of future results.
External references
- For background on this concept, see Inverted Hammer at BabyPips Forexpedia.
- For broader market context, see Gravestone Doji at Investopedia.

About the author
Written by Dominic Walsh, a Forex trader and MT4/MT5 indicator, Expert Advisor and script developer. Every tool on forexmt4systems.com is tested on live charts before release and ships with ready-to-use compiled MT4 (.ex4) and MT5 (.ex5) files. Learn more about the trader and developer behind this site.
How we build, test and correct every tool: Editorial & Testing Policy. Trading carries risk; see the disclaimer.