
The kicker candlestick pattern describes one of the sharpest turns a chart can print. One bar runs with the trend, the next bar opens beyond it in the other direction, and the market never looks back inside the gap.
Spot forex trades around the clock, though, so a true kicker candlestick pattern needs conditions this market rarely offers. This guide covers the exact geometry, the places where real kickers do appear, and the closest thing a continuous market can produce.
What the Kicker Candlestick Pattern Looks Like
Two bars build the shape. The first runs with the prevailing move, and the second opens at or beyond the first bar’s open, then travels the opposite way.
Both bars carry long bodies and very short wicks. That geometry says one side held the session from the first tick to the last.
The space between them does the real work. Because the second bar opens past where the first one started, a strip of price never trades at all.
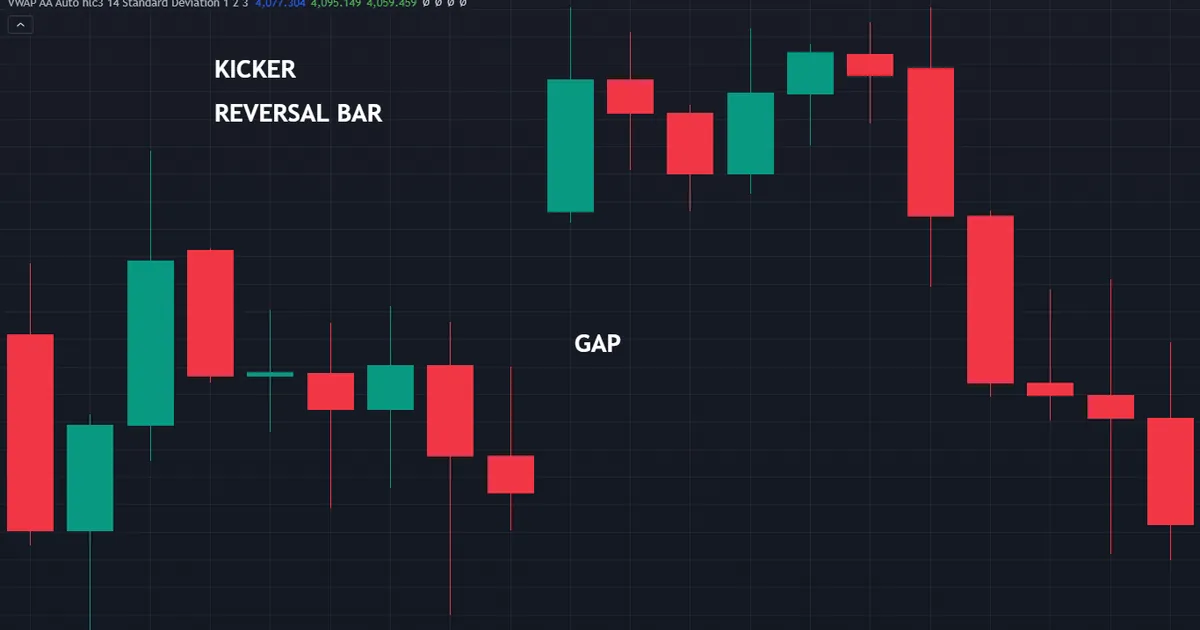
So the shape records a reset in sentiment rather than a gradual turn. Nothing about it forecasts the next session, and plenty of kickers hand the move straight back.
The Bullish Kicker
A bullish kicker starts with a bearish bar inside a decline. The next bar opens at or above that bearish bar’s open, then closes far higher with almost no lower wick.
Sellers controlled one session and lost the next before it began. That abruptness gives the shape its name.
The Bearish Kicker
A bearish kicker mirrors it exactly. A bullish bar runs with an advance, then the following bar opens at or below that bullish bar’s open and closes far lower.
Again the wicks stay short. A long wick on either bar tells you the other side fought back, which weakens the reading.
Why the Gap Carries the Message
Strip the gap away and you hold two ordinary bars. Traders who entered near the first bar’s close never get a chance to exit at their entry price.
Classic texts treat an unfilled gap as the core of the pattern. Once price trades back through that void, the story loses most of its force.
So watch the void, not the colour. Our guide to candlestick patterns explained covers how the other families handle gaps and bodies.
Where the Name Came From
Candlestick charting reached Western traders through Steve Nison in the early 1990s. Older Japanese texts group this shape with the kicking patterns, and the English name simply kept that idea.
Strict versions demand two marubozu bars with no wicks at all. Looser versions allow short wicks, provided neither bar trades back into the gap.
Pick one version and stay with it. Because scanners apply different tolerances, two platforms can flag entirely different bars as kickers on the same chart.
How to Identify a Kicker, Step by Step
Run the same five checks every time. They take seconds once the second bar closes.
- Check the trend behind bar one. The first bar should run with the move already under way.
- Compare the two opens. Bar two must open at or beyond bar one’s open, never inside its body.
- Confirm the direction flip. Bar two travels the opposite way and closes near its own extreme.
- Measure the wicks. Short wicks on both bars keep the reading clean; long ones muddy it.
- Watch the void. Price should hold away from the gap while you decide what to do.
Notice that step two rules out most candidates. A bar that opens inside the previous body creates an engulfing pattern instead, which our pin bar vs engulfing comparison sets out.
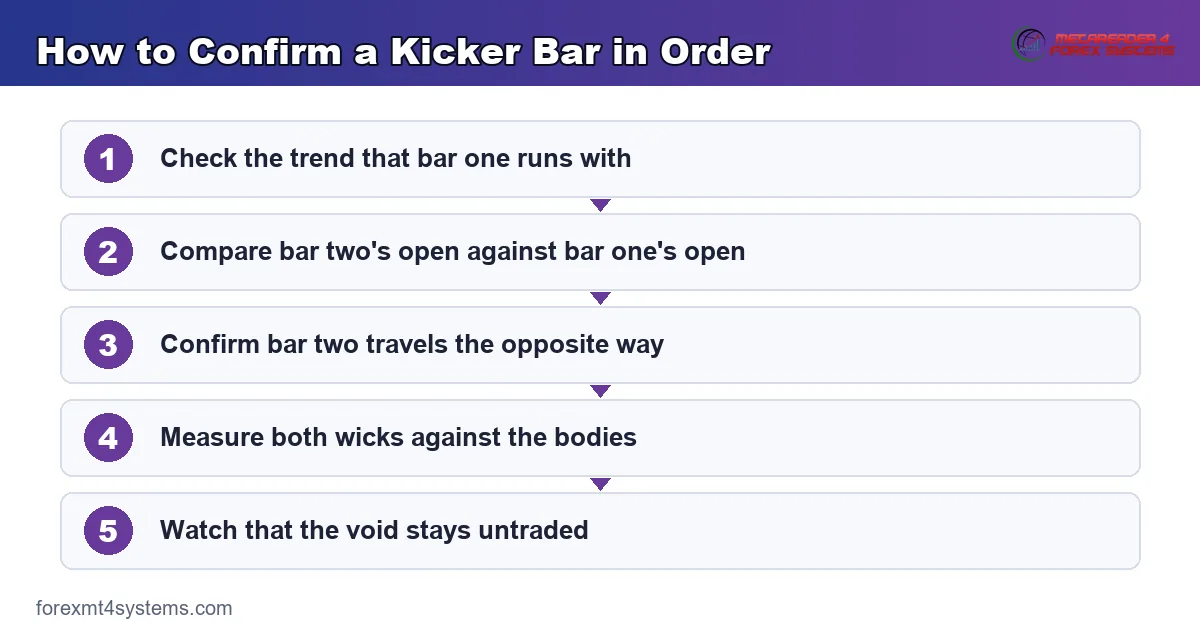
Keep the checks in that order. Traders who start at step three find kickers on charts that never gapped at all.
Why True Kickers Stay Rare in Spot Forex
Here comes the part most pattern guides skip. The kicker depends on a gap, and spot forex barely produces them.
The Market Never Closes
Interbank trading runs from the Sydney open on Monday to the New York close on Friday without a break. Each new bar therefore opens where the last one closed.
Charting software draws the bars back to back for that reason. No void appears, because no trading pause created one.
So a strict kicker cannot form during the week. Any bar you label as one during Wednesday’s session fails the definition at step two.
The Weekend Open Is the Exception
Forex does stop once a week. Prices freeze from Friday evening until Sunday evening, and news keeps arriving through that window.
Sunday’s first bar can therefore open well away from Friday’s close. Election results, central bank statements and geopolitical shocks all land in that gap.
Those weekend gaps stay small most weeks. A few pips of drift barely registers, though a genuine shock can move a major pair by a figure or more.
Where Gaps Really Live
Other markets gap constantly. Stocks, index futures and single-stock CFDs all close overnight, so every session opens with fresh information priced in.
Earnings releases produce textbook kickers on equities. A company reports after the bell, the next open jumps past the previous open, and the bar runs hard in the new direction.
So if you trade indices or shares beside forex, you will meet this shape far more often there. Our candlestick indicators archive covers tools that mark the geometry on any instrument you load.
What About Intraday News Spikes
Fast news can leave a visible step on a one-minute chart. Liquidity thins for a few seconds, quotes jump, and the chart draws what looks like a gap.
Those steps rarely qualify. Trades usually did occur inside the step, so the void exists only because your feed sampled the move too coarsely.
Two brokers will also draw the same spike differently. That inconsistency alone should keep intraday steps out of a pattern definition built on real gaps.
How Big Do Weekend Gaps Get
Most Sunday opens land within a handful of pips of Friday’s close. Traders often miss them entirely, because the chart looks continuous at normal zoom.
Bigger gaps cluster around scheduled weekend events. Referendums, elections and emergency policy meetings all give the market two days of news with nowhere to trade.
Even then, a gap wide enough to clear Friday’s whole open stays uncommon. That extra condition explains why the strict shape appears so seldom on a forex chart.
The Four Kinds of Gap and Where This One Fits
Classic technical analysis sorts gaps into four groups. Knowing which one you face changes how much attention the kicker deserves.
Common and Breakaway Gaps
A common gap appears inside a range on no particular news, and it usually fills within a session or two. Nothing about it suggests a change in control.
A breakaway gap leaves a range or a pattern behind. It marks the start of a move, and traders treat an unfilled breakaway gap as a level worth defending.
The kicker belongs beside the breakaway group. Both describe a reset, and both lose their meaning the moment price fills the void.
Runaway and Exhaustion Gaps
A runaway gap turns up partway through a strong move, which is why some traders call it a measuring gap. It confirms flow rather than announcing a turn.
An exhaustion gap arrives late, after a long run, and usually fills fast. Spotting the difference between the two takes hindsight more often than anyone admits.
So label the gap before you label the pattern. A kicker built on an exhaustion gap tells a very different story from one built on a breakaway.
The Continuous-Market Near-Equivalent
Forex still produces the sentiment reset the kicker describes. It simply packs the whole event into one bar instead of two.
A Full-Range Reversal Bar
Picture a bar that opens near the low of the prior bar’s body and closes at the far end of its own range. Buyers take price straight up with almost no lower wick.
That shape carries the same message: one side seized the session outright. Traders often call the result a bullish marubozu, and our marubozu candlestick guide covers the working tolerance for it.
Pair the marubozu with an engulfing read for a closer match. A wide, wick-free bar that swallows the previous body delivers most of what a kicker delivers.
What It Keeps and What It Loses
The continuous version keeps the speed and the one-sided control. It loses the trapped traders, because everyone who entered late still gets a chance to exit near their entry.
It also loses the clean invalidation line. A gap gives you an obvious level; a single long bar leaves you choosing between its open, its midpoint and its low.
So use the prior bar’s open as your line. That choice mirrors the strict definition and keeps your rules consistent across instruments.
Building a Practical Forex Rule
Write the forex version down as three conditions. Bar two opens at or beyond bar one’s open, closes past bar one’s far extreme, and carries a wick under a fifth of its range.
Those three conditions filter hard. On a daily chart of a major pair you might meet a handful each year, which sounds thin until you remember how few of them you could act on anyway.
Add a fourth condition for location. The bar has to form at a level you drew before it appeared, or the whole read rests on the candle alone.
Then test the rule on your own charts. Scroll back a year, mark every bar that qualifies, and see what the following sessions actually did.
A Worked Example at the Weekend Open
Take a major pair grinding higher into the end of a quiet week. The last daily bar closes bullish, and the tone looks settled.
News lands over the weekend. Sunday’s session opens below the whole of that bullish body, never climbs back into it, and the new daily bar closes near its low.
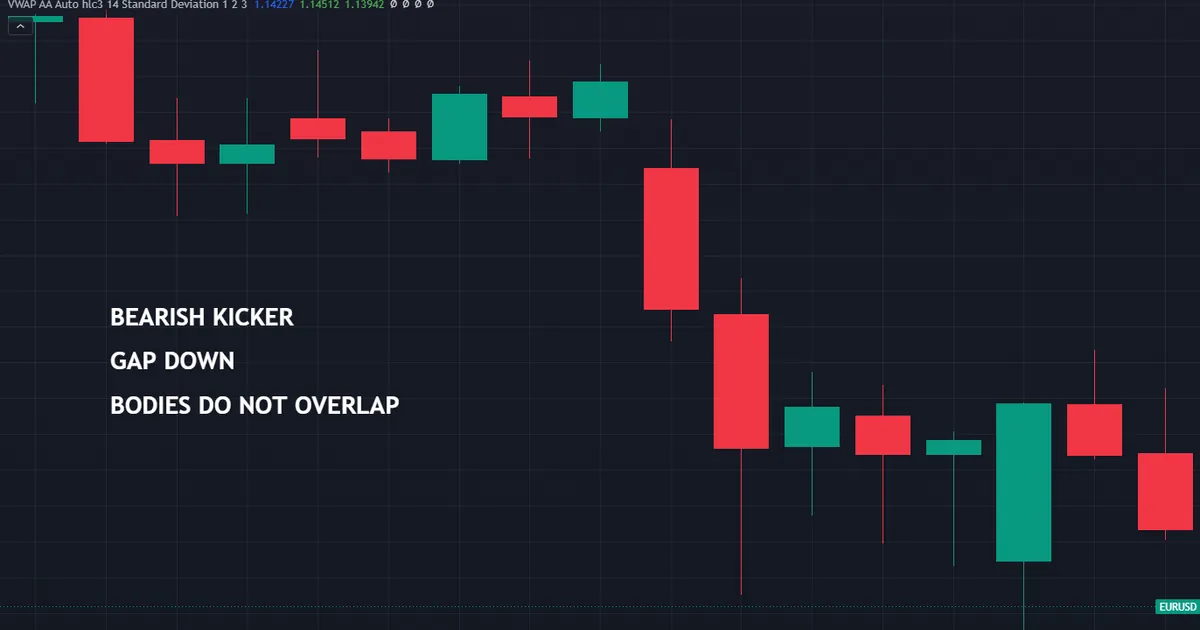
That sequence satisfies every step. Bar one ran with the advance, bar two opened below bar one’s open, and nothing traded back inside that first body.
Reading the Sunday Bar
Sunday liquidity runs thin, so treat the first hours with care. Spreads widen, fills drift, and the early prints often exaggerate the move.
Many traders wait for the London open before acting. By then real volume has arrived, and the gap has either held or closed.
Use that wait productively. Mark the gap edges, note the previous bar’s open, and decide in advance which close would cancel the read.
Planning Both Branches
Two branches follow, and both deserve a plan. Price either holds beyond the gap, or it slides back through and fills the void.
The first branch gives you a setup in the gap’s direction, with the stop on the far side of the void. The second tells you the reset failed, so you stand aside.
Size the branch you take before you click. Our free position size calculator turns that stop distance into a lot size that keeps the risk where you want it.
Where the Stop Belongs
Two stop placements make sense here, and each buys you something different. The tighter one sits just under the gap’s lower edge on a bullish kicker.
The wider one sits beyond the first bar’s extreme. It survives an ordinary retest of the void, though it costs you a much smaller position for the same risk.
Pick by how the gap behaves in the first session. A void that holds cleanly suits the tight stop, while a probe back into it argues for the wider one.
Choosing a Target
Aim at a level that already exists on the chart. The prior swing, an old range edge or the week’s opening price all work better than a round number.
Then compare the two distances. When the target sits closer than the stop, skip the trade instead of shrinking the stop to make the sum look better.
Download the complete indicator database
Put these concepts on your charts. One email unlocks the full library of 1,380+ indicators with compiled MT4 and MT5 files, plus my TradingView scripts. No paywall, no spam, unsubscribe any time.
Get free access to my indicator database
One email unlocks 1,380+ free MT4, MT5 and TradingView indicators — the complete library. No single-tool download; you get the whole database.
Common Kicker Mistakes and the Fixes
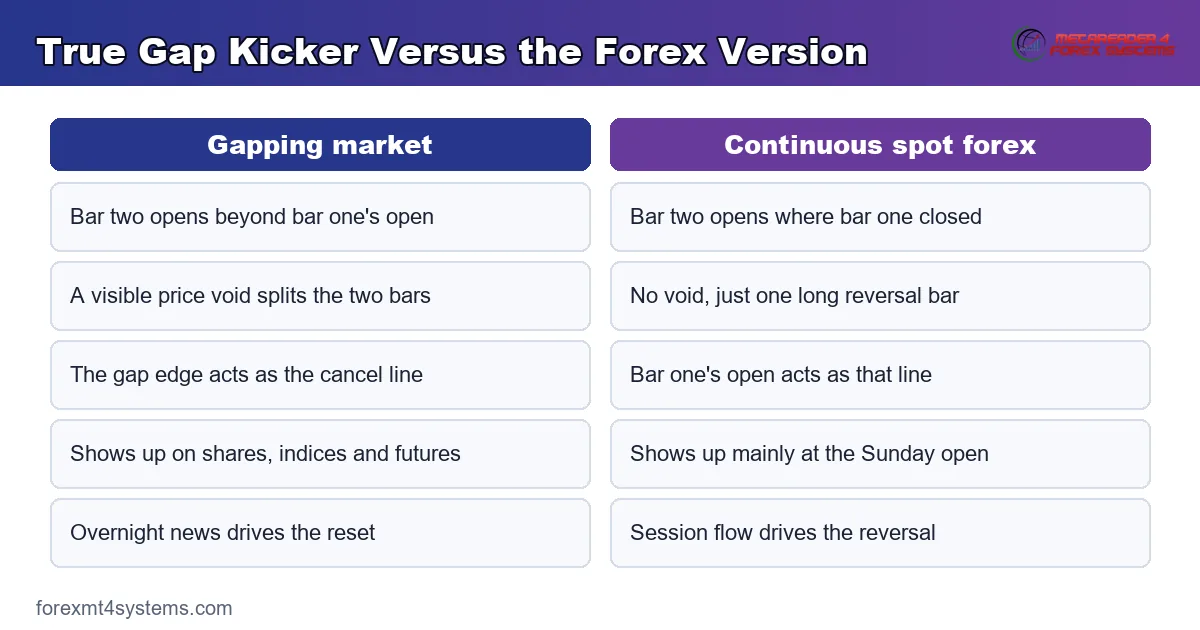
Most errors around this shape come from stretching the definition. The comparison panel below sets the true gap version against the forex version.
Calling Any Strong Reversal a Kicker
A wide bar that flips direction still needs the gap to earn the name. Without one, call it a marubozu or an engulfing bar and treat it accordingly.
Treating the Shape as a Signal
A kicker records a fast change in sentiment. It never tells you what the following week will do, so pair it with a level and a plan rather than acting on the geometry alone.
Forgetting That Rare Means Rare
Strict kickers turn up a handful of times a year on a given forex pair. Traders who expect one every month end up loosening the definition until the name means nothing.
Trading Thin Sunday Liquidity
Early Sunday prints often reverse once London arrives. Wait for volume, then act on the level rather than on the first candle you see.
Ignoring the Gap Fill
Weekend gaps close more often than they hold on quiet news. Watch the void through the first full session, because a filled gap removes the whole basis for the trade.
Using a Broker Feed With Odd Bar Times
Server time decides where your daily bars start. Two brokers can show the same week as five bars or six, which changes whether a gap appears at all.
Skipping the Level Check
A kicker inside a range means far less than the same shape at a level price already respected. Mark your levels first, as our guide to support and resistance explains.
Sizing for the Gap Rather Than the Stop
Wide weekend gaps create wide stops. Cut the position instead of tightening the stop, or you end up exiting on ordinary noise.
Kicker Quick Reference
Keep this table beside your chart. Each row states a condition, not an outcome.
| Check | Bullish kicker | Bearish kicker |
|---|---|---|
| Prior move | Decline under way | Advance under way |
| Bar one | Bearish body, short wicks | Bullish body, short wicks |
| Bar two open | At or above bar one’s open | At or below bar one’s open |
| Bar two close | Near its own high | Near its own low |
| The void | Stays untraded | Stays untraded |
| Cancel line | A close back inside the gap | A close back inside the gap |
Notice the last row. One clean condition cancels the read, which makes this shape easier to manage than most.
Run through the six checks in order every time. Five of them describe geometry you can measure in seconds, and the sixth simply tells you when to walk away.
When the Kicker Fails
Rare shapes still fail, and this one fails in familiar ways. Below, the very same weekend appears on the weekly chart, where the gap simply is not there.
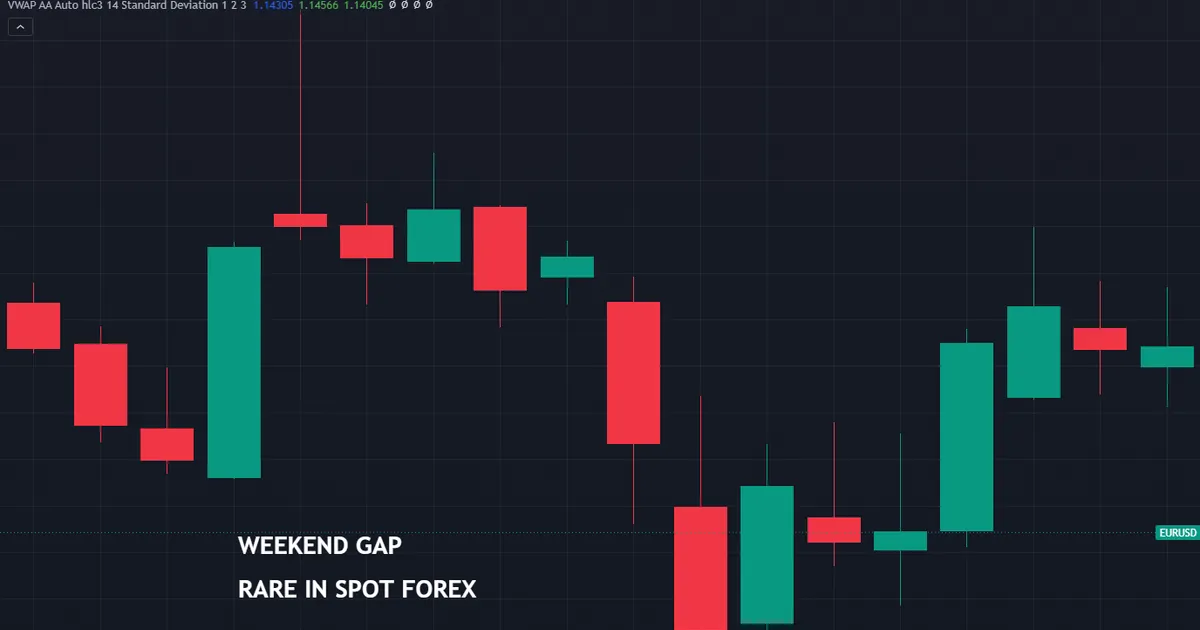
So the shape depends on which chart you happen to open. The weekly bar starts inside the previous week’s range, which leaves one ordinary long body instead of a kicker.
The Gap Closes Quietly
Thin weekend liquidity exaggerates the opening print. Once real flow arrives, price often drifts straight back to Friday’s close and the void disappears.
The News Gets Reinterpreted
Markets change their mind about a headline within hours. A gap driven by a first reading can reverse completely once analysts publish their second thoughts.
Your Broker Drew a Gap Nobody Else Saw
Feeds differ at the weekly boundary. Before you act, check a second chart source, because a gap unique to one feed rarely reflects anything real.
The Level Never Mattered
A kicker in open space leaves you without a stop that means anything. Shapes at levels give you structure; shapes in the middle of nowhere give you a guess.
You Traded the Second Bar Too Early
A bar that looks wick-free two hours before its close can finish with a long tail. Wait for the close, or you commit to a shape the session never delivered.
The Higher Timeframe Disagreed
A bullish kicker inside a firm weekly downtrend fights the larger flow. Check the higher chart first, then decide whether the reset works with that flow or against it.
The Evidence Was Thinner Than the Story
Testing of candlestick shapes has produced mixed results across markets and periods. Our page on whether candlestick patterns work covers that research without the usual hype.
Related Patterns to Study Next
The kicker sits at one end of a spectrum. At the other end you find slow, three-bar turns that take a week to unfold.
Work through our round-up of bearish candlestick patterns for the shapes that appear far more often on forex charts. Each entry there links to a deeper page.
Then decide which shapes suit your instruments. Traders who cover indices and shares meet real gaps weekly, while pure spot forex traders meet them once a week at most.
Study the two-bar family next. Engulfing bars, harami bars and dark cloud cover all compare one session against the last, exactly as the kicker does, and they turn up far more often.
Keep a note of every kicker you find. Because the shape stays rare, a short list built over a year teaches you more about your own instruments than any general article can.
FAQ
What is a kicker candlestick pattern?
It is a two-bar shape where the first bar runs with the trend and the second opens at or beyond the first bar’s open, then travels the other way. Both bars carry long bodies and short wicks, and the space between them stays untraded.
Do kicker patterns appear in forex?
Rarely, because spot forex trades continuously from Monday to Friday. The weekend break creates the only regular chance for a true gap, so genuine kickers show up at the Sunday open rather than mid-week. On indices, shares and single-stock CFDs the same shape appears far more often, since those markets close every night.
What is the difference between a kicker and an engulfing bar?
An engulfing bar opens inside the previous body and closes beyond it. A kicker opens outside that body altogether, leaving a gap. The gap is the whole distinction, and without one you have an engulfing pattern.
Does a filled gap cancel the pattern?
In the classic definition, yes. Once price trades back through the void, the trapped traders escape and the sentiment reset the shape described no longer holds. Most traders treat a close back inside the gap as the cancel line.
Can I trade a kicker on the Sunday open?
You can, though spreads widen and fills drift in the first thin hours. Many traders mark the levels on Sunday and wait for the London session before acting on them. Waiting costs a little entry price and removes most of the noise that thin books create.
How do I tell a real gap from a broker artefact?
Compare two independent chart sources at the weekly boundary. A gap that appears on one feed and not the other reflects server times or a stray quote rather than genuine market movement, so leave it alone.
Is the kicker better than other reversal patterns?
No pattern earns that claim. The kicker simply describes a faster, cleaner reset than most shapes, and it still needs a level, a plan and sensible sizing behind it. Results are not guaranteed; past performance is not indicative of future results.
External references
- For background on this concept, see Kicker Pattern at Investopedia.
- For broader market context, see Kicker Pattern at Corporate Finance Institute.

About the author
Written by Dominic Walsh, a Forex trader and MT4/MT5 indicator, Expert Advisor and script developer. Every tool on forexmt4systems.com is tested on live charts before release and ships with ready-to-use compiled MT4 (.ex4) and MT5 (.ex5) files. Learn more about the trader and developer behind this site.
How we build, test and correct every tool: Editorial & Testing Policy. Trading carries risk; see the disclaimer.