
A single long-wicked bar and a two-bar body takeover often show up at the very same turning point. The pin bar vs engulfing question comes down to one clean idea: rejection inside one session, or a change of hands across two.
This guide sets the two shapes side by side. You will see the exact geometry of each, what each one says about control, where a stop sits naturally, and which of the pair asks for more confirmation.
Pin Bar vs Engulfing: The One Distinction That Matters
Start with the core split. A pin bar tells its whole story inside one bar, because price travels out and comes back before the close.
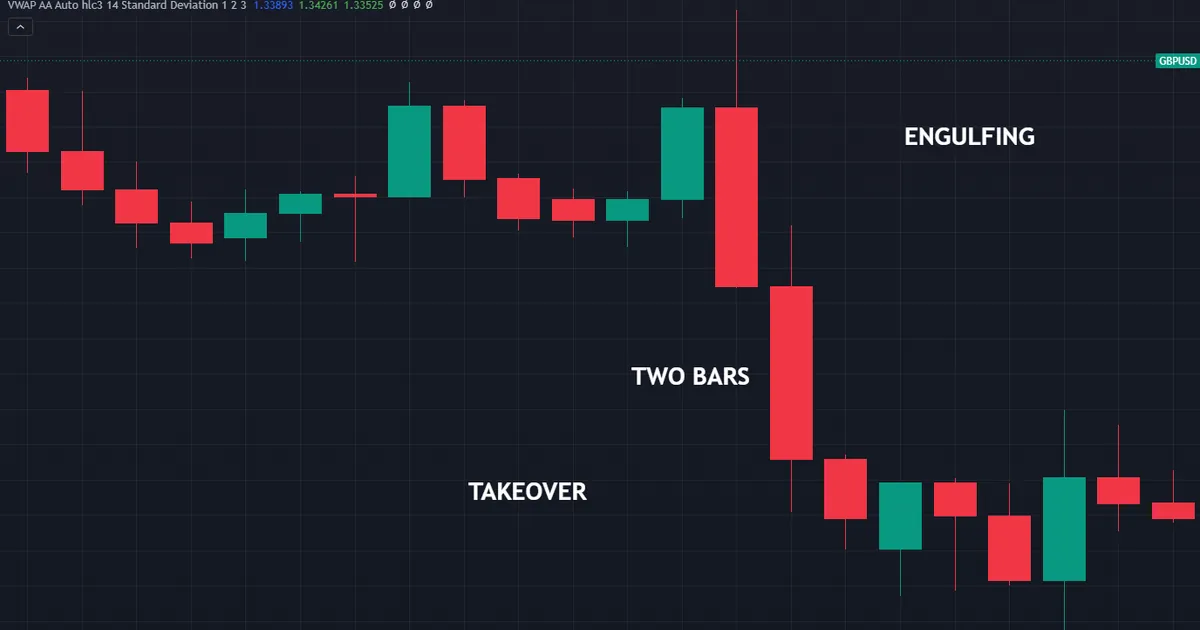
An engulfing pattern needs two bars. The second body covers the first body end to end, so the story only completes when that second session closes.
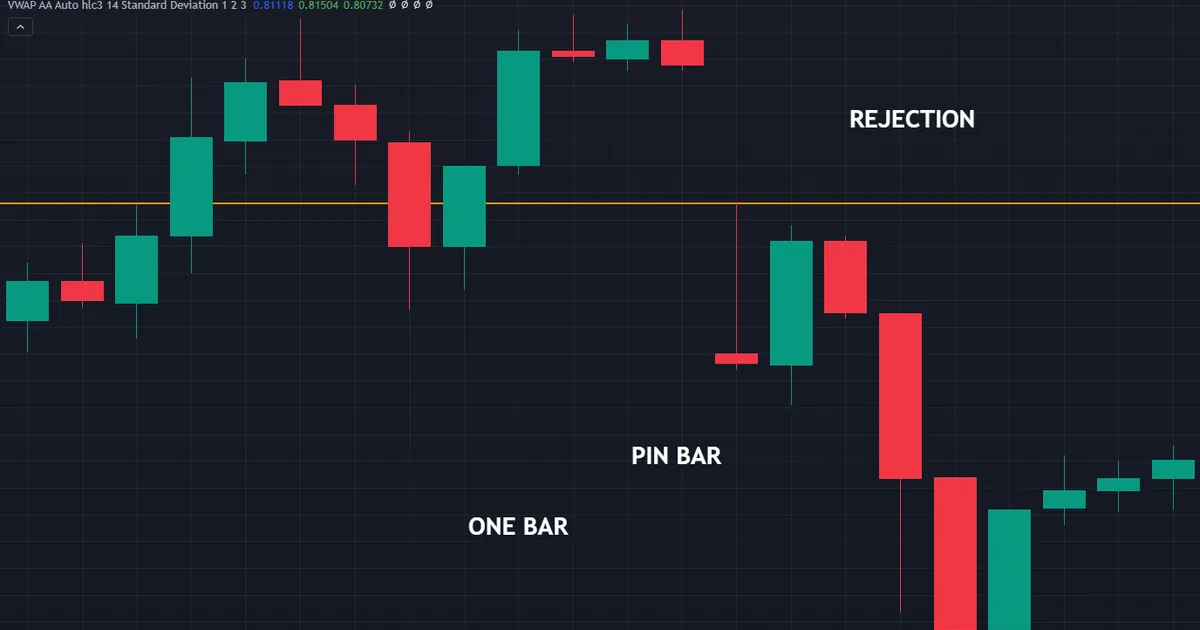
So one shape reports a round trip. The other reports a takeover.
That difference sounds small on screen. Yet it changes where your stop belongs, how long you wait, and how much room the idea needs.
The Anatomy of Each Shape
Both patterns describe the same four numbers: open, high, low and close. Read those four numbers and the labels matter far less.
What a Pin Bar Looks Like
A pin bar carries a small body near one end of its range. The wick on the other side runs long, often two-thirds of the total range or more.
Traders call that long wick the tail. Price pushed out along it, then came all the way back before the session ended.
The name overlaps with the classic hammer and shooting star. Our note on pin bar meaning covers that family, so this page stays on the comparison.
What an Engulfing Pair Looks Like
An engulfing pattern starts with a first bar carrying a modest body. The second bar then opens beyond one end of that body and closes beyond the other.
A bullish version follows a decline: a down body, then an up body covering it. The bearish version mirrors that after an advance.
Most classic definitions measure bodies only and skip the wicks. State which version you use, because a wick-to-wick rule catches far fewer bars.
Bodies, Wicks and Which Part the Rule Reads
The body spans open to close. The wicks run from each end of the body out to the high and the low.
A pin bar lives or dies on wick length against body length. An engulfing pair lives or dies on body coverage.
So the two shapes read different parts of the same bar. One measures travel and return; the other measures how far a second session pushed past the first.
Our guide to candlestick wicks meaning digs into wick ratios if that part feels new.
Where the Two Names Came From
Candlestick charting grew out of Japanese rice trading. Steve Nison brought the technique to Western screens in the early 1990s, and the engulfing pattern belongs to that older vocabulary.
Pin bar arrived much later. Price-action traders coined the term, and it overlaps heavily with the classic hammer and shooting star.
So one name carries centuries of convention. The other comes from a modern trading community, which explains why pin bar definitions vary more from book to book.
How Each Pattern Forms, Step by Step
Watch the sequence rather than the finished picture. Both shapes tell a story about order flow inside a fixed clock window.
- Price leaves the range. The market pushes past a recent extreme and reaches for new ground.
- Orders arrive against it. Something absorbs that push, and price turns back toward where it came from.
- Single-bar route. The close lands back near the far end of the range, leaving one long wick behind.
- Two-bar route. The first bar simply closes with a modest body, and nothing looks special yet.
- The takeover. The next session opens and runs the other way, past both ends of that body.
- The close decides. Nothing counts until the bar finishes, because an unfinished bar can still change shape.
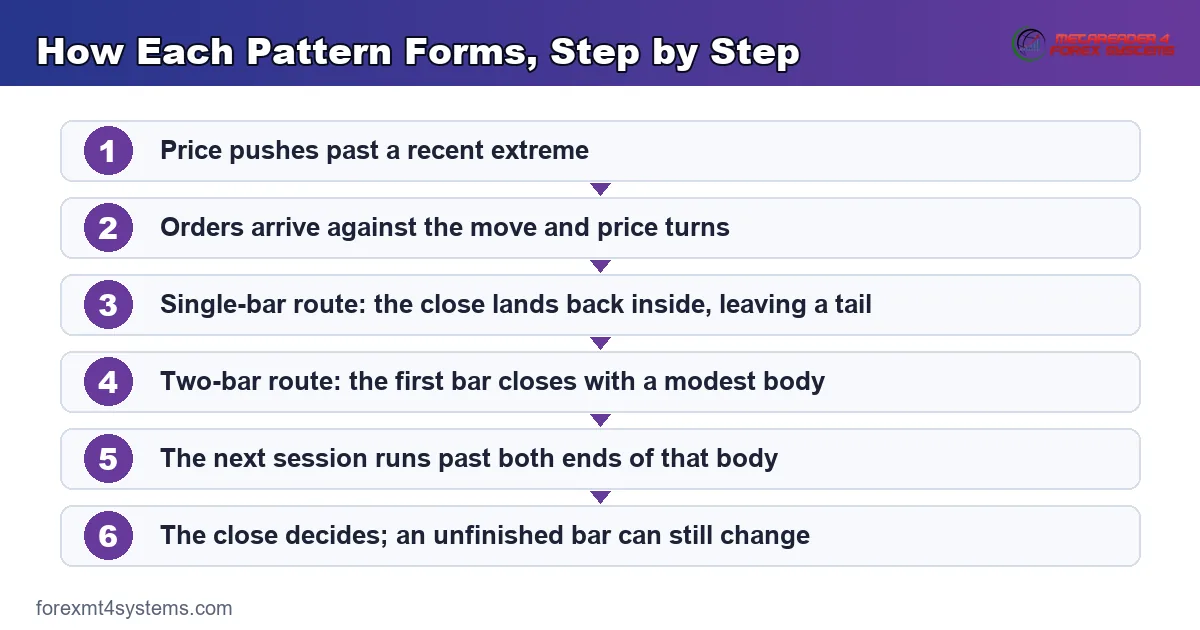
So a pin bar finishes its story in one clock window. An engulfing pair spreads the same argument over two.
That timing gap explains most of the practical differences below. Because you learn the pin bar outcome sooner, you also act on thinner evidence.
What Each One Says About Control
Neither shape predicts anything. Each one simply describes who lost ground during a fixed window, and both readings need context to carry weight.
Rejection: One Side Failed to Hold New Ground
A long lower wick says buyers took back everything sellers gained in that window. A long upper wick says the reverse.
Notice what the shape does not tell you. It says nothing about size, nothing about who traded, and nothing about the next bar.
So treat a pin bar as a report on one session. The market probed, found something, and stepped away from it.
Takeover: A Second Session Overpowered the First
An engulfing pair carries a different message. The second session covered every price the first session used, then closed past it.
That takes more work than a wick. Price had to travel the whole prior body plus more, and it had to hold that ground into the close.
Because of that extra distance, many traders read an engulfing bar as the heavier of the two. Still, distance alone proves very little without a level underneath it.
Session Timing Changes Both Readings
Forex runs around the clock, so a daily bar bundles three sessions into one shape. A tail formed during the quiet Asian hours says less than one formed at the London open.
Drop a timeframe and you can see which session did the work. That check costs a few seconds and often reframes the whole bar.
So note where the wick or the takeover happened in the day. A rejection built during thin hours deserves more caution than the same shape built while volume ran heavy.
Where Confirmation Fits
A pin bar arrives with less evidence behind it. One session turned, and that is all you know.
An engulfing pair arrives with its own confirmation baked in, since the second bar already reversed the first. In effect, you traded one bar of patience for one bar of proof.
So the pin bar usually asks for something extra: a close beyond the nose, a retest that holds, or a level that already mattered. Our page on support and resistance explained covers how to mark those levels first.
Where Each Shape Belongs in a Trend
Location does more work than geometry. Identical bars read three different ways, depending entirely on what came before them.
At the End of a Pullback
Trend traders like both shapes here. A market pulls back into an old breakout level or a moving average, and one of these bars marks the turn.
The trend supplies the context, so the candle only times the entry. That combination asks far less of the pattern than a standalone reversal call.
Because the larger move already points one way, a failed bar costs you a small stop rather than a fight with the trend.
At the Edge of a Range
Ranges hand both shapes a clear job: mark the boundary. A rejection wick at the top of a range describes sellers defending it once more.
Still, ranges break. Two or three failed rejections at the same boundary often warn that the level has thinned out.
So count the tests before you trust the shape. A first test carries more information than a fourth.
After an Extended Run
This spot causes the most trouble. A long tail after a big move might mark exhaustion, or it might mark a pause inside a strong trend.
Many traders wait for a second piece of evidence here, such as a lower high or a break of short-term structure. One bar rarely turns a market that has run for weeks.
Treat the shape as a prompt to tighten management rather than a reason to fade the whole move.
A Worked Example at a Real Level
Context turns both shapes from doodles into information. The chart below shows the engulfing version, then each reading below runs the same level.
Reading the Pin Bar Version
Price falls into an old swing low that held twice before. One session dips under it, then closes back above with a long tail.
The tail alone means little. Because the low already mattered, though, the reclaim carries a bit more weight.
Entry sits above the pin bar high. The stop goes below the tail, which often means a wide distance and a smaller position.
Reading the Engulfing Version
Now run the same level with two bars. One session closes weakly under the low, and the next opens lower and rallies through the whole prior body.
Here the entry sits at or just above the second close. The stop tucks under the pair’s low, and the distance often runs tighter than the pin bar version.
So the same level produced two different trades. One entered earlier with a wider stop; the other entered later with a tighter one.
Sizing the Two Trades
Stop distance drives position size, so the shape of the bar quietly sets your risk. A long tail means fewer units for the same account risk.
Run both versions through our risk reward calculator before you decide which one suits your plan. The arithmetic often settles the argument faster than the chart does.
Keep the account risk fixed and let the stop distance move the size. That habit stops a dramatic-looking bar from quietly doubling your exposure.
What Would Have Invalidated Each Trade
Write the invalidation down before the entry, not after. On the pin bar version, a close under the tail says the reclaim failed and the old low gave way.
On the engulfing version, a close under the pair’s combined low does the same job. Either way, one number ends the idea.
Notice how clean that makes the review afterwards. You either respected the level you wrote down, or you did not, and the journal entry writes itself.
Download the complete indicator database
Put these concepts on your charts. One email unlocks the full library of 1,380+ indicators with compiled MT4 and MT5 files, plus my TradingView scripts. No paywall, no spam, unsubscribe any time.
Get free access to my indicator database
One email unlocks 1,380+ free MT4, MT5 and TradingView indicators — the complete library. No single-tool download; you get the whole database.
Where Stops and Targets Differ
Both patterns hand you a natural invalidation point. They just sit in different places.
Stops on a Pin Bar
The tail extreme marks the level the market already rejected once. A close beyond it says the rejection failed.
So most traders park the stop a small buffer past the tail. On a long bar that distance can dwarf the average range, which is exactly when sizing discipline earns its keep.
Check the bar against recent volatility before you commit. Our guide to ATR in trading shows how to measure a normal range for the pair and timeframe.
Stops on an Engulfing Pair
Here the pair’s combined low or high does the same job. Price covered that ground twice, so a move beyond it undoes the takeover.
That level often sits closer to the entry, because the entry itself arrived later. You gain a tighter stop and give up some of the move.
Neither arrangement wins by default. One buys you room and costs you size; the other buys you size and costs you some of the range.
Targets and Trade Management
Structure sets targets in both cases: the next swing, the opposite side of a range, or a prior level. The candle itself offers no target at all.
Because a pin bar entry sits closer to the extreme, its reward-to-risk ratio can look generous on paper. Just remember the wider stop makes that ratio harder to hold in real trading.
Size the position from your stop rather than from the pattern’s reputation. Our ATR position size calculator handles the volatility-adjusted version of that sum.
Partial Exits and the First Target
Both shapes tend to produce a fast first move followed by a pause. Many traders take part of the position off at the nearest structure, then let the rest run.
That choice suits the pin bar version especially well. Since the stop sits far away, banking part of the trade early trims the exposure without abandoning the idea.
On an engulfing entry the maths differs. A tighter stop means the first target arrives sooner in reward terms, so a single exit often works just as well.
Common Mistakes, and How to Fix Them
Most of the trouble with these two shapes comes from the same handful of habits. Each one has a simple correction.
Trading Either Pattern in Open Space
A rejection wick in the middle of a range describes noise. The fix: mark your levels before you look for candles, then only read bars that land on them.
Calling a Bar Early
A forming bar can look perfect and finish ugly. The fix: wait for the close, every time, and set an alert rather than watching the screen.
Measuring an Engulfing Bar Wick to Wick
Classic definitions cover the body, not the whole range. The fix: pick one rule, write it in your plan, and apply it the same way on every chart.
Ignoring the Bar Before the Pattern
An engulfing bar after a tiny doji says less than one after a strong body. The fix: compare body sizes, and treat a takeover of a substantial body as the more meaningful version.
Letting the Stop Distance Set Itself
A dramatic tail can triple your usual stop without you noticing. The fix: convert the stop into position size first, then decide whether the trade still fits.
Reading Both Shapes on a Tiny Timeframe
A one-minute chart prints these bars constantly. The fix: pick the timeframe your plan trades, and let the higher timeframe supply the level.
Quick Reference: Which Shape Is In Front of You
Run this list before you label anything. Six answers settle it.
- How many bars does the shape need: one, or two?
- Where does the body sit inside the range?
- How long is the wick against the body?
- Does the second body cover the first body completely?
- Did the bar close, or is it still forming?
- What level, trend or swing sits underneath the shape?
- What stop distance does the shape imply, and what size follows?
Answer all seven and the label almost writes itself. Skip the last two and you have a picture rather than a trade.
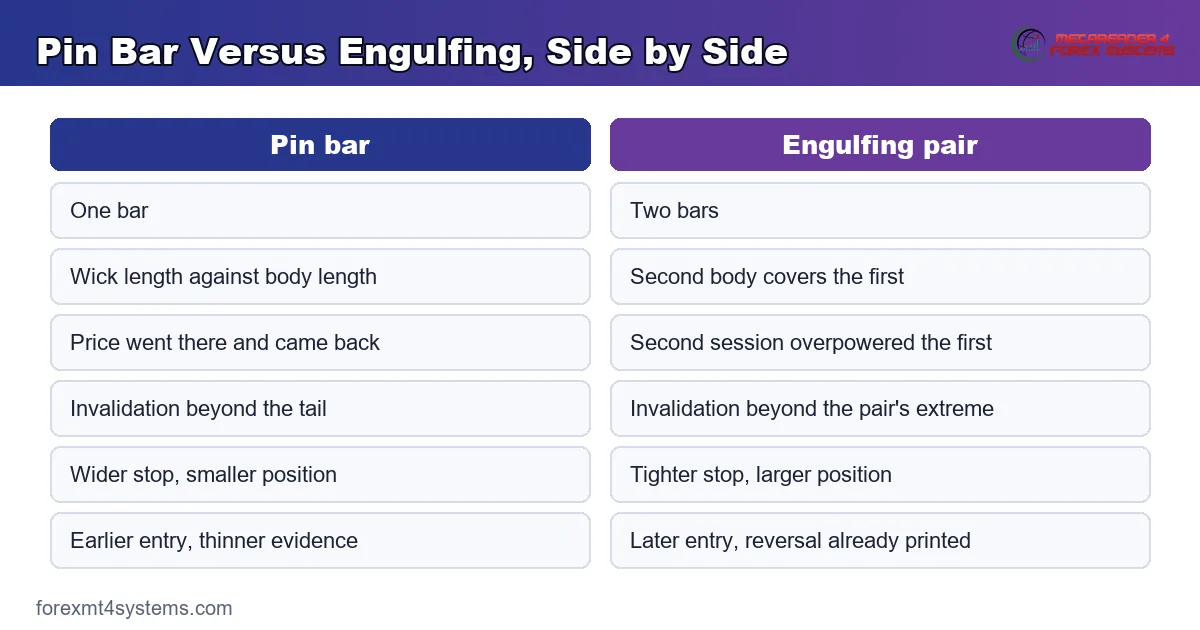
Side-by-Side Summary
| Feature | Pin bar | Engulfing pair |
|---|---|---|
| Bars needed | One | Two |
| Core measurement | Wick length against body length | Second body covering the first body |
| Message | Price went there and came back | The second session overpowered the first |
| Natural invalidation | Beyond the tail extreme | Beyond the pair’s combined low or high |
| Typical stop width | Wider, so a smaller position | Tighter, so a larger position |
| Entry timing | Earlier, on thinner evidence | Later, with the reversal already printed |
| Extra confirmation | Usually wanted | Partly built into the second bar |
Pin that table beside your charts for a week. Once the six rows feel automatic, the naming argument stops costing you time.
When Each Pattern Fails
Failure teaches faster than success here. The chart below shows a textbook shape that simply did not follow through.
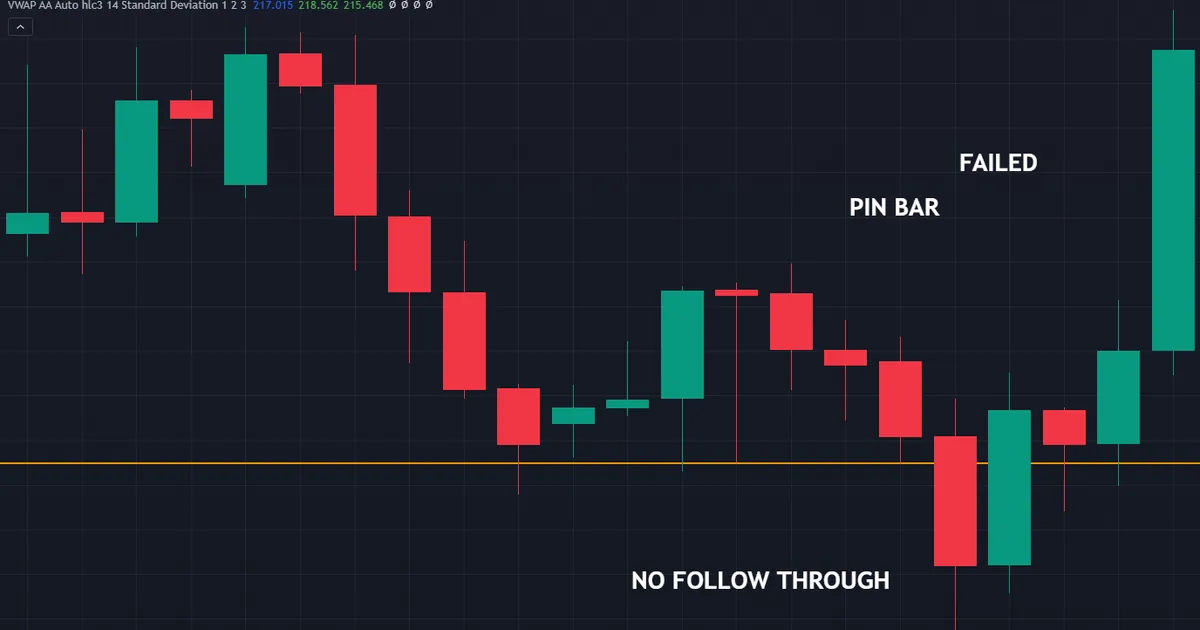
A Rejection That Gets Re-Tested at Once
A long tail prints, then the very next bar cuts straight through it. Nothing about the pattern promised otherwise, since one session of rejection can meet a larger flow the next day.
Engulfing Bars Inside a Range
Ranges produce takeovers constantly, in both directions. Because each side keeps overpowering the other, the shape describes chop rather than a turn.
News Bars That Look Like Both
A data release can print a huge wick and a huge body within minutes. That shape reflects a scheduled event rather than a shift in control, so treat those bars with extra care.
When the Shape Runs Out of Room
Sometimes the reading holds and the target still sits too far away. A pin bar entry near the extreme leaves little room before the next level, which caps the move.
Clusters That Cancel Themselves
Three rejection wicks in four bars, pointing both ways, describe indecision. Our note on engulfing candle meaning shows how repeated takeovers inside a tight zone tend to cancel out.
Shapes on the Wrong Instrument
Thin crosses and exotic pairs print long wicks for reasons that have nothing to do with rejection. Wide spreads and patchy liquidity stretch the range, so check the pair before you read the bar.
Related Concepts to Study Next
These two shapes make more sense beside their neighbours. A short reading list finishes the picture.
Start with the wider pattern families in our candlestick indicators library, then browse the broader price action indicators collection for tools that mark levels automatically.
After that, spend your time on location rather than shapes. A pattern at a level you already drew beats a prettier pattern in open space, every time.
Then track your own results by shape. Log which version you took, the stop distance it forced, and what the market did next, because your own record beats any general claim about either pattern.
FAQ
What is the main difference between a pin bar and an engulfing pattern?
A pin bar is one bar with a long rejection wick, so the whole move out and back happens inside a single session. An engulfing pattern needs two bars, and the second body must cover the first body completely. One reports rejection; the other reports a takeover.
Which one needs more confirmation before entry?
The pin bar, generally. It arrives after one session, so you hold less evidence at the moment of entry. An engulfing pair already contains a reversal of the previous bar, which some traders treat as confirmation in itself.
Can a bar be both a pin bar and part of an engulfing pattern?
Yes, and that overlap happens often. A bar with a long tail can also engulf the body before it, especially after a small-bodied session. Read the geometry rather than the label, then size the trade from whichever stop level you actually intend to use.
Do wicks count when measuring an engulfing bar?
Traditional definitions measure bodies only, so the wicks may stick out on either side. A stricter wick-to-wick rule exists, and it flags far fewer bars. Pick one version, write it into your plan, and apply it consistently across every chart.
Which timeframe suits these patterns best?
Higher timeframes filter out more noise, so daily and four-hour bars carry more information than one-minute bars. That said, the pattern still only matters where it appears. A shape sitting on a level you drew in advance beats the same shape floating in open space.
How big must the wick be for a valid pin bar?
No single rule governs it, because the term came from a trading community rather than a formal text. A common convention asks for a wick around two-thirds of the total range, with a small body at the far end. Write your own threshold into your plan and stick to it, so your review data stays consistent.
Does either pattern work on its own?
No. Both describe what already happened during a fixed window, and neither forecasts the next bar. Treat them as trade-location tools inside a plan that already defines levels, risk and exits. Results are not guaranteed; past performance is not indicative of future results.
External references
- For background on this concept, see Bearish Engulfing Pattern at Investopedia.
- For broader market context, see Bullish Engulfing Pattern at BabyPips Forexpedia.

About the author
Written by Dominic Walsh, a Forex trader and MT4/MT5 indicator, Expert Advisor and script developer. Every tool on forexmt4systems.com is tested on live charts before release and ships with ready-to-use compiled MT4 (.ex4) and MT5 (.ex5) files. Learn more about the trader and developer behind this site.
How we build, test and correct every tool: Editorial & Testing Policy. Trading carries risk; see the disclaimer.