
RSI false signals trap more traders than almost any other oscillator mistake. The tool looks decisive, its bounds seem clear, and a reading past 70 or 30 feels like a command. Yet the market ignores those lines again and again.
So this guide unpacks RSI false signals in plain terms. By the end you will know why the oscillator misleads, which patterns cause the most damage, and how a little context turns a trap into a tradeable edge.
RSI False Signals: Why Good Setups Fail
The Relative Strength Index measures momentum on a scale from 0 to 100. Welles Wilder built it in 1978 to compare the size of recent gains against recent losses. So a high reading means buyers dominated lately, and a low reading means sellers did.
Most traders watch the 70 and 30 marks. Above 70 the tool reads overbought, and below 30 it reads oversold. The trouble starts when people treat those words as orders rather than descriptions.
An overbought reading does not mean sell. It means buyers pushed hard and recently, and that pressure can carry price much further. So a signal that looks like a top is often just a strong trend flexing its muscle.
Look at a concrete frame. The chart shows GBPUSD on the one-hour timeframe with a standard 14-period RSI. Price trends up near 1.34, and the RSI pins above 70 for hours while price keeps climbing. Every short taken on that overbought reading loses.
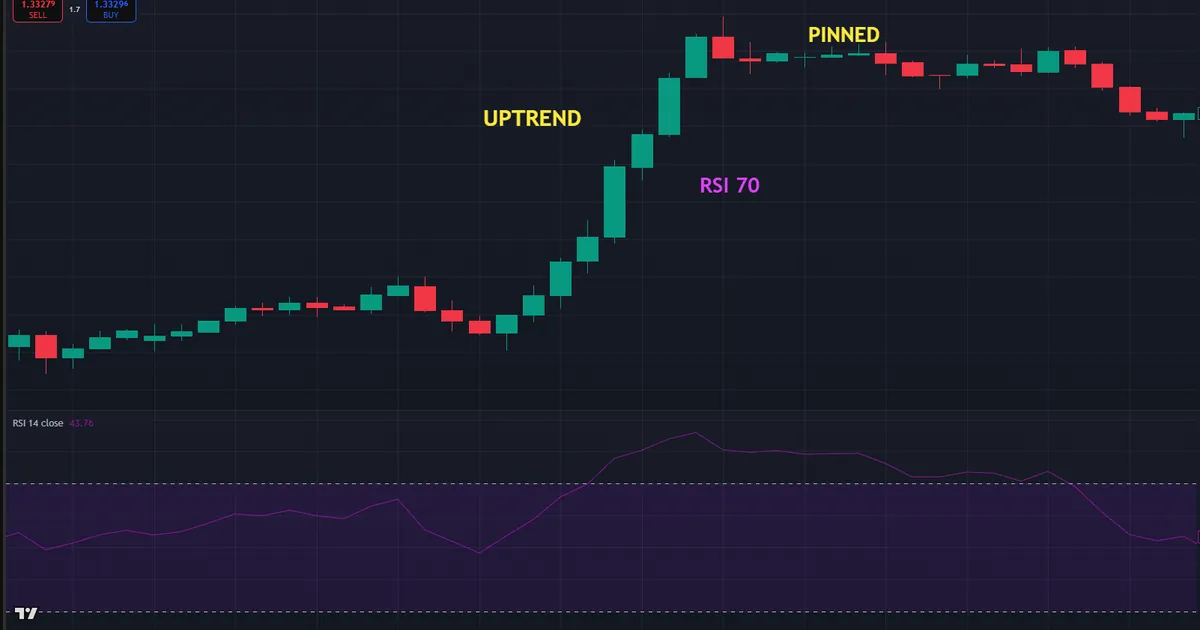
Now trace the trap from left to right. First the RSI pokes above 70 as the trend accelerates. Then it stays there, bar after bar, instead of rolling over. So a trader who faded the first overbought print watched price run straight through the stop.
Why does this happen so often? An oscillator answers one narrow question about recent momentum. It knows nothing about the wider trend, so a stretched reading in a strong move signals strength, not exhaustion.
How the RSI Produces a False Signal
The oscillator does not lie; it simply gets misread. A handful of specific patterns cause most of the damage, so learn them once and you will spot the trap forming.
- Pinning in a trend. In a strong move, the RSI can hold above 70 or below 30 for many bars. Each extra bar tempts a fade, and each fade fails while the trend runs on.
- The single poke. A brief spike past a bound, followed by an instant return, often marks noise rather than a turn. Acting on that one poke fires too early.
- The midline whipsaw. In a range, the RSI crosses 50 back and forth with every small swing. Trading each cross stacks small losses in choppy price.
- The false divergence. Price and the RSI can drift apart for many bars before price agrees, if it ever does. So a divergence alone times nothing.
- The setting mismatch. A 14-period window that feels smooth on one pair looks jumpy on a wilder one. The wrong length prints extremes that never mattered.
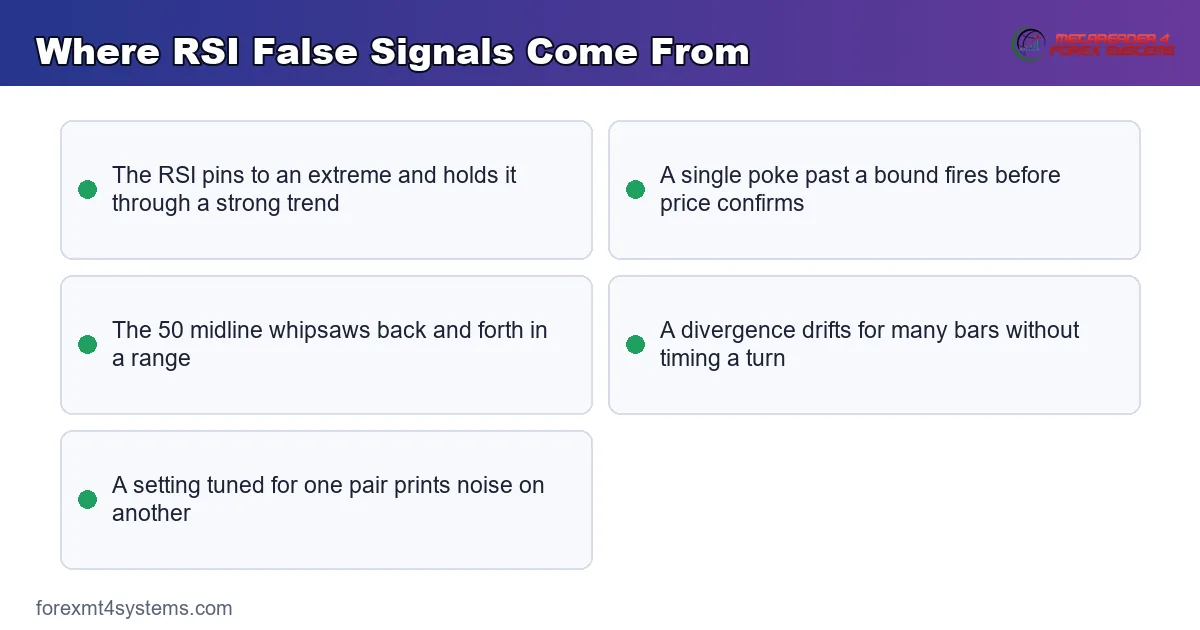
So most false signals come from ignoring the trend, acting too early, or misjudging the setting. The concept graphic below lines these traps up side by side.
Understanding the Failure Swing
Wilder himself warned against trading the raw extreme. He favoured the failure swing instead, a pattern that adds a layer of confirmation. So the failure swing filters many of the pokes that trap newer traders.
On the bullish side, the RSI dips under 30, bounces, pulls back, then forms a second low that holds above 30. That higher low, followed by a break of the small peak between them, marks the swing. Because the pattern needs two moves, it ignores the single false poke.
The bearish version mirrors it above 70. A first peak, a dip, then a lower second peak that fails to reclaim 70 signals fading momentum. So the failure swing asks price to prove the turn before you act.
The pattern works because it demands rejection, not just an extreme. A raw poke says only that price stretched; a failure swing says price stretched and then could not stretch again. Because that second attempt failed, the odds of a genuine turn improve. So the extra wait filters many of the traps that catch impatient traders.
Why the Midline Matters
The 50 line carries quiet value that many traders skip. On the RSI, 50 splits bullish momentum from bearish. Price holding above 50 favours buyers, and below 50 favours sellers.
Use that midpoint as a bias filter. When the RSI stays above 50, you lean long and treat oversold dips as chances, not shorts. Because the midpoint moves slower than the extremes, it keeps you anchored to the larger trend while faster signals come and go.
The Overbought Myth
The word overbought does more harm than any other on the chart. It sounds like a ceiling, so beginners read it as a sell order. Yet the RSI never claims price must fall; it only says buyers led lately.
Strong trends override the reading constantly. Price can push higher for days while the RSI camps above 70 the whole time. So an overbought print in a rising market often flags a healthy trend, not a tired one.
Reframe the two words in your mind. Overbought means stretched to the upside, and oversold means stretched to the downside. Because stretched is not the same as reversing, neither reading is a signal to trade on its own.
Fitting the RSI Into a Real Workflow
Standard settings exist because many traders watch the same numbers. That shared attention gives the defaults real weight, so start there before you tweak anything.
The RSI defaults to 14 periods with 70 and 30 bounds. Some day traders widen the bounds to 80 and 20 in a strong trend, which cuts the count of false extremes. So a small change can filter a lot of noise on a trending pair.
Reading the Trend First
Context turns the RSI from a trap into a tool. So read the trend before you read the oscillator. When the higher timeframe trends up, trust oversold dips and ignore overbought prints, since the trend overrides them.
Flip the logic in a downtrend. There, overbought bounces offer shorts and oversold prints mislead. Because the trend sets the bias, the same RSI reading means opposite things in opposite markets.
Choosing a Timeframe
Timeframe changes how often the RSI misfires. On a daily chart, a 14-period window smooths noise and prints fewer false extremes. On a one-minute chart, the same window whips to its bounds constantly, so expect far more traps.
Because higher timeframes calm the tool, they cut the false-signal rate. So a swing trader leans on the four-hour and daily reads, while a scalper must filter harder on the lower charts. Pick the timeframe that fits your screen time, then set your expectations there.
Pairing the RSI With Structure
The RSI should never trade alone. It reads best next to plain price structure, such as a recent swing high or a round number. So map your support and resistance first, then let the oscillator time the touch.
Take a GBPUSD case near 1.335. An oversold RSI that prints right at a prior swing low carries far more weight than one floating in open space. Because the level and the oscillator agree, the odds of a bounce improve, and the risk of a false signal drops.
Adding a Trend Filter
A single moving average pairs well with the RSI. The average names the trend, and the oscillator times the entry within it. So the two tools split the work rather than repeat it, which cuts the false-signal rate.
Run the filter simply. When price sits above a rising average, take only the RSI’s with-trend signals and skip the counter-trend ones. Because the filter blocks the trades most likely to fail, it removes a whole class of false signals before they tempt you.
Worked Example: A False Overbought on GBPUSD
Picture GBPUSD trending up hard on the one-hour chart through the London session. Price climbs past 1.34, and the RSI pushes above 70 early in the run. A trader eyeing the overbought reading gets ready to short.
Watch what the raw signal would have done. The RSI stays pinned above 70 for the next several hours while price keeps grinding higher. So each short on the overbought print stops out as the trend rolls on. The chart below marks that pinned oscillator against the rising trend.
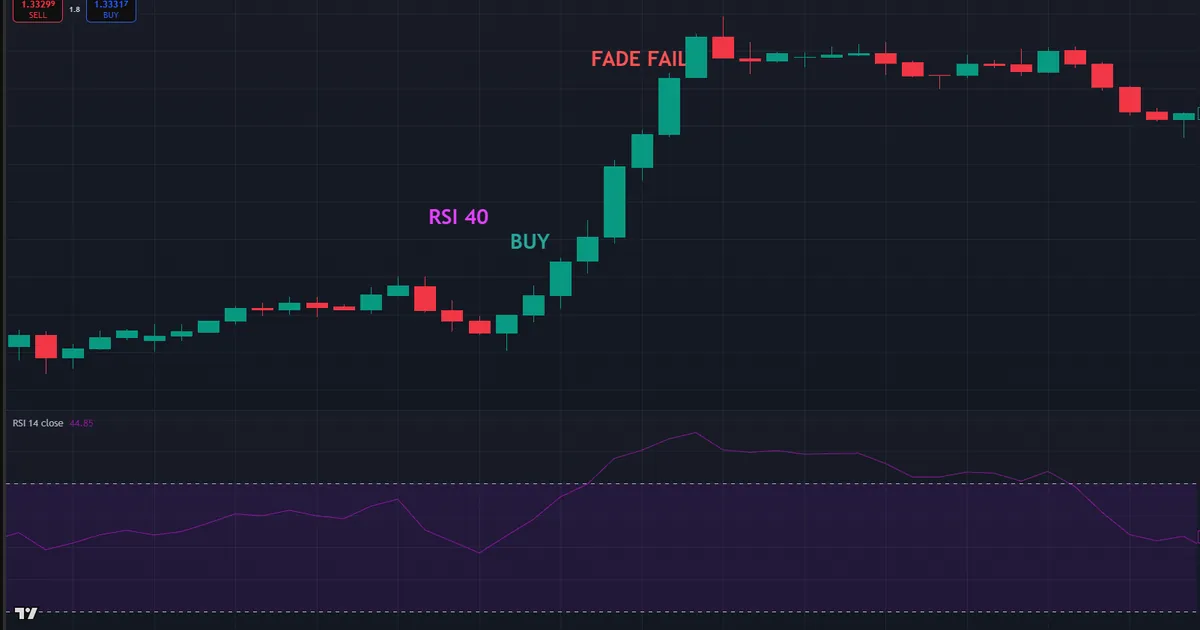
Now rebuild the trade with context. A patient trader checks the daily chart first and sees a clear uptrend. So they drop the short idea entirely and wait for an oversold dip instead. When the RSI later eases toward 40 on a pullback near 1.343, they prepare to buy with the trend.
Then the confirmation arrives. Price steadies at a prior swing low, a bullish candle closes, and the RSI curls back up from its dip. Because the entry aligned with the trend and a level, the trade ran with the move rather than against it.
The follow-through rewarded the patience. Price pushed to a fresh high while the earlier overbought reading proved meaningless. So the false signal was not the RSI’s fault; it was the fault of fading a strong trend on a single reading.
Notice the shift in mindset here. The trader stopped asking the RSI to call the top and started asking it to time an entry within a known trend. Because the question changed, the same tool suddenly helped rather than hurt. So the fix was context, not a new indicator.
Managing the Trade After Entry
A clean entry is only half the job. The exit decides the result. So plan your target before the trade goes live, and let the RSI help you hold or fold.
In this GBPUSD case, the RSI holding above 50 supported staying in the move. A stop under the pullback low kept the risk small and clear. Because the trend still ran, an early exit would have left pips on the table.
Download the complete indicator database
Put these concepts on your charts. One email unlocks the full library of 1,380+ indicators with compiled MT4 and MT5 files, plus my TradingView scripts. No paywall, no spam, unsubscribe any time.
Get free access to my indicator database
One email unlocks 1,380+ free MT4, MT5 and TradingView indicators — the complete library. No single-tool download; you get the whole database.
Common Mistakes and How to Fix Them
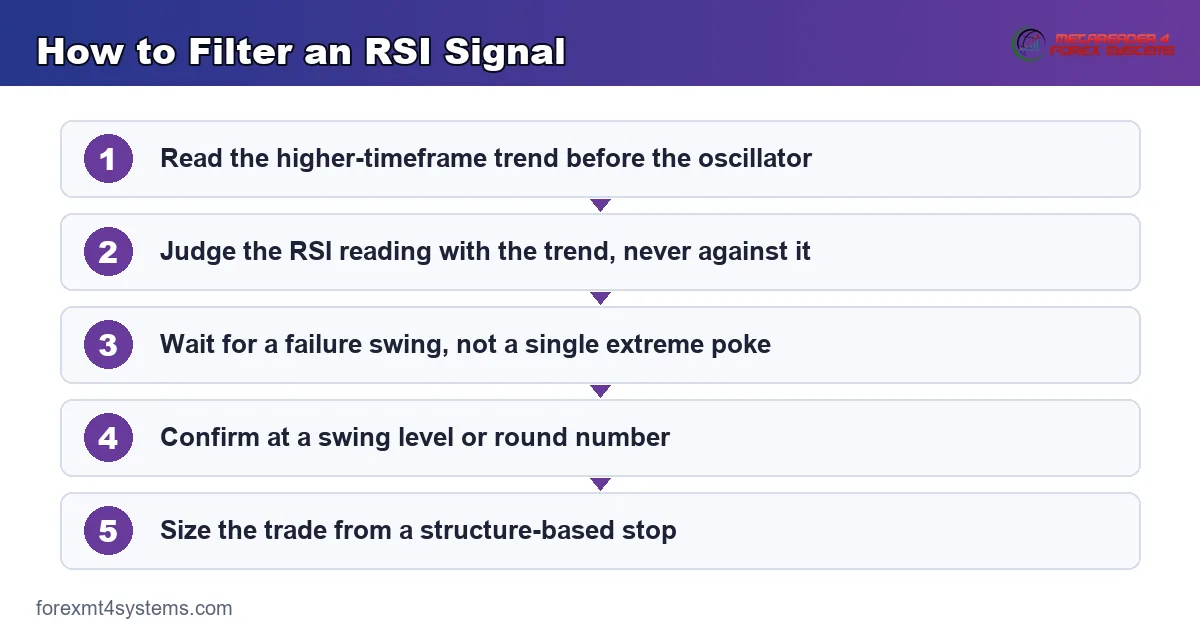
The RSI is simple, yet the same errors repeat on every timeframe. Most trace back to trading an extreme against a strong trend, and the fixes follow beneath the graphic.
Fading Every Overbought Reading
An overbought RSI does not mean sell. In a strong uptrend, it can hold above 70 for hours while price climbs. So use the reading as a caution, not a signal, and wait for price to confirm a turn.
Acting on a Single Poke
A brief spike past 70 or 30 rarely justifies a trade. Skilled traders wait for a failure swing instead. So demand a second move that proves the turn before you commit.
Trading the Midline in a Range
The RSI crosses 50 back and forth when price drifts sideways. Trading each cross in a range stacks small losses fast. Instead, confirm a trend exists first, then treat the midline as a bias filter.
Trusting Divergence as a Timer
A gap between price and the RSI hints at fading momentum, yet it can persist for many bars. So treat divergence as a warning, not a trigger. Wait for a price signal before you act on it.
Using One Setting for Every Pair
A 14-period window that feels smooth on EURUSD can look jumpy on a wilder pair. Because each pair carries its own rhythm, one fixed number rarely serves them all. So test your chosen length on the exact pair you trade.
Pre-Trade RSI Checklist
Run this short list before every entry. A few seconds here saves hours of regret later. So slow down, tick each item, and let a failed check keep you out of a marginal trade.
- Higher-timeframe trend read on the daily and four-hour charts.
- RSI reading judged with the trend, not against it.
- A confirmed pattern, such as a failure swing, rather than a single poke.
- Price structure agreeing, with the signal at a swing or round number.
- Stop distance set from the recent swing.
- An active session, London or New York, open now.
- Position size worked from the stop distance before entry.
When Even the Fixes Fail
Study the failure case as hard as the winner. Here is a common one. GBPUSD breaks out and trends hard on the fifteen-minute chart. A trader, sure the move is stretched, shorts every RSI print above 70.
Then the losses stack up. Price keeps climbing while the RSI stays pinned near its ceiling for the whole run. Even a failure swing never forms, because momentum simply does not fade. The chart below shows that trap, with the pinned oscillator marked against the rising trend.
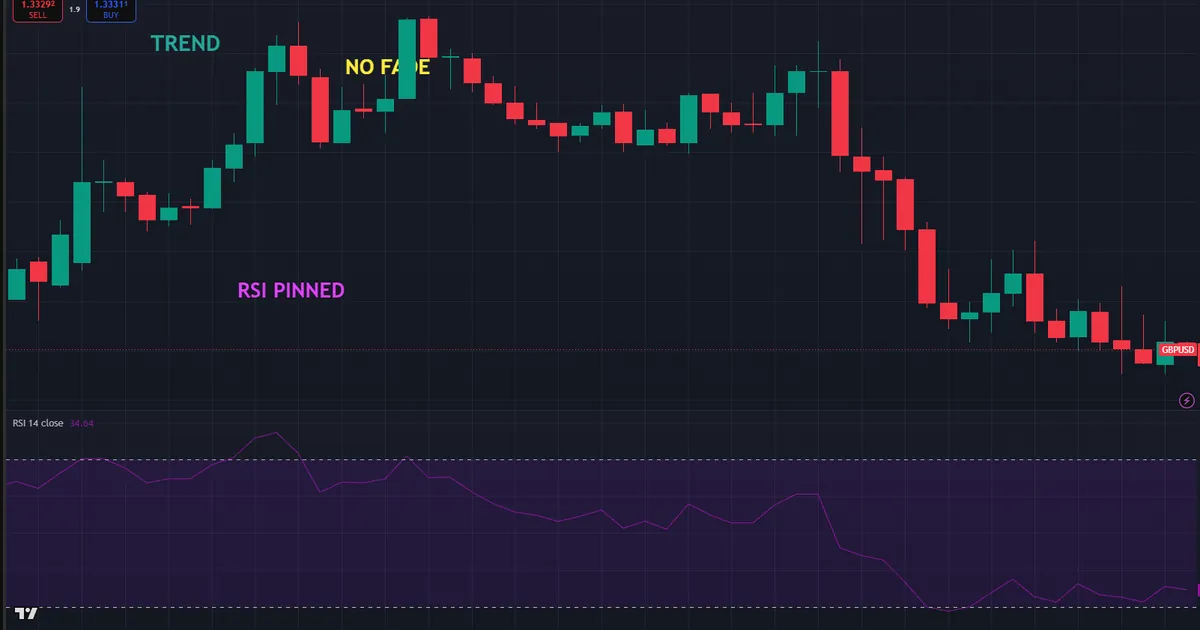
So what went wrong? The market had a strong trend, and the RSI breaks down in one. An extreme reading in a trend signals strength, not exhaustion. Hence the rule that limits the damage: never fade an extreme unless price itself confirms the turn.
There is a deeper lesson in that trap. The RSI answers only one narrow question about recent momentum. It knows nothing about the higher-timeframe trend or the news on the wire. So a reading that looks decisive in the lower pane can be meaningless in the wider picture.
Then size each trade so a bad read costs little. A sensible stop flows from the swing structure, and position size flows from that stop, which our free position size calculator works out in seconds. Because the risk stayed small, a wrong signal stung rather than wounded.
Quiet Hours Breed False Extremes
Be honest about the clock. Most false extremes print in dead sessions and thin news gaps, where price drifts without direction. So a stretched RSI in the quiet Asian hours deserves extra doubt. Instead, wait for London or New York to confirm the move.
News Overrides the Oscillator
Be honest about news too. A sharp release can drive the RSI to an extreme and hold it there while price runs on the headline. Because the oscillator only reflects that momentum, it offers no edge against the event. So check the calendar before you trust any reading near a release.
No Filter Removes Every Trap
Be honest about the limit of the fixes as well. A trend filter and a failure swing cut the false-signal rate, yet neither drives it to zero. So accept that some clean setups still fail, and let sound risk keep those losses small.
Judge your process over many trades, not one. A method that filters most traps will still lose sometimes, and that is normal. Because no rule catches every false signal, consistency and modest risk matter more than any single perfect read.
Related Concepts to Study Next
RSI false signals connect to a web of sibling topics, and a few deserve your next reading hour. Start with our notes on RSI settings for day trading to tune the bounds and length for your pace. Then read our guide to what overbought and oversold really mean, since the false signal starts with a misread of those words.
One more guide sharpens the read. Because divergence causes so many false timing calls, study what divergence is in trading, and learn why a gap between price and the RSI warns without timing a turn.
For hands-free charting, the RSI indicators archive plots the oscillator with alerts, while the oscillator indicators archive gathers the wider family of bounded tools. Tools speed the work, yet the logic above still carries the trade. So learn the rules first, and let any indicator plot what you already understand.
FAQ
Why does the RSI give so many false signals?
The RSI measures only recent momentum, so it ignores the wider trend. In a strong move it pins to an extreme and stays there, which traps anyone fading the reading. Judge it with the trend, not against it.
What is an RSI failure swing?
A failure swing adds confirmation to a raw extreme. On the bullish side, the RSI dips under 30, bounces, forms a higher low above 30, then breaks the small peak between them. Because it needs two moves, it filters single false pokes.
Can I avoid RSI false signals by changing the settings?
Widening the bounds to 80 and 20 cuts some false extremes in a trend, and tuning the length to the pair helps too. Yet no setting removes false signals entirely. Context and structure matter far more than the numbers.
Does the RSI work better in ranges or trends?
The RSI reads cleaner in ranging or gently trending markets, where extremes often mark turns. In a strong trend it pins and misleads. So match your expectation to the market before you trust a reading.
Should I move the RSI bounds from 70 and 30?
Widening the bounds to 80 and 20 can suit a strongly trending pair, since it prints fewer extremes. Some range traders keep 70 and 30 for earlier warnings. Test either choice on your own charts, and let the market’s behaviour, not habit, decide the levels.
Is RSI divergence a reliable signal?
Divergence hints at fading momentum, but it times nothing on its own. A gap between price and the RSI can persist for many bars. So treat it as a warning and wait for a price trigger before you act.
Does a higher timeframe reduce false signals?
Yes, a higher timeframe usually cuts the false-signal rate. A 14-period RSI on the daily chart smooths noise and prints fewer stray extremes than the same window on the one-minute. So step up a timeframe when the lower chart whips too often to trust.
Does the RSI ever work in every market?
No tool works in every market, and the RSI struggles most in strong, one-way trends. Read it with the trend, wait for a clear price confirmation, and always keep your risk small. Read every reading in context, and manage risk on every trade. Results are not guaranteed; past performance is not indicative of future results.
External references
- For background on this concept, see Market Noise at Investopedia.
- For broader market context, see Whipsaw at BabyPips.

About the author
Written by Dominic Walsh, a Forex trader and MT4/MT5 indicator, Expert Advisor and script developer. Every tool on forexmt4systems.com is tested on live charts before release and ships with ready-to-use compiled MT4 (.ex4) and MT5 (.ex5) files. Learn more about the trader and developer behind this site.
How we build, test and correct every tool: Editorial & Testing Policy. Trading carries risk; see the disclaimer.