
The overbought and oversold meaning behind those two words trips up more new traders than almost any other pair of terms on the chart. Both sound like commands, yet neither one is. So a reading past an extreme sends countless beginners into losing trades.
This guide fixes that. It lays out the overbought and oversold meaning in plain terms, shows why the extremes rarely force a reversal, and explains how trend context turns a stretched reading into a useful clue.
Overbought and Oversold Meaning in Plain Terms
An oscillator turns raw price into a bounded number, usually between 0 and 100. That number rises as buyers press and falls as sellers take over. So the tool measures how stretched the recent move has become.
Overbought describes the top of that scale. It means buyers have pushed hard and recently, so price sits high in its recent range. On the Relative Strength Index, readings above 70 carry the label.
Oversold describes the bottom. It means sellers have driven price low in its recent range, and on the RSI that shows below 30. Welles Wilder, who built the RSI in 1978, chose those marks as rough guides, not hard triggers.
Here is the key point that so many miss. Overbought does not mean sell, and oversold does not mean buy. Each word reports pressure, not a prediction, so the market can stay stretched far longer than feels reasonable.
Look at a concrete frame. The chart shows EURUSD on the one-hour timeframe with a standard 14-period RSI. Price trends up near 1.14, and the RSI holds above 70 for a long stretch while price keeps rising. The overbought label never forced a turn.
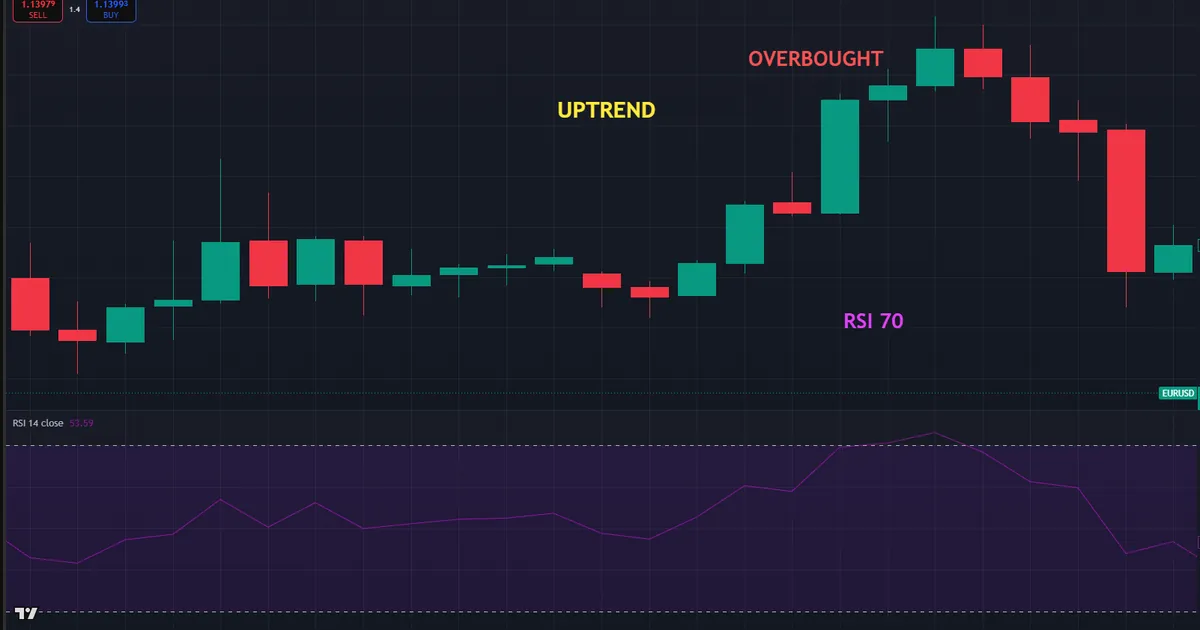
Now trace the reading from left to right. First the RSI climbs into the overbought zone as buyers take control. Then it stays there, bar after bar, while price grinds higher. So the extreme flagged strength, not a ceiling.
Why does this matter so much? A trader who reads overbought as a sell order fights the very trend the tool just confirmed. So the meaning of the word decides whether the reading helps or hurts.
How an Oscillator Reaches an Extreme
The math behind these labels is small, so learn it once and reuse it forever. A few ideas explain how a reading gets stretched, and the rest follows.
- Momentum on the RSI. The RSI averages recent up-closes against recent down-closes over 14 bars. Strong, one-sided buying pushes it toward 100, while heavy selling drags it toward 0.
- Range position on the Stochastic. The Stochastic asks where the close sits inside the recent high-low range. A close near the top prints near 100, and a close near the bottom prints near 0.
- The extreme zones. On the RSI, 70 and 30 mark the stretched zones, while the Stochastic uses 80 and 20. Both split the scale into a high band, a middle, and a low band.
- The inverted cousin. The Williams %R measures the same idea on a flipped scale from 0 to minus 100, with minus 20 and minus 80 as its bounds. So it reads overbought and oversold upside down.
- The role of the setting. A shorter look-back reaches the extremes faster and more often, while a longer one calms the tool. So the same market can look overbought on one setting and neutral on another.
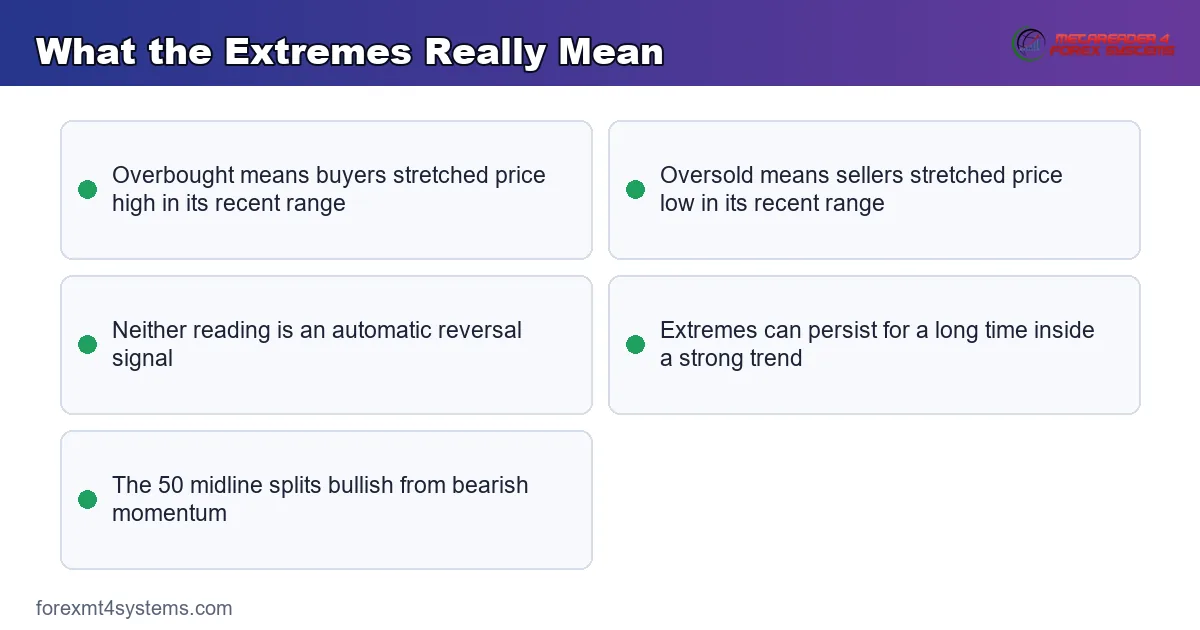
So an extreme reflects how strongly and how recently one side pushed price. The concept graphic below lines up the two main ways an oscillator reaches its bounds.
Why the Extremes Persist in a Trend
A strong trend keeps one side in control for a long time. So the oscillator pins to its extreme and stays there, because the underlying pressure never lets up. That persistence is exactly why fading the reading fails so often.
Think of it as a warning light, not a stop sign. An overbought reading says the move is stretched, which invites caution. Yet caution is not the same as a reversal, so price can stay overbought through an entire leg.
History drives the point home. In powerful trends, an oscillator can sit above its upper bound for dozens of bars while price marches on. So a trader who counts on the extreme to cap the move keeps getting run over. Because the pressure behind the trend is real, the tool simply reports it.
What the Middle of the Scale Tells You
The midpoint carries quiet value that many traders skip. On the RSI, the 50 line splits bullish momentum from bearish. Price above 50 favours buyers, and below 50 favours sellers.
Use that midpoint as a bias filter. When the reading holds above 50, you lean long and treat oversold dips as chances rather than shorts. Because the midpoint moves slower than the extremes, it anchors you to the larger trend.
Overbought Is Not the Same as Expensive
One more misread deserves attention. Overbought does not mean the price is expensive in any lasting sense. It only compares recent closes against recent losses over a short window.
So a currency can look overbought on the hourly chart yet cheap against its monthly trend. Because the oscillator sees only its own look-back, it says nothing about long-term value. So never confuse a stretched short-term reading with a verdict on the wider market.
Fitting the Extremes Into a Workflow
Standard settings exist because many traders watch the same numbers. That shared attention gives the defaults real weight, so start there before you tweak anything.
The RSI defaults to 14 periods with 70 and 30 bounds, and the Stochastic to 14, 3, 3 with 80 and 20. Some day traders widen the RSI bounds to 80 and 20 in a strong trend, which cuts false extremes. So a small change filters a lot of noise.
Reading the Trend First
Context turns an extreme from a trap into a tool. So read the trend before you read the oscillator. When the higher timeframe trends up, trust oversold dips and ignore overbought prints, since the trend overrides them.
Flip the logic in a downtrend. There, overbought bounces offer shorts and oversold prints mislead. Because the trend sets the bias, the same extreme means opposite things in opposite markets.
This single rule saves more accounts than any setting tweak. Trading with the trend turns the oscillator into a timing tool, while trading against it turns the same reading into a trap. So decide the trend direction first, and let that decision gate every extreme you act on.
Where the Extremes Actually Work
The labels earn their keep in a range. When price bounces between clear support and resistance, an oversold reading at the floor often marks a turn, and an overbought reading at the ceiling does too. So the extremes shine when no trend dominates.
That is the honest boundary of the tool. In a range, stretched readings pair well with the edges of the box. In a trend, they mislead unless you trade with the move. So identify the market type before you trust any extreme.
Overbought and Oversold in a Countdown to a Turn
A range does not last forever, and the extremes hint at its shape. When each overbought reading at the ceiling fails to push a new high, sellers may be gaining. When each oversold reading at the floor stops making new lows, buyers may be stepping in.
So watch how the extremes behave over several touches, not just one. A weakening series of highs at an overbought ceiling warns that the range may break lower. Because the pattern builds over time, it rewards patience far more than a single stretched print ever could.
Pairing the Extremes With Structure
An oscillator should never trade alone. It reads best next to plain price structure, such as a recent swing high or a round number. So map your support and resistance first, then let the reading time the touch.
Take a GBPUSD case near 1.34. An oversold RSI that prints right at a prior swing low carries far more weight than one floating in open space. Because the level and the oscillator agree, the odds of a bounce improve.
Turn that idea into a simple habit. Before you act on any extreme, ask whether price sits at a level that matters. When the reading and the level line up, the trade earns a place on your screen. When the reading floats alone, let it pass, since an extreme without structure rarely holds.
Worked Example: An Oversold Dip on EURUSD
Picture EURUSD trending up on the one-hour chart through the London session. Price rides near 1.14, holding above a rising average, so the trend reads clearly bullish. Then a routine pullback drags price lower.
Watch the oscillator react. The RSI eases from the overbought zone down toward 35 as the dip deepens. A trader who fears the earlier overbought print might have shorted; the patient one waits for this with-trend oversold reading instead. The chart below marks that dip into support.

Now the trade builds itself. Price steadies at a prior swing low near 1.137, a bullish candle closes, and the RSI curls up from its oversold dip. Because the trend, the level, and the reading all agree, the long carries real weight.
Then the follow-through rewards the read. Price pushes back toward the recent high while the RSI climbs through 50 and beyond. So the oversold reading worked here precisely because it lined up with the trend, not against it.
Notice the contrast with the earlier overbought print. That reading failed as a short because it fought the trend, while this oversold reading worked as a buy because it followed the trend. So the same tool gave opposite-quality signals depending on context.
Managing the Trade After Entry
A clean entry is only half the job. The exit decides the result. So plan your target before the trade goes live, and let the oscillator help you hold or fold.
In this EURUSD case, the RSI holding above 50 supported staying in the move. A stop under the swing low kept the risk small and clear. Because the trend still ran, an early exit would have left pips on the table.
Watch for the first real warning as well. When the RSI later prints overbought and then rolls back under 70 while price stalls, the move may be tiring. So use that combination as a cue to tighten the stop, not as a reason to flip short on the spot.
Download the complete indicator database
Put these concepts on your charts. One email unlocks the full library of 1,380+ indicators with compiled MT4 and MT5 files, plus my TradingView scripts. No paywall, no spam, unsubscribe any time.
Get free access to my indicator database
One email unlocks 1,380+ free MT4, MT5 and TradingView indicators — the complete library. No single-tool download; you get the whole database.
Common Mistakes and How to Fix Them
The labels are simple, yet the same errors repeat on every timeframe. Most trace back to reading an extreme as a command, and the fixes follow beneath the graphic.

Selling Every Overbought Reading
An overbought oscillator does not mean sell. In a strong uptrend, it can hold above the bound for hours while price climbs. So use the reading as a caution, not a signal, and wait for price to confirm a turn.
Buying Every Oversold Reading
The mirror error catches just as many. An oversold reading in a downtrend often marks a pause, not a bottom. So skip the counter-trend buy and wait for the trend to shift before you trust the low reading.
Ignoring the Market Type
The extremes behave one way in a range and another in a trend. Treating both markets the same invites steady trouble. So classify the market first, then apply the reading in the way that market allows.
Acting on a Single Poke
A brief spike past a bound, then an instant return, usually marks noise. Acting on that one poke fires too early. So wait for confirmation, such as a cross back out of the zone, before you commit.
Forgetting the Higher Timeframe
An oversold reading on the five-minute means little against a falling daily trend. Truly, the higher timeframe frames every lower signal. So check the daily direction before you trust any intraday extreme.
Reading-the-Extremes Checklist
Run this short list before every entry. A few seconds here saves hours of regret later. So slow down, tick each item, and let a failed check keep you out of a marginal trade.
- Higher-timeframe trend read on the daily and four-hour charts.
- Market type classified, either ranging or trending.
- Extreme judged with the trend, not against it.
- Reading confirmed at a swing level or round number.
- A trigger present, such as a cross back out of the zone.
- Stop distance set from the recent swing.
- Position size worked from that stop before entry.
When the Extremes Mislead
Study the failure case as hard as the winner. Here is a common one. XAUUSD breaks out and trends hard on the fifteen-minute chart. A trader, sure the move is stretched, sells every overbought print near 4100.
Then the losses stack up. Price keeps climbing toward 4150 while the oscillator stays pinned near its ceiling the whole way. Each short on the overbought reading stops out. The chart below shows that trap, with the pinned oscillator marked against the rising trend.
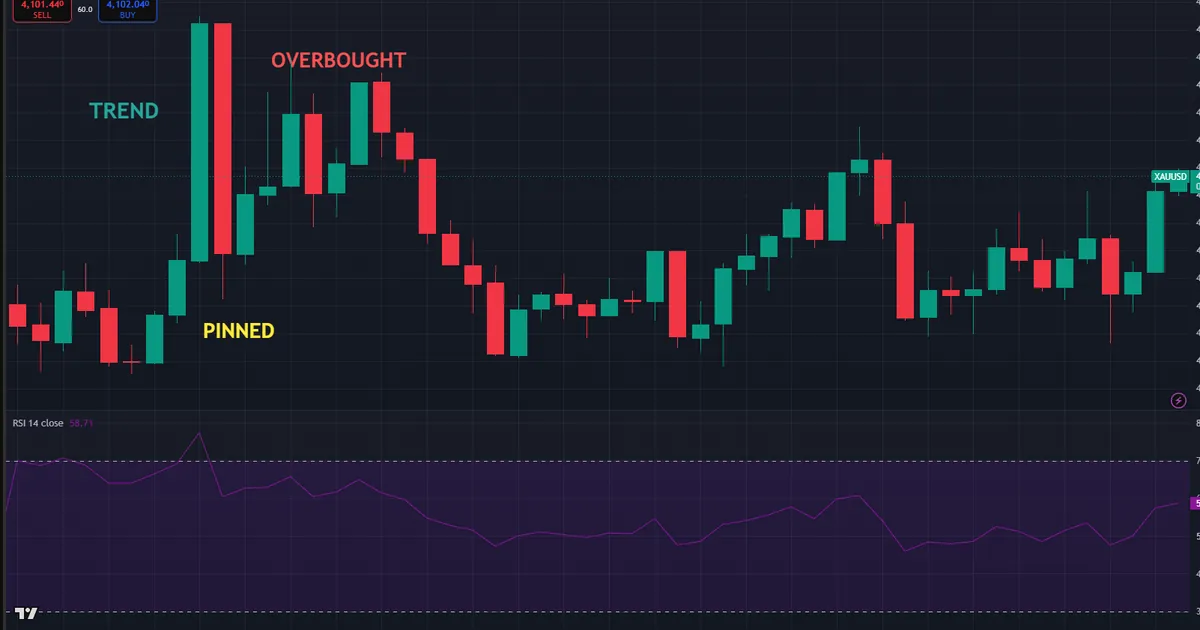
So what went wrong? The market had a strong trend, and the extremes break down in one. An overbought reading in a trend signals strength, not exhaustion. Hence the rule that limits the damage: never fade an extreme unless price itself confirms the turn.
There is a deeper lesson in that trap. An oscillator answers only one narrow question about the recent range or momentum. It knows nothing about the higher-timeframe trend or the news on the wire. So a reading that looks decisive in the lower pane can be meaningless in the wider picture.
Then size each trade so a bad read costs little. A sensible stop flows from the swing structure, and position size flows from that stop, which our free position size calculator works out in seconds. Because the risk stayed small, a wrong signal stung rather than wounded.
Extremes Cluster in Quiet Hours
Be honest about the clock. Many false extremes print in dead sessions and thin news gaps, where price drifts without direction. So a stretched reading in the quiet Asian hours deserves extra doubt. Instead, wait for London or New York to confirm the move.
Different Oscillators Disagree
Be honest about tool choice too. The Stochastic reaches an extreme far faster than the RSI, so the two often disagree on the same bar. Because each measures a different thing, neither reading is the truth on its own. So weigh them together rather than trusting one blindly.
The Setting Changes the Reading
Be honest about the settings as well. A shorter look-back hits the extremes more often, so the same trend can look overbought far sooner. A longer look-back calms the tool and prints fewer stretched readings.
So the word overbought is partly a function of your chosen length. Two traders on the same chart can disagree simply because their settings differ. Because of that, test your length on the pair you trade, and read the extreme in light of the setting behind it.
Related Concepts to Study Next
The overbought and oversold labels connect to a web of sibling tools, and a few deserve your next reading hour. Start with our guide to RSI false signals, since most of them begin with a misread extreme. Then read our breakdown of the Stochastic oscillator to see how a faster tool marks the same zones.
One more guide rounds out the picture. Because the Williams %R flips the scale, study what the Williams %R is, and you will read overbought and oversold from the opposite direction.
For hands-free charting, the overbought and oversold indicators archive gathers the extremes-based signals, while the oscillator indicators archive plots the wider family of bounded tools. Tools speed the work, yet the logic above still carries the trade. So learn the rules first, and let any indicator plot what you already understand.
FAQ
What does overbought mean in forex?
Overbought means buyers pushed price high within its recent range, and momentum has stretched to the upside. It flags a stretched, extended move, not a fixed ceiling. So price can stay overbought for a long time during a strong, sustained uptrend.
Does oversold mean I should buy?
No, oversold does not mean buy. It means sellers drove price low in its recent range. In a quiet range it may mark a bounce, but in a strong downtrend it often marks only a brief pause before more selling.
What RSI levels count as overbought and oversold?
The RSI marks overbought above 70 and oversold below 30 by default. The Stochastic uses 80 and 20, while the Williams %R uses minus 20 and minus 80 on its flipped scale. Some traders widen these bounds to filter noise in a strong trend.
Why does price keep rising while overbought?
A strong trend keeps buyers in control, so the oscillator pins to its extreme and stays there for many bars. The reading confirms the strength of the move rather than capping it. So an overbought print inside a healthy trend is normal, not a reversal cue on its own.
Do overbought and oversold readings work in every market?
They work best in ranging markets, where extremes often mark turns at the edges of the box. In a strong trend they pin and mislead the trader who fades them. So classify the market carefully before you trust any single reading.
Is oversold a good time to catch a falling market?
Rarely, and the attempt traps many traders. An oversold reading in a steep downtrend usually marks a brief pause, not a bottom. So wait for the trend to shift and for price to confirm before you buy a falling market.
Can I trade on overbought and oversold alone?
No, the extremes need trend context, price structure, and a clear trigger to become tradeable. On their own they only describe recent pressure. So build a full plan around each reading, and manage risk on every trade. Results are not guaranteed; past performance is not indicative of future results.
External references
- For background on this concept, see Overbought at Corporate Finance Institute.
- For broader market context, see Overreaction at Investopedia.

About the author
Written by Dominic Walsh, a Forex trader and MT4/MT5 indicator, Expert Advisor and script developer. Every tool on forexmt4systems.com is tested on live charts before release and ships with ready-to-use compiled MT4 (.ex4) and MT5 (.ex5) files. Learn more about the trader and developer behind this site.
How we build, test and correct every tool: Editorial & Testing Policy. Trading carries risk; see the disclaimer.