
If you have ever asked what is Williams %R, the short answer is a momentum oscillator that measures where price sits inside its recent range. Larry Williams built it to spot when a move has stretched too far, and it reads on an inverted scale that trips up many first-time users.
This guide answers what is Williams %R in plain terms and shows you how to use it. So by the end, you will read the -20 and -80 levels with confidence, tell momentum from a true reversal, and see how the tool differs from the stochastic oscillator it closely resembles.
What Is Williams %R and How Does It Work?
Williams %R, sometimes written Percent Range, is a momentum oscillator on a scale from 0 to -100. The name comes from its creator, Larry Williams, who introduced it in the 1970s. It answers one question: where does the current close sit within the high-to-low range of the recent bars?
The reading works upside down compared with most tools. A value near 0 means price closed at the top of its recent range, which is a strong, overbought condition. A value near -100 means price closed at the bottom, which is a weak, oversold condition. So the closer to zero, the stronger the recent buying.
Look at a concrete reading first. The chart shows EURUSD on the one-hour timeframe. Williams %R climbs to around -8, tags the overbought zone above -20, and price stalls just under a prior swing high before easing back.
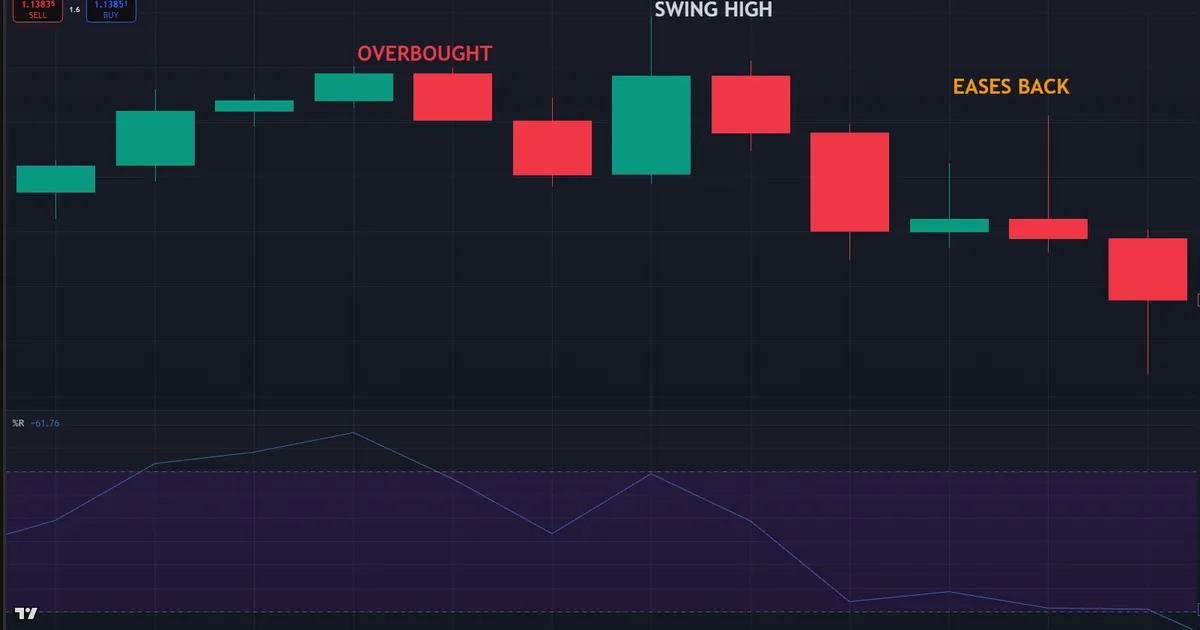
Now trace what that reading tells you. First, price closed near the very top of its recent range. Then the tool flagged that stretch by pushing above -20. Because a swing high sat right there, the overbought tag lined up with a real level rather than firing in open space. That overlap is the point, and it beats any single number in isolation.
So the honest framing starts here. Williams %R does not predict tops or bottoms on its own. Instead, it flags stretched momentum, and you combine that flag with structure and trend to decide whether it matters.
How Williams %R Is Calculated
The formula is short, and understanding it makes the levels obvious. The tool compares the close with the highest high and lowest low over a lookback window. The steps below show the flow.
- Set the lookback. The default window is 14 bars, the same length many momentum tools use.
- Find the range. The tool records the highest high and the lowest low across those 14 bars.
- Measure the close. It subtracts the current close from the highest high in the window.
- Divide by the range. It splits that gap by the full high-to-low range of the window.
- Scale to 0 and -100. A final step multiplies by -100, which flips the reading upside down.
So the output simply says how far below the recent high the close sits, as a share of the whole range. A close at the top gives a reading near 0. A close at the bottom gives a reading near -100. The midpoint, -50, marks the middle of the range.
Notice what that means for a trending market. When price closes near its highs day after day, %R keeps returning to the zone above -20. When it closes near its lows, the tool keeps returning below -80. So a run of readings at one extreme quietly tells you which side controls the range, long before any single tag matters.
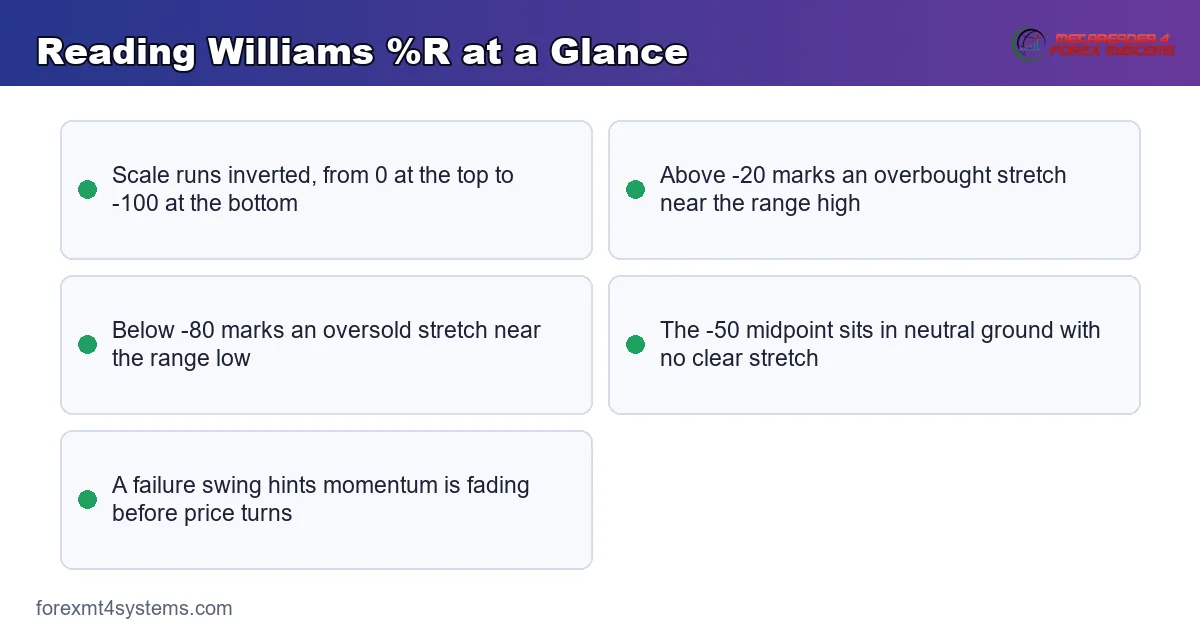
Here is the practical version. When %R holds above -20, buyers dominate the recent range. When it drops below -80, sellers do. The zone between -20 and -80 is neutral ground where momentum has no clear stretch.
Reading the -20 and -80 Levels
The two zones give Williams %R its signals. Each one describes a stretch, not a command to trade.
The Overbought Zone Above -20
A reading above -20 means price closed near the top of its range. So recent momentum favors buyers, and the move may be stretched. In a range, that tag often precedes a pullback. In a strong uptrend, though, %R can hold above -20 for a long stretch while price keeps rising.
So treat the overbought tag as information, not a sell trigger. Then wait for price to confirm, with a level or a momentum failure, before you act against the move.
The Oversold Zone Below -80
A reading below -80 means price closed near the bottom of its range. Hence recent momentum favors sellers, and the move may be stretched to the downside. In a range, that deep tag often precedes a bounce.
Yet the same caution applies in reverse. In a firm downtrend, %R can sit below -80 for many bars while price grinds lower. So the oversold tag alone is never a buy signal without a level or a trend read behind it.
The Failure Swing Cue
There is a subtler signal worth knowing. A failure swing happens when %R reaches an extreme, pulls back into neutral ground, then fails to tag the extreme again on the next push. So that lower peak in overbought, or higher trough in oversold, hints that momentum is fading before price turns.
Williams %R as a Trend Filter
Most traders read %R only for overbought and oversold tags. Larry Williams himself suggested a subtler use, though, that flips the common view. In a strong trend, the tool can hold at an extreme as a sign of strength rather than a warning to fade.
So consider an uptrend. When %R pushes above -20 and stays there, buyers clearly dominate the range. Instead of shorting that stretch, a trend trader treats it as confirmation. Then the trader waits for %R to dip and recover before adding in the trend direction.
The same idea works upside down in a downtrend. There %R can sit below -80 for a long run while price grinds lower. Because the extreme reflects momentum, not exhaustion, fading it fights the trend. So read a pinned oscillator as a message about who controls the tape.
Then blend the two readings deliberately. Use the tags to fade stretches inside a range, and use the pinned extremes to confirm strength inside a trend. Because context decides which rule applies, the higher-timeframe trend read always comes first.
Momentum and Reversal Signals
Williams %R offers more than a simple line crossing a level. It flags shifts in momentum that often lead price. So a careful reader watches how the oscillator moves, not just where it sits.
The clearest cue is a quick reversal out of an extreme. When %R plunges below -80, then snaps back above it within a bar or two, sellers have likely lost their grip. That fast recovery, paired with a level, times many pullback entries in an uptrend.
Divergence adds another layer. When price prints a lower low but %R prints a higher low, downside momentum is fading. So that gap warns of a possible bounce, much as it does on other oscillators. Our guide to divergence in trading covers the pattern in full.
Still, momentum signals need confirmation. A fading reading alone rarely turns a market, so wait for price to close through a level. Then the momentum cue and the structure agree, which gives the entry far more weight.
Choosing the Lookback Length
The default 14-bar window suits most traders, yet the length is worth understanding. A shorter lookback, near 9, watches fewer bars and reacts faster. So it tags the zones more often and suits quick scalps on low timeframes.
A longer lookback, near 21 or 28, does the opposite. It smooths the reading and tags the zones less, so it filters noise and highlights only deeper stretches. Swing traders often favor a longer window for that calmer, cleaner signal.
So match the length to your holding period, just as you would with any oscillator. Then keep the standard -20 and -80 levels unless your own testing shows a clear reason to shift them. Because the length already controls sensitivity, most traders leave the levels alone.
Williams %R Across Timeframes
The oscillator reads the same on every chart, but its pace changes with the bar size. On a five-minute chart, %R tags the zones quickly and often, so it suits active intraday trading. On a daily chart, it moves slowly and marks only the larger swings.
So most traders read two timeframes together. A higher chart sets the trend, and a lower chart times the entry with a %R tag. Because the higher timeframe filters the direction, the lower one can act with more confidence.
Then keep your expectations honest for each speed. A fast chart delivers more tags, and more of them fail. A slow chart delivers fewer, cleaner signals that ask for patience. Match the timeframe to your style, and the tool behaves as you expect.
Where Williams %R Fits Your Workflow
Williams %R works best as a momentum filter inside a larger read, never as a lone trigger. Slot it into a simple routine, and its tags sharpen at once.
First, set your trend on a higher timeframe. Read the four-hour or daily chart, and note the direction of the swings. So you then trade %R tags in the direction of that trend far more often than against it.
Then use the tool for timing on your entry chart. In an uptrend, you wait for %R to dip toward -80 and turn up, which times a pullback entry. Our guide to the stochastic oscillator shows a close cousin you can read the same way.
Also compare it against related oscillators. The oscillators archive collects tools that read momentum, and the overbought and oversold indicators group shows how each marks a stretch. So you can cross-check a %R tag against a second tool before you act.
Finally, record the read so you can improve it. A signal means nothing without a review loop behind it. Our free trade journal logs each tag and outcome, so your personal filter rules sharpen over time.
Worked Example: A Williams %R Pullback Entry
Walk through a full read on EURUSD, step by step. The higher-timeframe trend points up, since the four-hour chart prints a clean run of higher lows.
Now the setup builds on the one-hour chart. Price pulls back into a prior demand area, and Williams %R slides below -80. So both momentum and structure reach a stretch at the same moment, which is the alignment you wait for.
Then the trigger arrives. %R curls back above -80, and price closes above the small swing high that capped the dip. The chart below marks the oversold tag, the turn back through -80, and the entry candle.
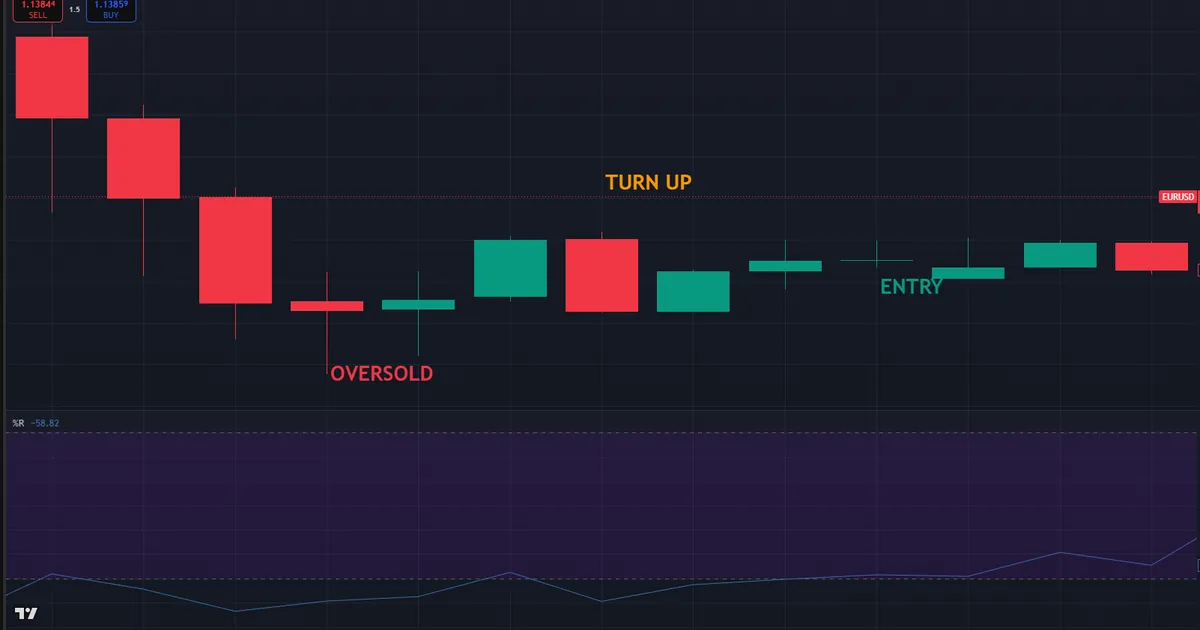
Here the trade defines itself. A long enters on that close, with a stop just below the pullback low. Meanwhile, the first target sits at the prior swing high above, giving a reward that clears the risk. The plan leaned on the tag lining up with the level, not on the exact %R value.
So notice the sequence, because it repeats. Trend first, then an oversold tag with structure, then a turn back through the level to trigger. Because that rhythm travels across pairs and timeframes, learning it once pays off on every chart you read.
Download the complete indicator database
Put these concepts on your charts. One email unlocks the full library of 1,380+ indicators with compiled MT4 and MT5 files, plus my TradingView scripts. No paywall, no spam, unsubscribe any time.
Get free access to my indicator database
One email unlocks 1,380+ free MT4, MT5 and TradingView indicators — the complete library. No single-tool download; you get the whole database.
Williams %R vs the Stochastic Oscillator
The two tools look almost identical, and for good reason. Both measure where the close sits inside a recent range. Yet a few differences matter in practice.
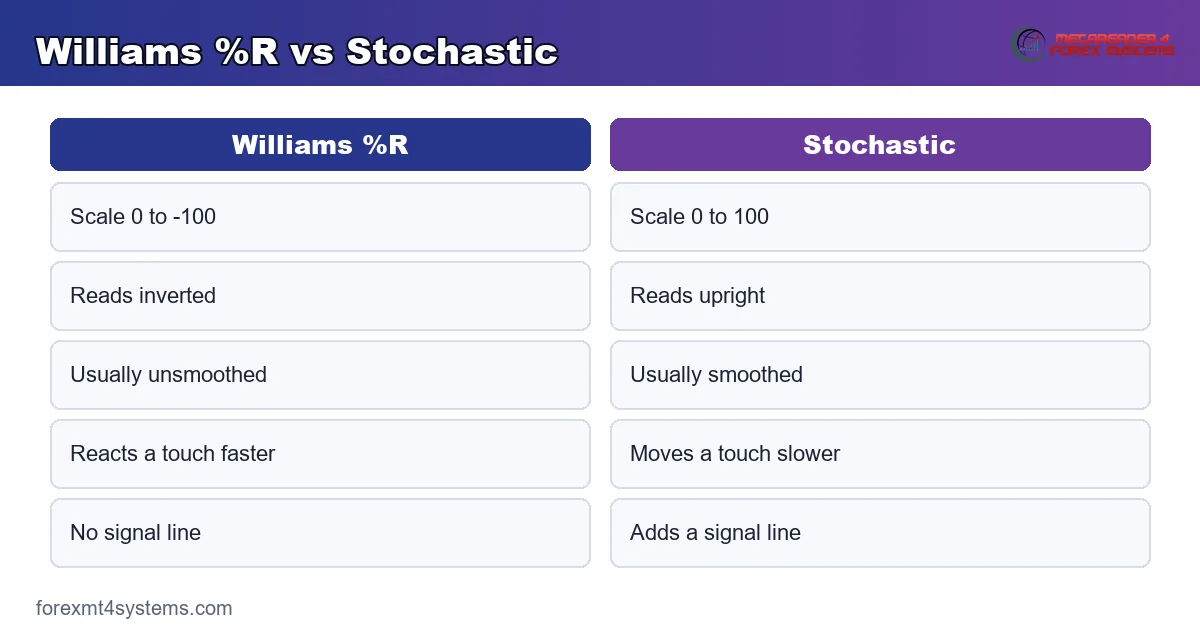
Williams %R runs on an inverted scale from 0 to -100, while the stochastic runs from 0 to 100. So a %R reading of -20 lines up with a stochastic reading near 80. In fact, %R is essentially an upside-down version of the raw stochastic %K line.
The bigger difference is smoothing. The stochastic usually adds a signal line and smooths the raw value, so it moves a touch slower and gives crossover signals. Williams %R, in its standard form, plots the raw value with no smoothing, so it reacts a shade faster and looks jumpier.
So which should you use? Truly, neither is better in every case. Traders who want a faster, rawer read often lean on %R. Those who prefer a smoother line with crossovers tend to pick the stochastic. Many chart both and act only when the two agree.
Common Williams %R Mistakes and Fixes
The tool is simple, yet the same errors repeat. Here are the traps that catch new users most often.
Buying Every Oversold Tag
A reading below -80 is not a buy signal by itself. In a downtrend, %R can stay pinned there for many bars. So use the tag as a warning, then wait for a level or a turn before you act.
Ignoring the Trend
A one-hour oversold tag against a firm daily downtrend usually marks a pause, not a bottom. Hence check the higher-timeframe trend first, and trade tags with that larger direction far more often than against it.
Reading the Scale Backward
The inverted scale confuses many beginners. So remember the rule: near 0 is overbought, near -100 is oversold. Read it upside down compared with RSI, and the signals fall into place.
Using %R as a Standalone System
Momentum alone rarely pays. Instead, %R shines when it confirms a level, a trend, or a failure swing. Our guide to the CCI indicator shows another momentum read you can pair with it. So combine the tools rather than trusting one in isolation.
Pre-Trade Williams %R Checklist
Run this short list before every entry. A few seconds here filters out the weakest tags.
- Higher-timeframe trend read on the four-hour or daily chart.
- A %R tag in the direction of that trend, near -20 for shorts or -80 for longs.
- The tag lined up with a real level or structure, not floating alone.
- A trigger present, such as a turn back through the level.
- A second tool, such as the stochastic, agreeing where possible.
- Stop and target planned before the entry goes live.
When Williams %R Fails
Study the failure case as hard as the winner. Here is the classic one. Price trends down hard, %R drops below -80, and an eager trader buys the oversold tag expecting a bounce.
Then the trend punishes that trade. Price barely pauses, %R stays pinned below -80, and the market grinds lower for another session. The chart below shows that pinned oscillator and the losing long beneath it.
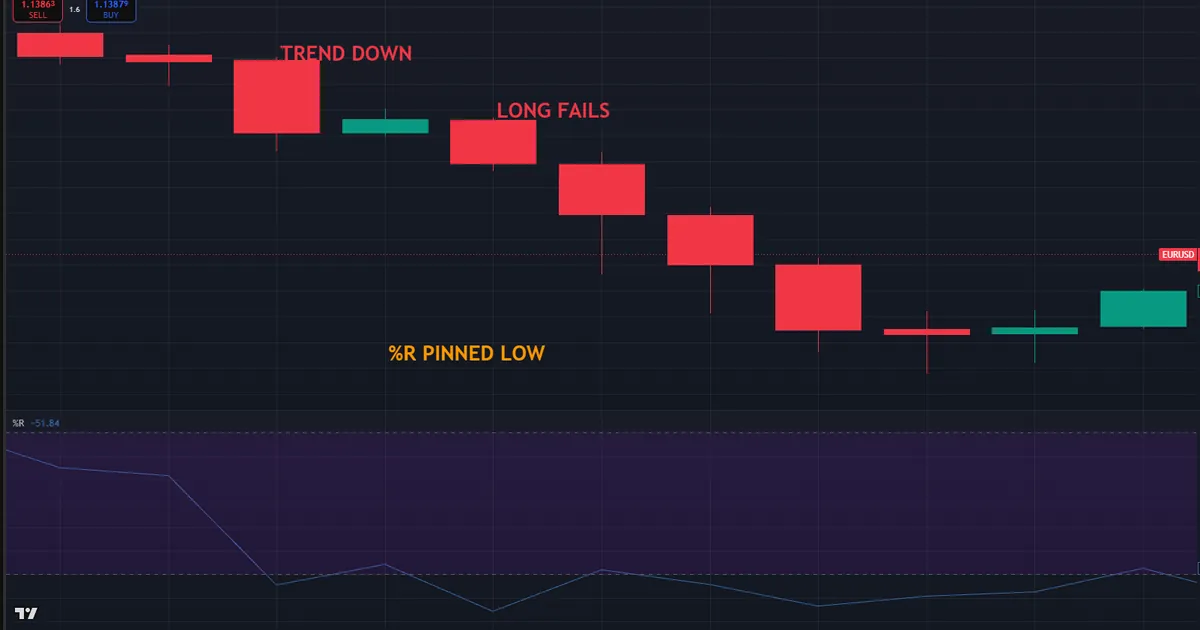
So what went wrong? The tool worked as designed, but the context was ignored. In a strong downtrend, oversold is normal, and the -80 line became a trap rather than a signal. Hence the fix: in a clear trend, trade %R tags only in the trend direction, and let the counter-trend tags pass.
Then log the trade while it stays fresh. Note the pair, the trend, and whether a level backed the tag. Review a few dozen of these, and the pattern appears. Failed tags cluster in strong trends and quiet ranges, exactly where a lone oscillator struggles most.
Choppy Ranges Blur the Zones
Be honest about the hardest condition. In a tight range, %R tags both zones all session, and every signal dies within a few candles. So when the higher timeframe shows a sideways box, lower your size or wait. The tool rewards clear momentum and punishes those who force it inside chop.
Related Concepts to Study Next
Williams %R connects to a web of momentum tools, and a couple deserve your next reading hour. The stochastic oscillator is its closest relative, so study the two side by side. Meanwhile, momentum settings such as RSI settings for day trading deepen the same overbought and oversold logic on a different scale.
For hands-free reading, a well-built Williams %R indicator plots the zones and failure swings for you in real time. Tools speed the work, yet the level reads above still carry the logic. So learn the scale first, then let software handle the watching. Because the tool sits in a broader oscillator family, comparing it against a second momentum read will sharpen your judgment faster than studying it alone.
FAQ
What is Williams %R in simple terms?
Williams %R is a momentum oscillator that shows where the current close sits inside the recent high-to-low range. It runs on an inverted scale from 0 to -100, so a reading near 0 is overbought and a reading near -100 is oversold. It flags stretched momentum rather than predicting exact turns.
What are the standard Williams %R levels?
The standard overbought level is -20, and the standard oversold level is -80, using a 14-bar lookback. A reading above -20 shows price closing near the top of its range, while a reading below -80 shows it closing near the bottom. The zone between them is neutral ground.
How is Williams %R different from the stochastic oscillator?
Both measure where the close sits in a recent range, but the scales are flipped. Williams %R runs from 0 to -100, while the stochastic runs from 0 to 100. The stochastic usually smooths its value and adds a signal line, so %R tends to react a touch faster and look jumpier.
Can Williams %R spot reversals?
Williams %R can hint at reversals through overbought and oversold tags and failure swings. Yet those signals fail often in strong trends, where the tool stays pinned at an extreme. So combine %R tags with trend and structure rather than trading them alone.
What timeframe works best for Williams %R?
Williams %R works on every timeframe, and the choice depends on your style. Day traders read it on the five and fifteen-minute charts, while swing traders use the four-hour and daily. So match the timeframe to your holding period and keep a higher chart for trend context.
Is Williams %R reliable on its own?
No single oscillator delivers an edge in isolation, and %R is no exception. It works best beside a trend read, clear structure, and disciplined risk. Manage risk on every trade. Results are not guaranteed; past performance is not indicative of future results.
External references
- For background on this concept, see Larry R. Williams on Wikipedia.
- For broader market context, see Oscillator at BabyPips Forexpedia.

About the author
Written by Dominic Walsh, a Forex trader and MT4/MT5 indicator, Expert Advisor and script developer. Every tool on forexmt4systems.com is tested on live charts before release and ships with ready-to-use compiled MT4 (.ex4) and MT5 (.ex5) files. Learn more about the trader and developer behind this site.
How we build, test and correct every tool: Editorial & Testing Policy. Trading carries risk; see the disclaimer.