
Understanding what is Fibonacci retracement starts with one simple idea: markets rarely move in a straight line. After a strong push, price usually pulls back part of the way before continuing, and Fibonacci retracement maps the levels where that pullback is most likely to pause.
So what is Fibonacci retracement in practice? It is a set of horizontal levels drawn from a swing low to a swing high, at ratios like 38.2 and 61.8 percent. Traders watch those levels for signs that a pullback is ending and the original trend is ready to resume.
What Is Fibonacci Retracement in Trading
The tool takes its name from Leonardo Fibonacci, a mathematician who popularised a famous number sequence in the thirteenth century. Each number in that sequence is the sum of the two before it. So the run goes one, one, two, three, five, eight, thirteen, and onward.
Divide any number by the one after it and you approach 0.618, the ratio traders call the golden ratio. Other divisions in the sequence produce 0.382 and 0.236. These ratios turn up across nature and design, and technical traders map them onto price swings as potential turning points. So the tool is less about mysticism and more about a shared reference that many traders watch at once.
That shared attention is part of why the levels matter. When enough traders place orders around the same ratio, their combined activity can slow a pullback there. So a Fibonacci level works partly as maths and partly as a self-reinforcing habit across the market.
From Sequence to Chart
Look at a concrete case. The chart shows EURUSD on the four-hour timeframe near 1.1400, with the Fibonacci retracement tool drawn from a swing low up to a swing high. Price rallies, then pulls back into the 61.8 percent level and stalls before turning higher again. That single frame shows the swing, the levels, and the bounce in one clean view.

Now trace the logic from left to right. First price makes a strong upward swing. Then it retraces part of that move, sliding back toward the drawn levels. Because buyers often step in near a Fibonacci ratio, the pullback frequently pauses there before the trend resumes. So the tool framed exactly where the dip was likely to find support.
Why does this matter for real trades? Fibonacci retracement gives you a map of probable levels, not a promise. So a touch of the 61.8 level is a place to watch closely, not an automatic buy. Read the context first, and the levels become useful reference points rather than magic lines.
The Fibonacci Retracement Levels
The tool plots a fixed set of ratios between two swing points. Learn them once and they appear on every chart the same way. Five levels do most of the work.
- 23.6 percent. The shallowest level, often seen in very strong trends where pullbacks stay tiny.
- 38.2 percent. A common pause in a healthy trend, where the first meaningful dip often ends.
- 50 percent. Not a true Fibonacci ratio, yet widely watched as the midpoint of the whole swing.
- 61.8 percent. The golden ratio, and the level many traders treat as the last line of defence for a trend.
- 78.6 percent. A deep retracement, where a much larger pullback often makes its final stand.
So the levels are simply percentages of the original move. The tool measures the full distance from swing low to swing high, then marks each ratio along the way. The concept graphic below shows those levels stacked between the two swing points.
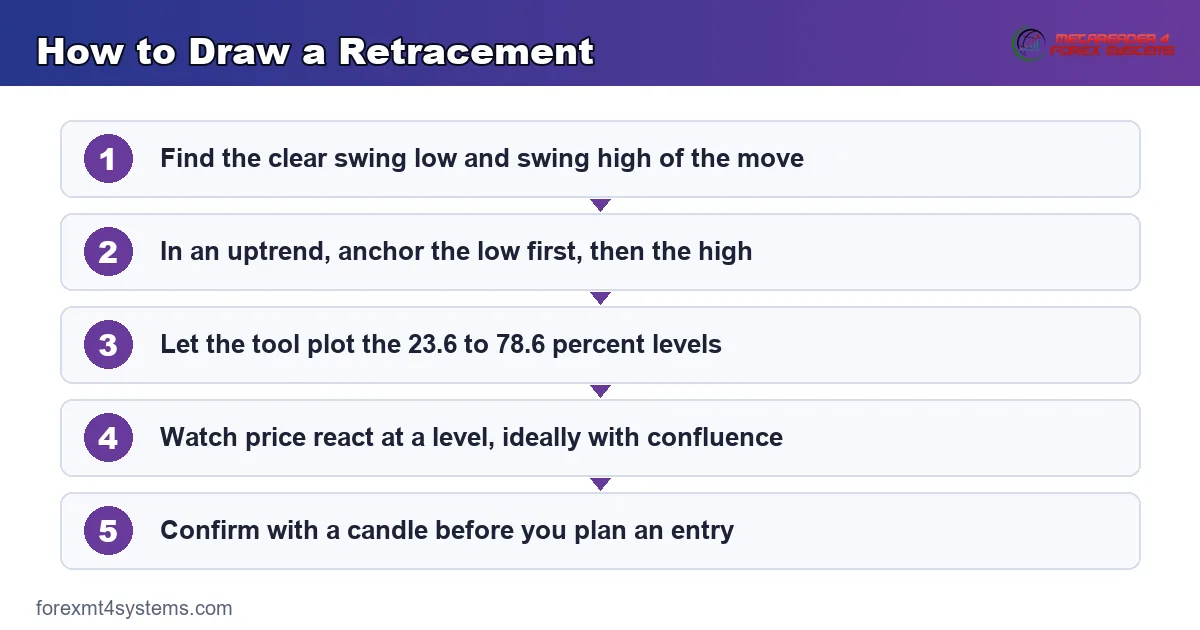
Because the 50 and 61.8 levels sit in the middle of a swing, they draw the most attention. A shallow pullback to 38.2 signals a very strong trend. A deep pullback to 78.6 warns the move may be in trouble. So the depth of the retracement itself tells you something about the health of the trend.
Why 61.8 Gets the Most Attention
The golden ratio has a special place in the sequence. As the Fibonacci numbers grow, the ratio between neighbours settles ever closer to 0.618. So 61.8 percent is the mathematical heart of the tool rather than a rounded guess.
Traders treat it as a decision zone. A pullback that holds above 61.8 keeps the trend intact, while a break below it hints the move may be reversing. So many entries cluster around that level, which can add to its pull. Still, it is a zone to watch, not a promised bounce.
The Fifty Percent Level
The 50 percent level is not a Fibonacci ratio at all, yet it survives on tradition. Charles Dow noted that markets often retrace about half of a prior move before continuing. So the level earns its place by observation rather than by the sequence.
Because it sits exactly halfway, it is easy to spot and widely respected. A pullback that stalls near 50 percent often marks a balanced, orderly trend. So keep it on the chart even though the math behind it differs from the true ratios.
How to Draw Fibonacci Retracement
Drawing the tool correctly is where most of the skill lives. Get the swing points wrong and the levels lose all meaning. So take care with the two anchors before you read anything.
In an uptrend, click the swing low first, then drag up to the swing high. The tool fills in the ratios between them. In a downtrend, reverse it: click the swing high first, then drag down to the swing low. Because the direction sets where the levels fall, the order of the clicks matters.
Choosing the Right Swing Points
The best anchors are clear, obvious turning points. Use the major swing low that launched the move and the major swing high that ended it. So skip the tiny wiggles and anchor to the pivots that stand out on the chart.
Because different traders may pick slightly different swings, the levels are zones rather than exact prices. So treat each ratio as a small band, not a razor line. A reaction a few pips either side of the 61.8 level still counts as a response to that zone.
Using the TradingView Drawing Tool
On most platforms the tool sits in the drawing menu as the Fibonacci Retracement. Select it, then click the two swing points in the right order. The levels appear at once, labelled with their ratios and prices.
So the software does the arithmetic for you. Still, you can check the exact prices by hand when planning a trade, and our free Fibonacci calculator works out each level from your two swing values. That cross-check keeps your levels honest when the chart feels crowded.
Settings, Timeframes, and Pairing
The default level set of 23.6, 38.2, 50, 61.8, and 78.6 suits most charts, and I would keep it before adding anything. The timeframe you draw on shapes how much weight a level carries. So match the swing you anchor to the trade you plan.
A retracement drawn on the daily chart carries more weight than one on the five-minute chart. Because higher timeframes gather more participants, their levels tend to hold better. So a swing trader anchors to daily swings, while a day trader uses the four-hour and one-hour pivots.
Pairing Fibonacci With Structure
Fibonacci levels read best beside real support and resistance. A 61.8 retracement that lands right on a prior support shelf carries far more weight than one floating in open space. So let structure confirm the level before you trust it.
When several tools agree, the zone gets stronger. A Fibonacci level, a round number, and a prior swing stacked together form a confluence zone. So look for those overlaps, because a level backed by more than one reason tends to hold more reliably.
Adding Fibonacci Extensions
Extensions add another layer once a pullback ends. The same sequence produces levels beyond the swing, such as 127.2 and 161.8 percent, which project where a resumed trend might reach. So retracements frame the entry while extensions frame the target, and the two tools work as a pair.
Because the projections come from the same ratios, they carry the same caution. An extension marks a probable area, not a fixed exit. So use it to set a first target, then let price action decide whether to bank the trade or ride it further.
Confirming With Price Action
A level alone is only half a signal. Wait for price to show a reaction there before you act. So a rejection candle, a small double bottom, or a momentum shift at the level turns a watch zone into a trade.
Because price can slice straight through any level, confirmation protects you from guessing. So the rule is patience: let the market prove the level is holding, then enter with a stop just beyond it. That habit keeps you out of the retracements that fail.
Worked Example: A Retracement Entry on EURUSD
Picture EURUSD rallying from a swing low near 1.1325 up to a swing high near 1.1473 on the four-hour chart. The trend is clearly up, and the move looks strong. Then price begins to pull back, and you draw the Fibonacci tool from the low to the high.
Now the levels appear. The 61.8 retracement lands near 1.1382, and it sits close to a prior support shelf from the earlier climb. That overlap forms a confluence zone worth watching. The chart below marks the swing points, the 61.8 level, and the support shelf beneath it.

Then price arrives and reacts. A firm bullish rejection candle prints right at the 61.8 zone, showing buyers defending the level. So a long on the close of that candle carries a stop just below the shelf, roughly 30 pips of risk near 1.1352. The entry rests on the level and the reaction together.
The follow-through rewarded the read. Price turned off the 61.8 zone, reclaimed the mid-levels, and pushed back toward the prior high within a couple of sessions. So the retracement gave a clean entry near the deepest sensible pullback. That is the tool doing its job as a map.
Why the Entry Made Sense
Notice how each piece supported the next. First the strong swing set the direction. Then the 61.8 level marked the deepest sensible pullback. Finally the rejection candle at a support shelf confirmed the bounce. Because three reasons stacked together, the trade rested on evidence rather than hope.
Compare that with a blind dip-buy. Without the tool, the same pullback offers no reference for where to enter or where to hide the stop. Because the Fibonacci level framed both, the trader could act with a clear invalidation point. So the map turned a vague dip into a defined setup.
Download the complete indicator database
Put these concepts on your charts. One email unlocks the full library of 1,380+ indicators with compiled MT4 and MT5 files, plus my TradingView scripts. No paywall, no spam, unsubscribe any time.
Get free access to my indicator database
One email unlocks 1,380+ free MT4, MT5 and TradingView indicators — the complete library. No single-tool download; you get the whole database.
Common Fibonacci Mistakes and How to Fix Them
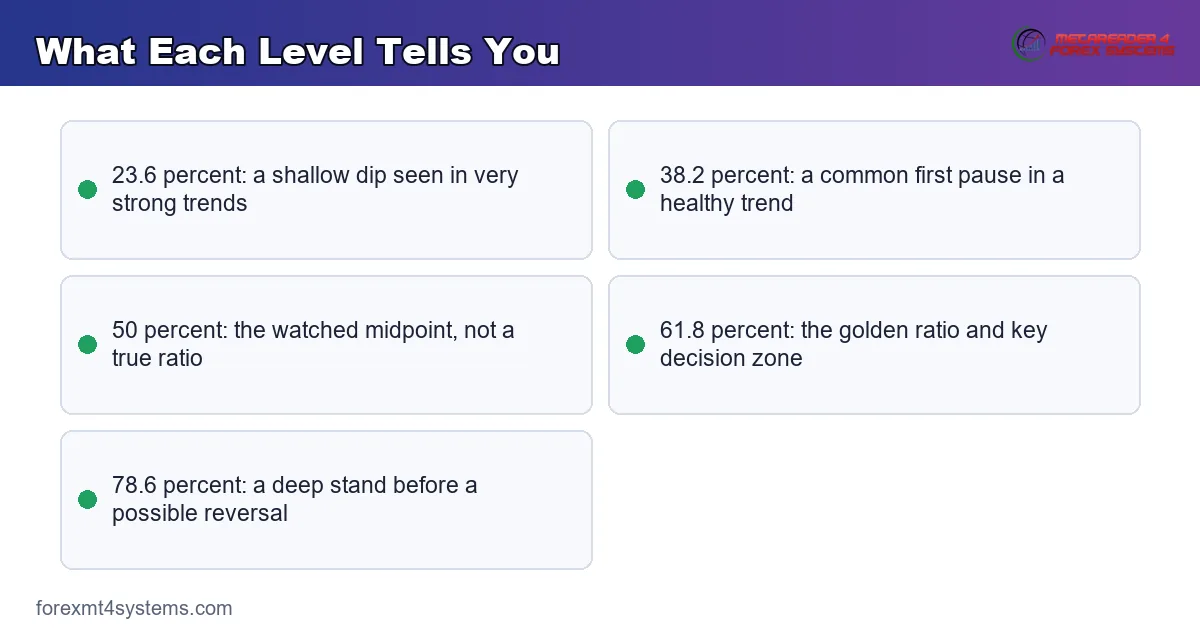
The tool is simple, yet the same errors repeat on every timeframe. Most trace back to sloppy drawing or blind faith in a level, shown in the graphic below. So the fixes all flow from careful anchoring and patient confirmation.
Anchoring to the Wrong Swings
Drawing from a minor wiggle instead of the real swing throws every level off. The ratios only mean something when the anchors are the true pivots. So use the obvious swing low and swing high that framed the move, and skip the noise between them.
Treating Levels as Exact Prices
A Fibonacci level is a zone, not a razor line. Expecting a bounce to the exact pip invites frustration. So read each ratio as a small band and allow price a little room around it before you judge the reaction.
Trading Levels Without Confirmation
A level alone is only a place to watch. Buying the moment price touches 61.8 ignores whether buyers actually showed up. So wait for a rejection candle or a momentum shift before you commit, and let price prove the level is holding.
Ignoring the Bigger Trend
Fibonacci works best in the direction of the larger trend. Fading a strong move because price reached a level fights the current. So draw retracements to trade pullbacks within a trend, not to guess reversals against it.
Forcing the Tool on Every Chart
Not every market has a clean swing to measure. In choppy, directionless price, the levels mean little. So reserve the tool for charts with an obvious impulse and pullback, and stand aside when the structure is a mess.
Drawing Too Many Retracements
Stacking five retracements from different swings clutters the chart into noise. Every level starts to look important, so none of them are. So keep one clean retracement from the swing that matters, and remove the rest.
Fibonacci Retracement Checklist
Run this short list before every entry. A few seconds here saves hours of regret later. So keep it beside the chart and let it slow your hand whenever a tempting level appears out of nowhere.
- A clear impulse move with obvious swing points.
- The tool anchored low-to-high or high-to-low correctly.
- The larger trend read on a higher timeframe.
- A key level, ideally with confluence, identified.
- A price-action reaction confirmed at the level.
- Stop placed just beyond the level, with size set from it.
- Entry, stop, and target defined before the trade goes live.
When Fibonacci Retracement Fails
Study the failure case as hard as the winner. Here is a common one. GBPUSD rallies from about 1.3389 to 1.3558 on the one-hour chart, then pulls back and reaches the 61.8 level cleanly. Every box looks ticked for a long.
Then the level gives way. Price slices straight through 61.8, then through 78.6, and keeps falling past the original swing low. The chart below shows that broken level and the failed retracement.
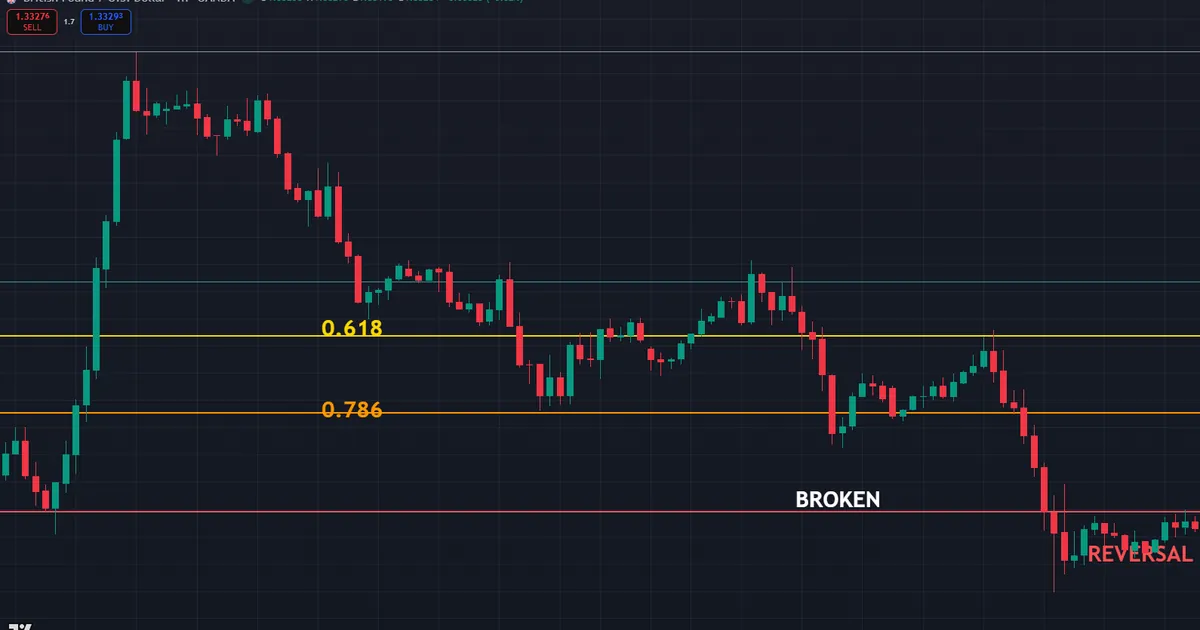
So what went wrong? Usually the trend had already turned. A retracement that runs deeper than 78.6 and breaks the swing low is no longer a pullback. It is a full reversal. Hence the invalidation rule that limits the damage: once price closes clearly below the swing that started the move, the retracement idea is dead. Exit at once, without hoping for a bounce.
Deep Breaks Signal Reversals
A pullback beyond 78.6 is a warning, not a bargain. The deeper price retraces, the weaker the original trend looks. So a break past that level and the swing low often marks a genuine change in direction, not a dip to buy.
News Overrides the Levels
A high-impact release can send price straight through every Fibonacci level in one candle. The tool measures past structure, so it cannot price in a fresh shock. So a level right after major news often fails, and a wait for the dust to settle protects you.
Sizing Keeps a Bad Read Small
Even a clean-looking level can break, so plan for it. Because a failed retracement reverses against you fast, a stop just beyond the level caps the damage. Our free position size calculator turns that stop distance into a lot size that keeps each loss controlled. So a broken level stays a scratch rather than a wound.
Related Concepts to Study Next
Fibonacci retracement connects to a web of sibling tools, and a couple deserve your next reading hour. The natural next step is applying it, so our guide to how to use Fibonacci retracement walks through the entries in detail. Then structure underpins every level, so our guide to support and resistance shows why levels backed by memory hold better.
Other reference levels pair well with Fibonacci too. Because pivots and Fibonacci ratios often overlap, our guide to pivot points covers another map of likely turning points. So stacking these tools builds the confluence zones that tend to hold.
For hands-free charting, the Fibonacci indicators archive plots retracements and extensions automatically across your charts. Tools speed the work, yet the drawing logic above still decides whether a level means anything.
FAQ
What is Fibonacci retracement used for?
It maps the levels where a pullback within a trend is most likely to pause before the move resumes. Traders draw it from a swing low to a swing high, then watch ratios like 38.2 and 61.8 percent. The levels act as a map of probable support and resistance, not a certainty.
What are the main Fibonacci retracement levels?
The standard levels are 23.6, 38.2, 50, 61.8, and 78.6 percent. The 61.8 golden ratio and the 50 percent midpoint draw the most attention. A shallow pullback to 38.2 signals a strong trend, while a deep one to 78.6 warns the move may be weakening. So the depth of the retracement itself hints at how healthy the underlying trend really is.
How do I draw Fibonacci retracement correctly?
In an uptrend, click the major swing low first, then drag to the swing high. In a downtrend, reverse the order. Anchor to obvious pivots rather than tiny wiggles, and treat each resulting level as a small zone rather than an exact price. Because the tool does the arithmetic, your only real job is choosing the two swing points with care, and the levels follow from there.
Is the 50 percent level a real Fibonacci ratio?
No, 50 percent is not part of the Fibonacci sequence. It survives on tradition, because markets often retrace about half of a prior move. Many traders keep it on the chart anyway, since a pause near the midpoint often marks an orderly trend. So it earns its spot through observation rather than through the sequence itself.
Does Fibonacci retracement work in forex?
It does, especially on liquid pairs with clear swings on the higher timeframes. The levels read best beside real support and resistance and with price-action confirmation. Favour trades in the direction of the larger trend rather than fading it at a level, and give each zone a little room instead of expecting an exact-pip reaction.
Is Fibonacci retracement reliable on its own?
The tool maps probable levels, not certain turns, so it reads best beside other reads. Pair it with structure, trend, and price-action confirmation for cleaner signals. Manage risk on every trade. Results are not guaranteed; past performance is not indicative of future results.
External references
- For background on this concept, see Fibonacci Retracement at Corporate Finance Institute.
- For broader market context, see Fibonacci Extension at BabyPips.

About the author
Written by Dominic Walsh, a Forex trader and MT4/MT5 indicator, Expert Advisor and script developer. Every tool on forexmt4systems.com is tested on live charts before release and ships with ready-to-use compiled MT4 (.ex4) and MT5 (.ex5) files. Learn more about the trader and developer behind this site.
How we build, test and correct every tool: Editorial & Testing Policy. Trading carries risk; see the disclaimer.