
So what is CCI indicator trading really about, and why do so many momentum traders keep it pinned under the price? The Commodity Channel Index, or CCI, measures how far the current price sits from its recent average, then scales that gap into a line that swings around a zero level. After this guide you will read a CCI(20) line with confidence, mark the plus and minus 100 bands, and turn a zero-line cross or a divergence into a plan you can act on.
Understanding what is CCI indicator behaviour also keeps you honest about its two faces. In a range it fades extremes, and in a trend it confirms strength. Read the context first, and the same line tells two very different stories that both make sense.
What Is CCI Indicator Reading on the Chart
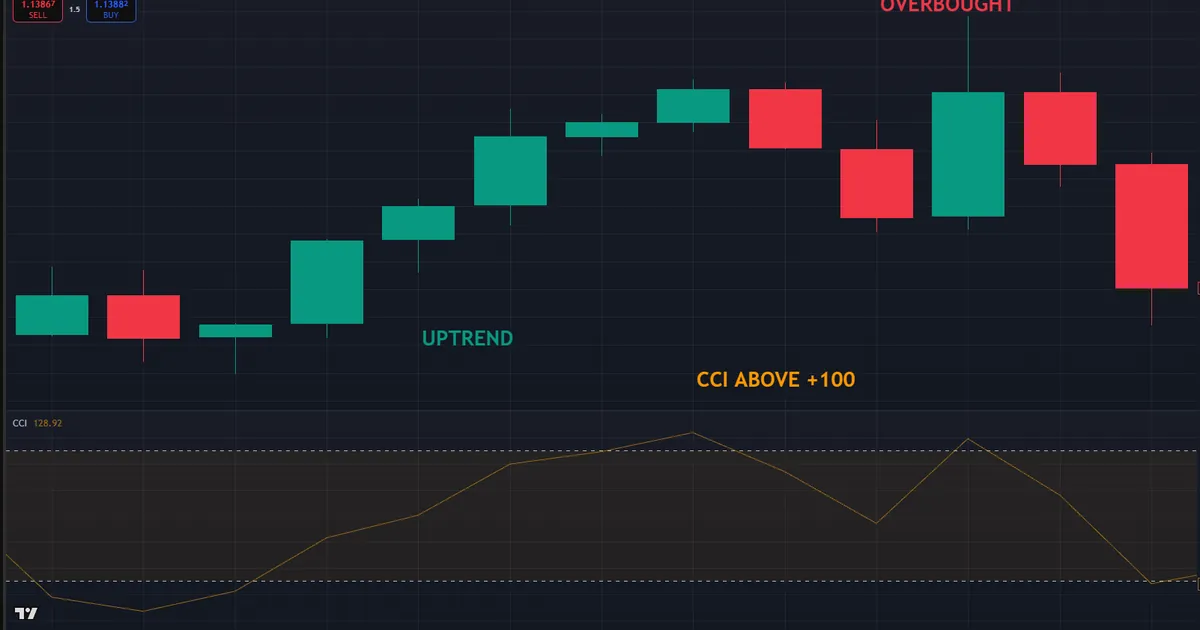
Donald Lambert built the CCI in 1980 to spot cyclical turns in commodities, though traders now use it on every market. The line has no fixed ceiling, so it can push past 100, 200, or more when momentum runs hot. Most of the time, though, it oscillates inside a band from minus 100 to plus 100. The chart below shows a EURUSD 1-hour reading with the CCI(20) holding above the plus 100 line during a clean push higher.
Three Levels That Anchor the Line
Start with three horizontal levels, because they frame everything the line does. Its zero line marks the average price, so a cross above it hints at building upside momentum. The plus 100 level flags an overbought stretch where price has run well above its mean. A minus 100 level flags the oversold mirror. So a reading near plus 120 tells you buyers have pushed hard and fast, while a dip toward minus 150 says sellers have done the same.
Notice how the picture reads at a glance. Above zero leans bullish, below zero leans bearish, and the plus or minus 100 bands mark the zones where momentum looks stretched. That simple map is why the CCI earns a permanent slot in so many momentum toolkits.
Why the Line Can Break Past 100
The CCI is an unbounded oscillator, and that trait matters. Its formula divides the price gap by the average deviation, then multiplies by a constant that keeps roughly three-quarters of readings inside the bands. Yet a strong trend can hold the line above plus 100 for many bars in a row. So the plus 100 band is not a hard ceiling. Treat it as a threshold that says momentum is strong, not as a promise that price must turn.
How the CCI Indicator Works
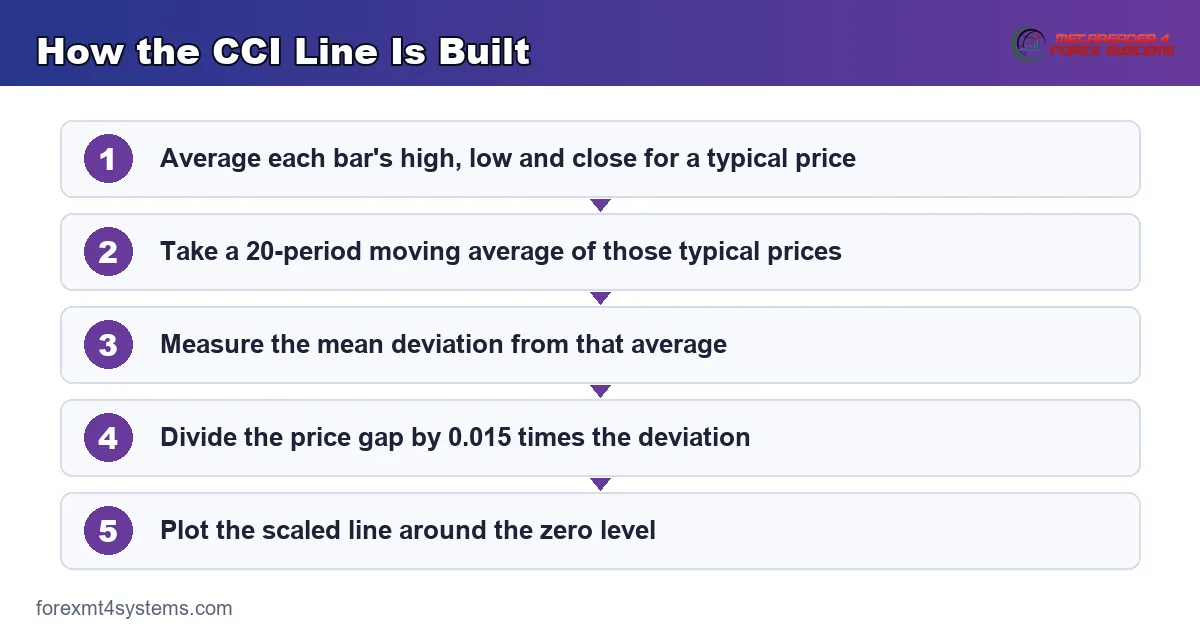
The math behind the CCI is simpler than it looks, and knowing it sharpens your read. Each bar the platform builds a typical price, compares it to a moving average, and scales the difference by how noisy recent prices have been. The steps below spell out the full calculation for a 20-period setting.
- First, find the typical price of each bar by averaging its high, low, and close.
- Next, take a 20-period simple moving average of those typical prices.
- Then measure the mean deviation, the average distance between each typical price and that moving average.
- Now subtract the moving average from the current typical price to get the raw gap.
- Last, divide that gap by 0.015 times the mean deviation, which scales the result into the familiar band.
The 0.015 constant does the quiet work here. Lambert chose it so that most readings land between minus 100 and plus 100, which turns the bands into meaningful markers rather than random lines. Because the divisor tracks recent volatility, the CCI adapts as conditions change. So a calm market and a wild market both produce readings on the same scale, which makes the plus and minus 100 levels comparable across time.
Reading Momentum Rather Than Price
Keep one distinction front of mind: the CCI measures momentum, not price direction on its own. A rising line means price is accelerating away from its average, and a falling line means that gap is shrinking. So the line can turn down while price still climbs, which is the early warning that a move is losing steam. That gap between what price does and what momentum does is exactly what makes the CCI useful. Read the two together, and the oscillator often hints at a stall before the candles admit it.
How Fast the Line Reacts
Speed depends on the length you choose, so it pays to feel the trade-off. A shorter period follows every twitch and fires more signals, many of them noise. A longer period smooths the line and cuts false alarms, yet it lags the turn. The standard 20 sits in a sensible middle, quick enough to catch cyclical swings without chasing every wick. Test a length on a few weeks of your own chart before you trust it, and judge it by how cleanly it marks the turns you care about.
The first graphic below breaks the calculation into its plain-language flow, from typical price to the scaled line you watch on screen.
Where the CCI Indicator Fits Your Workflow
The CCI is a momentum lens, not a standalone system, so give it a job. Most traders run the standard CCI(20) and only change it with a clear reason. A shorter length, such as 14, reacts faster and suits scalping, while a longer length, such as 34 or 50, smooths the line for swing work. Pick one length, learn its rhythm, and resist the urge to tune it every session.
Choosing a Timeframe and a Reading Style
Match the timeframe to your plan before anything else. Intraday traders often read the CCI on the 5-minute and 15-minute charts, while swing traders lean on the 1-hour and 4-hour. Then decide which of the two classic readings you want. The reversal style fades a stretched reading back toward zero. The trend style, closer to Lambert’s original intent, buys when the line pushes above plus 100 and treats that as a breakout of momentum.
Pairing the CCI With Structure
The CCI works best when a second layer confirms it. Read the trend from price structure or a moving average first, then use the CCI for timing inside that bias. So in an uptrend you might wait for the line to dip under minus 100 and turn back up, buying the pullback rather than fading strength. The oscillator times the entry, and the structure picks the direction. That division of labour keeps you from fading a trend that has plenty of room left.
Reading a Zero-Line Cross
The zero line deserves its own habit, because it often moves before the bands do. When the CCI climbs from below zero and crosses above it, momentum has flipped from falling to rising, which can precede a fresh leg up. A cross back under zero warns of the opposite. Yet a zero cross alone is a weak trigger on its own. So pair it with a price level, a swing break, or a candle pattern before you act. Used that way, the cross gives an early nudge while structure supplies the confirmation, and the two together beat either signal read in isolation.
For a wider view of momentum tools, the oscillator indicators hub groups the CCI with its cousins. If you focus on stretched readings specifically, the overbought and oversold indicators archive collects the tools that flag those zones.
Two Ways to Trade a CCI Signal
The CCI supports two reading styles, and confusing them is where most trouble starts. Decide which one you are running before the trade, because they point in opposite directions at the very same reading. One fades the extreme, and the other rides it.
The Reversal Reading
The reversal style suits ranges and tired trends. Here a push below minus 100 flags an oversold market, and a curl back above the line signals the fade is ready to buy. The mirror sells a stretched reading above plus 100 that rolls back under it. So the trigger is always the re-entry into the band, never the first touch. That extra step filters out the readings that keep stretching while you sit on the wrong side.
The Trend Reading
The trend style matches Lambert’s original intent, and it flips the logic. Here a push above plus 100 is a breakout of momentum, so it invites a buy rather than a fade. Price has broken from its recent average with force, and the reading confirms that strength. Traders who use this style only fade a reading once it agrees with a lower high or a divergence. Pick the style that fits the market in front of you, and never fade a fresh breakout by mistake.
Worked Example: A CCI Pullback Buy on GBPUSD
Rules feel abstract until a real chart prices them, so walk through one. The chart below tracks a GBPUSD 1-hour sequence where the trend points up and the CCI times a pullback entry off a swing low.
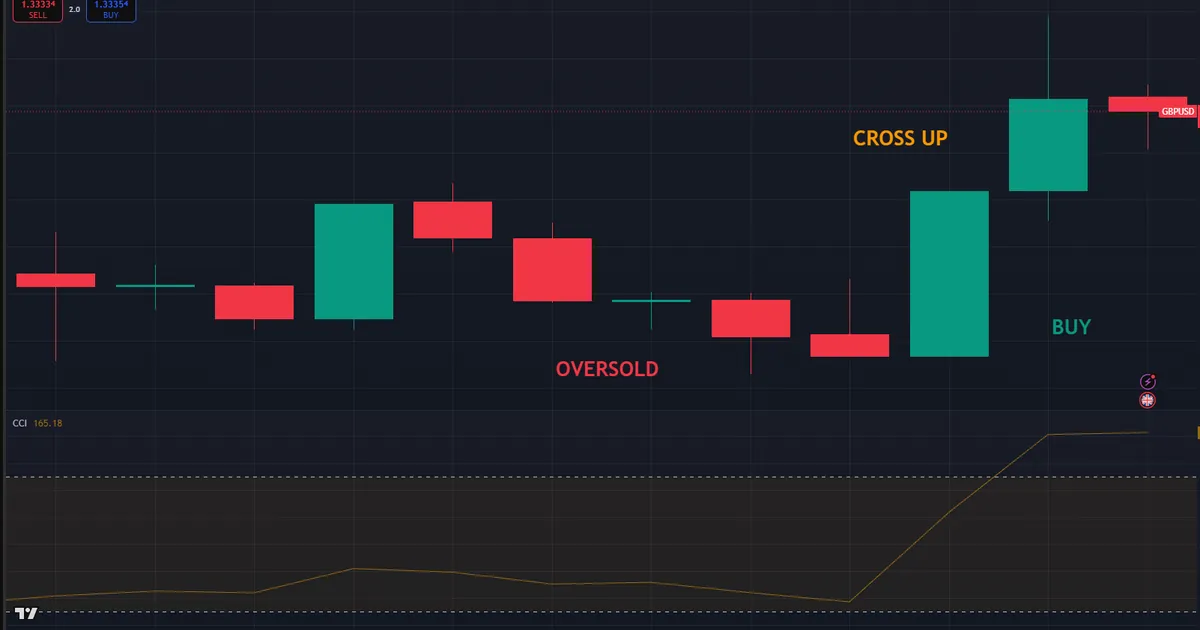
- First, the bias: price printed higher highs and higher lows, so the plan only looked for longs.
- Next, the dip: a routine pullback dragged the CCI down through the minus 100 line into oversold.
- Then the turn: the line curled up and crossed back above minus 100 as price held a prior swing low.
- The confirmation: the next bar closed strong, and the CCI pushed back toward the zero line.
- Last, the trade: buy the reclaim, stop below the prior swing low, and target the recent high.
The logic behind the entry matters more than the exact prices. A trending market breathes, and each pullback pushes the CCI into oversold without ending the trend. So the reclaim of minus 100 signals that the pullback has run its course and the trend is ready to resume. The stop sits below structure, the target sits at the prior high, and the reward clears the risk by a comfortable margin.
Notice the discipline the reading enforces. Without the oversold dip and the reclaim, the same long would be a guess. That single filter, waiting for the line to leave and re-enter the band, turns a hopeful dip-buy into a timed entry with a clear invalidation point.
Managing the GBPUSD Trade
Manage the position with the same map that framed the entry. Many traders bank a partial as price reclaims the recent swing high, slide the stop to breakeven, then let the rest run while the CCI stays above zero. Others exit fully once the line stretches back above plus 100, taking the momentum spike as their signal to leave. Choose one plan before entry and write it down. The oscillator hands you the timing, and your journal keeps you honest about whether you followed it. So the trade becomes a repeatable process rather than a one-off guess you can never review.
Download the complete indicator database
Put these concepts on your charts. One email unlocks the full library of 1,380+ indicators with compiled MT4 and MT5 files, plus my TradingView scripts. No paywall, no spam, unsubscribe any time.
Get free access to my indicator database
One email unlocks 1,380+ free MT4, MT5 and TradingView indicators — the complete library. No single-tool download; you get the whole database.
Common CCI Indicator Mistakes and Their Fixes
CCI errors trap more traders than entry errors, and a handful show up in almost every beginner journal. Most come from treating a stretched reading as an automatic reversal. Each mistake below carries a plain fix you can apply on the very next chart.
- Shorting every push above plus 100. Fix: in a strong uptrend, an extended reading confirms momentum, so wait for a lower high or a divergence before fading it.
- Ignoring the trend entirely. Fix: read direction from structure first, then use the CCI only for timing inside that bias.
- Retuning the length every session. Fix: keep the standard 20 setting long enough to learn how your pair behaves.
- Trading the CCI on one timeframe alone. Fix: confirm the higher-timeframe trend so a signal agrees with the larger picture.
- Treating a zero-line cross as a full signal. Fix: use the cross as context, and pair it with a level or a candle pattern.
- Forgetting the line is unbounded. Fix: expect readings past 200 in fast moves, and never assume plus 100 is a hard cap.
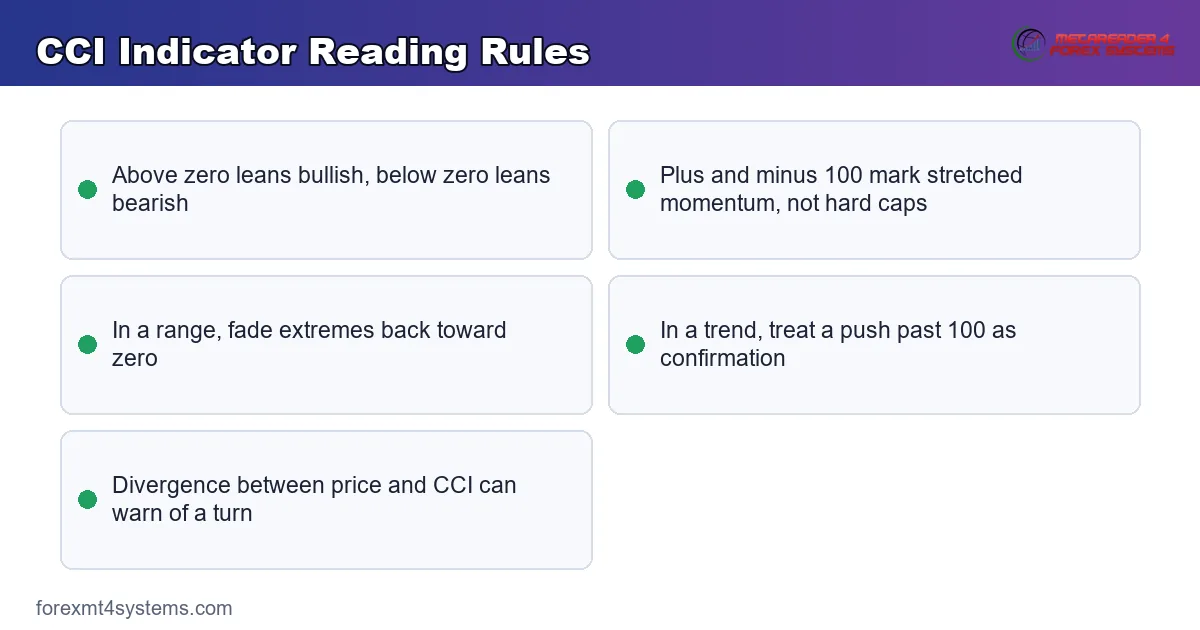
The second graphic pairs the core reading rules with the traps, so a quick glance before you commit keeps the common errors fresh.
A CCI Indicator Pre-Trade Checklist
Run these seven lines before any entry that leans on the CCI. A single failure sends the setup back to the watchlist.
- The higher-timeframe trend is clear, and the planned trade agrees with it.
- The CCI(20) has reached a meaningful extreme rather than a shallow wobble.
- A reversal trade waits for the line to leave and re-enter the band, not just touch it.
- A trend trade uses a push past plus or minus 100 as confirmation, not a reason to fade.
- A price level, swing point, or candle pattern backs the CCI signal.
- The stop sits beyond the structure that would invalidate the idea.
- The target offers more than the risk, and the journal line is written before entry.
Also score a month of trades against this list. The line you skip most often is your real leak, and fixing one leak beats collecting three new indicators.
When the CCI Indicator Fails
The CCI breaks down in strong, one-way trends, and honesty about that saves money. When price grinds higher for hours, the line can sit above plus 100 the entire time. So a reversal trader who shorts each new extreme gets stopped out again and again while the trend rolls on. The oscillator is doing its job, flagging strong momentum, yet the fade reading is simply wrong for the conditions.
Whipsaw is the other trap. In a choppy, directionless market the CCI darts across zero and pokes both bands, firing signal after signal that leads nowhere. Hence a filter matters. Skip CCI signals when price is stuck in a tight, messy range, and wait for a cleaner trend or a clean range to return.
A Failure Walkthrough on EURUSD
One failure repeats more than the rest, and the chart below shows it. EURUSD sells off hard, and the CCI drops under minus 100 into deep oversold. A trader buys the extreme, expecting the usual bounce back toward zero. Yet the trend is too strong, no reclaim prints, and price keeps sliding.

Resolution comes fast and teaches a clear lesson. The oversold reading never turned into a reclaim of the minus 100 line, so the entry fought a live downtrend. Thus the rule stays simple: in a strong trend, wait for the line to re-enter the band before you fade it, and treat a stuck extreme as confirmation of strength rather than a signal to reverse. That patience filters out most of these one-way traps before they touch your account. Log every fade that failed this way, and a pattern soon appears: the losers almost always came in a strong trend with no reclaim, while the winners waited for the line to step back inside the band first.
Related Concepts to Study Next
The CCI connects to several ideas worth learning together. The stochastic oscillator guide covers another momentum tool that reads overbought and oversold in a bounded 0 to 100 range, which makes a useful contrast with the unbounded CCI. Then the Williams %R guide shows a related extreme-reading oscillator built on a different scale. For the pattern that often precedes a real turn, the divergence guide explains how price and the CCI can disagree before a reversal.
Momentum readings also work better when you size positions with a cool head. The forex volatility calculator helps you scale risk to recent range, so a stretched CCI reading never tempts you into an oversized trade. For a faster momentum tweak on the same family, the day-trading RSI settings guide shows how shorter lengths change an oscillator’s behaviour.
FAQ
What is the CCI indicator in simple terms?
The CCI, or Commodity Channel Index, measures how far price has moved from its recent average and scales that gap into a line around zero. Readings above plus 100 flag strong upside momentum, and readings below minus 100 flag strong downside momentum. Traders use it to time entries and to spot when a move looks stretched.
What is the best CCI setting?
The standard setting is a 20-period CCI, and it suits most traders on most timeframes. A shorter length near 14 reacts faster for scalping, while a longer length near 34 or 50 smooths the line for swing trading. No single number fits every market, so keep one setting long enough to learn its rhythm before you change it.
Is a CCI reading above 100 a sell signal?
Not by itself. A push above plus 100 shows strong momentum, and in a trending market it often confirms strength rather than warning of a reversal. Fading every extreme in a strong trend is a common way to lose. Wait for a lower high, a divergence, or a break of structure before you treat a stretched reading as a turn.
How is the CCI different from the RSI?
Both measure momentum, but their scales differ. The RSI is bounded between 0 and 100, so it never leaves its range. The CCI is unbounded, so it can push far past plus or minus 100 when momentum runs hot. That difference makes the CCI quicker to flag powerful trends, while the RSI gives a steadier, capped reading.
Can the CCI be used for divergence?
Yes, and divergence is one of its stronger uses. When price makes a higher high but the CCI makes a lower high, momentum is fading even as price climbs, which can warn of a turn. The mirror holds for lows. Traders combine that divergence with a structure break or a level to confirm the reversal before acting.
Does the CCI work on all markets and timeframes?
The CCI reads momentum on any market with price data, from forex to indices to metals, and on any timeframe. Yet each market and timeframe swings at its own pace, so the same plus 100 reading means different things on a 5-minute chart and a daily chart. Test the tool on your instrument and timeframe first. Results are not guaranteed; past performance is not indicative of future results.
External references
- For background on this concept, see Commodity Channel Index at Investopedia.
- For broader market context, see Commodity Channel Index at BabyPips Forexpedia.

About the author
Written by Dominic Walsh, a Forex trader and MT4/MT5 indicator, Expert Advisor and script developer. Every tool on forexmt4systems.com is tested on live charts before release and ships with ready-to-use compiled MT4 (.ex4) and MT5 (.ex5) files. Learn more about the trader and developer behind this site.
How we build, test and correct every tool: Editorial & Testing Policy. Trading carries risk; see the disclaimer.