
Two stages sit between an idea and a funded account. Traders often treat them as rivals when they answer completely different questions.
Backtesting vs forward testing is not a choice. One replays history at speed to see whether a rule ever had a chance; the other runs the frozen rule on prices that have not printed yet and prices in reality.
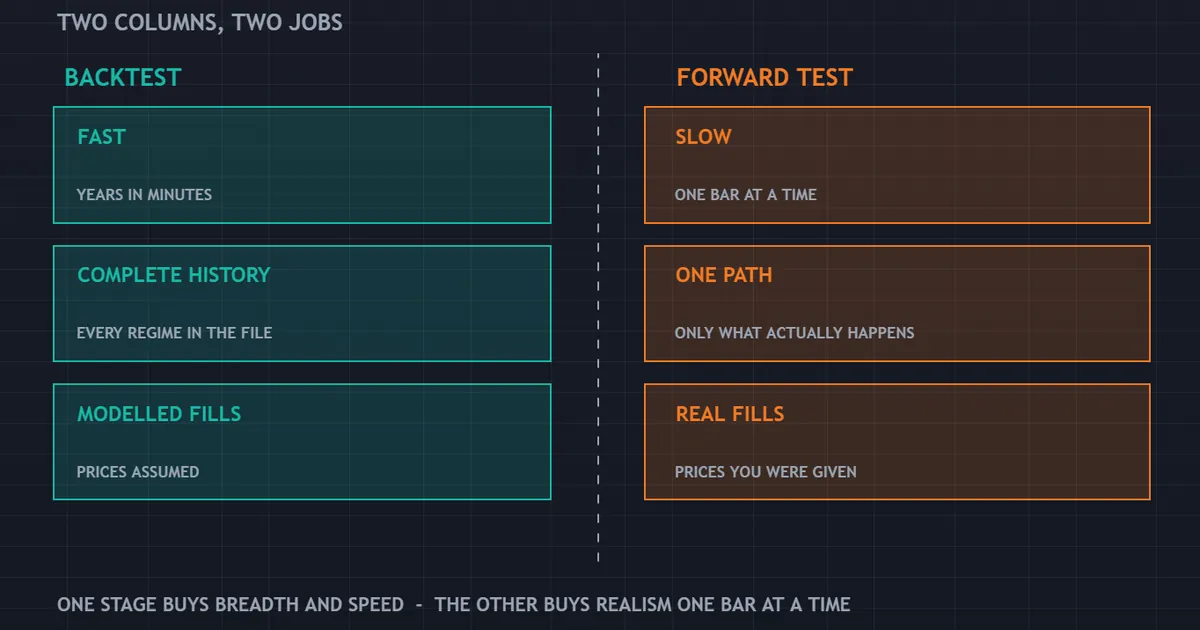
Backtesting vs Forward Testing at a Glance
Start with the shape of each stage. The differences fall into four buckets: speed, sample, realism and what the result can support.
| Dimension | Backtest | Forward test |
|---|---|---|
| Speed | Years of data in minutes | Real time, one bar at a time |
| Sample | Many regimes, many years | One path through current conditions |
| Fills | Modelled, usually at a fixed spread | Whatever the server actually gives you |
| Costs | Approximate, often understated | Exact, including swap and commission |
| Your behaviour | Absent entirely | Fully present, for better or worse |
| Best use | Discarding weak ideas cheaply | Checking whether a survivor works live |
| Main risk | Curve fitting | Impatience and a small sample |
Read the last two rows together. Each stage protects you from the other stage’s blind spot, which is exactly why the sequence matters.
A Simple Way to Think About the Two
Skip the jargon for a moment. Think of a recipe and a kitchen.
The Recipe Test
A backtest reads the recipe against every meal you have cooked. It asks one thing: would these steps have worked before?
You can read a recipe fast. You can read a thousand of them in an hour.
But the recipe says nothing about your oven. It says nothing about your hands, or about the day you burn the sauce.
The Kitchen Test
A forward test cooks the meal. Once, slowly, with the oven you own.
You learn what the page left out. You learn that the pan runs hot, and that step four takes longer than the book claims.
Both tests help. Neither one stands in for the other.
What a Backtest Does Well
Speed is the obvious advantage, though breadth matters more. A single run can cover several market regimes you would otherwise wait a decade to meet.
Disproving Ideas Cheaply
Most trading ideas fail. A tester finds that out in ninety seconds instead of ninety days.
So the honest job of a backtest is elimination. Our guide to backtesting in trading covers that framing in full.
Measuring Things You Cannot Feel
A report counts trades, measures the worst decline and reports the longest losing run. Nobody estimates those numbers accurately from memory.
Our drawdown calculator turns a reported decline into the recovery it demands. The arithmetic surprises most traders the first time.
Testing Across Conditions You Have Not Traded
A rule built during a calm quarter meets its first crisis eventually. History contains several, so a long test at least shows how the logic behaves when volatility triples.
Mark those stretches on the report before you read the total. A strategy that made all of its progress in one wild month is a different animal from one that ground along steadily.
Where a Backtest Quietly Overstates
None of the following makes a backtest useless. Each one, though, pushes the result in the same flattering direction.
The Spread Sits Still
The MT4 Strategy Tester applies a fixed spread unless you configure otherwise. Real spreads widen around releases and around the daily rollover, sometimes by a multiple.
A rule holding trades for days barely notices. A rule taking twenty trades a day notices enormously, and our guide to backtesting transaction costs puts numbers on the difference.
The Model Between Bars Is an Approximation
MT4 offers three modelling methods. Every tick interpolates ticks from M1 history and gives the finest picture, Control points uses the nearest smaller timeframe and is much rougher, and Open prices only evaluates at each bar open.
Open prices only runs fastest and means nothing for any rule that acts inside a bar. Modelling quality reads as a percentage, and it shows n/a for that mode.
Roughly ninety percent is the practical ceiling using MT4’s own M1 history on Every tick. Higher figures come from real tick data imported through third-party tools.
Errors in the Report Are Data Problems
Mismatched chart errors mean the history has holes. That figure describes your data rather than your strategy, so fix it before reading anything else.
The Trader Is Missing
No tester models hesitation, an early exit or a stop widened at the worst moment. Those decisions belong to the next stage entirely.
What a Forward Test Does Well
Everything a backtest cannot reach lives here. The list is shorter than the backtest’s list and heavier.
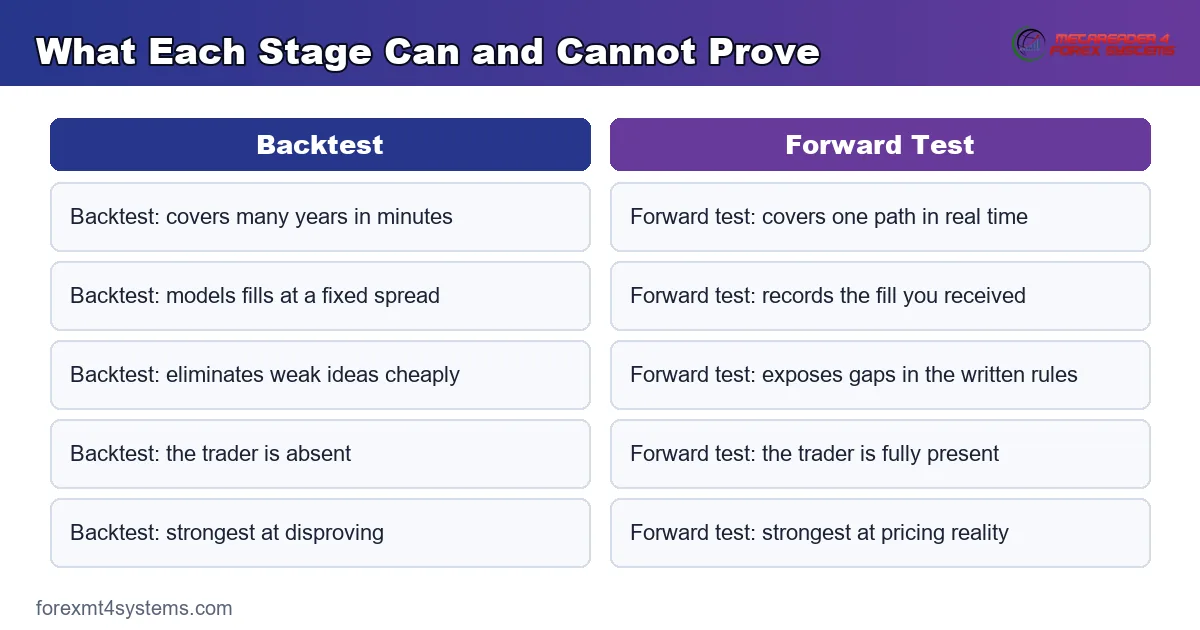
Real Fills
Slippage, requotes, partial fills and latency all arrive. So the average result per trade shifts, usually downwards and usually by more than traders expect.
Real Costs
Swap lands at rollover and triples on one night of the week. Commission arrives per lot. Neither appears fully in a default tester run.
Real Behaviour
Watching a live decline develop feels nothing like reading one in a report. Our guide to forward testing covers how long the stage should run and what to record.
Rule Completeness
Ambiguity hides well in history, since hindsight resolves it silently. Live bars expose every unwritten assumption within a fortnight.
The Same Strategy, Two Paths
Divergence between the two records is normal. Its size and its shape both carry information.

Reading the Gap
Above, one set of rules produces two paths. The tested path runs higher, the live path runs below it, and the separation between them is labelled as execution reality.
Shape matters more than height here. A live path that mirrors the tested shape while sitting lower points at costs, which are measurable and sometimes fixable.
When the Shape Differs Too
A live path with a different rhythm points at something else. Perhaps the trade count differs, perhaps entries fill at levels the tester never offered.
Compare the trade counts first. A large shortfall usually means the tester filled limit orders that a real book would have skipped.
Check the timing of the missing trades next. If they cluster around news or around the rollover hour, the cause is liquidity rather than logic, and the fix is a filter rather than a rewrite.
How Big a Gap Is Acceptable
No universal figure exists, and anyone quoting one has skipped the conditions. Frequency, instrument and holding time all move the answer.
Set your own threshold before the forward test starts. Deciding afterwards invites a generous reading.
Download the complete indicator database
Put these concepts on your charts. One email unlocks the full library of 1,380+ indicators with compiled MT4 and MT5 files, plus my TradingView scripts. No paywall, no spam, unsubscribe any time.
Get free access to my indicator database
One email unlocks 1,380+ free MT4, MT5 and TradingView indicators — the complete library. No single-tool download; you get the whole database.
Where the Two Results Separate
Five mechanisms explain almost every gap. Naming them turns a vague disappointment into a diagnosis.

Cost Assumptions
Fixed spread against variable spread accounts for a large share. Check the tester’s spread setting against your broker’s typical figure during your trading hours.
Fill Assumptions
Testers fill at a level once price touches it. Real queues do not always oblige, particularly on limit entries in fast conditions.
Sample Differences
Ten years of history contains conditions your ten-week forward test never met. Comparing a decade against a quarter is comparing two different questions.
Fitting
Parameters tuned hard to history rarely repeat. Our guide to curve fitting in trading explains how to spot it before the forward test does.
Adherence
A skipped signal or an early exit changes the record. Log both, because the strategy and the trader deserve separate verdicts.
The Order to Run Them In
Sequence is not a stylistic preference. Each stage assumes the previous stage already happened.

Backtest First
Run the cheap filter before spending calendar time. A rule that fails across a decade of history deserves no further weeks.
Forward Test Second
Freeze the rules, then run them small on live prices. This stage buys the information the tester could not supply at any price.
Size Up Third
Increase size in steps, with a review block of trades between each step. Our guide to position sizing covers how to set each step from your own risk budget.
What Belongs Between the Stages
One step sits between them and gets missed constantly. Write the rules out in full, in a form somebody else could follow.
That document freezes the strategy. Without it, the forward test slowly drifts into ordinary discretionary trading, and the comparison at the end means nothing.
Date the document and keep it. Any later change starts a new version, with a new record and a new trade count.
Never Skip Backwards
Going live and backtesting later is a common shortcut. It reverses the cheap filter and the expensive one, which is precisely the wrong way round.
What Each Stage Costs You
Both stages cost something. The bills look very different.
The Price of a Backtest
A backtest costs time at a desk and little else. You may spend a week just on clean data.
The real price is subtler. A good curve makes you keen, and keen traders skip steps.
The Price of a Forward Test
A forward test costs weeks, or months. It may also cost a small sum in real losses.
Yet that small sum buys hard facts. Facts about fills, about swap, and about how you act when a trade turns red.
The Price of Skipping Either
Skip the backtest and you may trade an idea that never worked at all. Skip the forward test and you may trade an idea that works on paper alone.
Both bills land later. Both land larger.
So the cheapest order is also the safest one. Spend hours before you spend weeks, and spend weeks before you spend money at size.
A Worked Sequence for One Idea
Here is the whole path, start to finish. The steps are short and the numbers are plain.
Week One: The Cheap Filter
Write the rules down. Run them over eight years on one pair.
The result comes out flat. So change nothing, and drop the idea. That took an hour.
Week Two: A Second Idea
A new rule shows a rising curve over the same years. Good, but not yet proof.
Hold back the last two years and fit only on the first six. Then test the part you held back.
It still rises, though by less. That is the first real sign of anything.
Weeks Three to Twelve: Live and Small
Freeze the rules. Trade the smallest size your broker allows.
Log the quote, the fill and the exit each time. Add a note when you break a rule.
After ninety trades the record shows a thinner edge than the test did. Most of the loss sits in the spread.
Week Thirteen: The Decision
Re-run the test over those ten weeks with the real spread. The two records now sit close.
Close records mean the model was honest. So size goes up one step, and the log keeps running.
Wide records would mean something else. Then the job is to find out what, rather than to trade bigger.
Comparing the Two Records Properly
A fair comparison needs matching conditions. Four adjustments make the numbers speak to each other.
Match the Period
Re-run the backtest across the exact dates of the forward test. Comparing a ten-year test against a ten-week live record proves nothing about either.
Match the Costs
Set the tester spread to what your account actually paid and add commission per lot. Then compare the two results per trade rather than the totals.
Match the Trade List
Line up the trades one by one where possible. Missing live trades and extra tested trades both point at something specific rather than at bad luck.
Compare Per Trade, Not in Total
Totals depend on trade count, which differs between the two records. Our free expectancy calculator reduces both records to a single per-trade figure you can set side by side.
What Neither Stage Can Tell You
Some things stay out of reach. Both stages share the same blind spots.
What the Market Does Next
Both stages look at what has already happened. Neither one looks ahead.
A rule can pass both tests and stop working the next month. Nothing in either record rules that out.
How You Will Act at Full Size
A small live test cannot show how you behave with real money on the line. Fear scales with size, and so does the urge to meddle.
Step the size up slowly for that reason alone. Each step is a fresh test of the trader rather than the rules.
Whether the Edge Was Ever Real
A clean pass through both stages shifts the odds a little. It does not settle the question.
Keep measuring after you go live. The record you build there is the only one that ever gets to be final.
How Many Ideas Survive Both
Very few, and that is the point. Most rules die in the first stage within minutes.
Of those that live, many fail the second stage on cost alone. A funnel that narrow is normal rather than a sign you are doing it wrong.
Common Mistakes When Weighing the Two
Six errors show up repeatedly. Each one produces a confident conclusion from thin evidence.
- Treating a backtest as proof. A backtest can disprove a strategy convincingly and confirm one only weakly.
- Treating a short forward test as proof. Twenty live trades carry roughly the evidence of twenty coin flips.
- Comparing mismatched periods. Different conditions produce different results for entirely uninteresting reasons.
- Re-optimising after a poor forward test. That converts an honest failure into a fresh round of fitting.
- Ignoring the trade count gap. Frequency divergence is usually the first symptom of a modelling problem.
- Testing only in calm conditions. A quiet quarter says very little about how the rules handle a violent one.
Keeping the two records honest takes discipline rather than software. A trading journal does most of the work if you fill it in the same way every time.
Which Stage Answers Your Question?
Match the question to the stage before running anything. This short table saves a great deal of wasted effort.
| Question | Stage that answers it |
|---|---|
| Did this rule ever work across several regimes? | Backtest |
| How deep does the worst decline get? | Backtest, then confirm forward |
| What will my fills actually look like? | Forward test |
| Do the rules cover every situation? | Forward test |
| Does the edge survive spread and swap? | Both, compared per trade |
| Can I follow this without interfering? | Forward test only |
| Are the parameters fitted to noise? | Backtest, using held-back data |
Traders who want the rules drawn on a live chart while the forward test runs can browse our forex trading strategies section for worked examples.
FAQ
Is forward testing better than backtesting?
Neither is better, because they answer separate questions. A backtest covers many years and many conditions cheaply, which no forward test can match. A forward test covers execution and behaviour, which no backtest can model. Skipping the backtest wastes months on ideas that never worked; skipping the forward test risks money on assumptions nobody checked.
Why did my backtest look great and my live results disappoint?
Four causes explain most cases. The parameters may have fitted noise rather than a pattern. The tester’s fixed spread may have understated your real costs. Fills may differ from the levels the tester assumed. Finally, the live sample may simply be small enough that ordinary variance explains the whole gap.
How much divergence between the two is normal?
Enough that some gap should be expected, and no published figure covers every case. Frequency drives it hardest: a rule taking twenty trades a day pays the execution difference twenty times a day, while a rule holding for weeks barely notices. Decide your own acceptable threshold before the forward test begins.
Can I forward test and backtest at the same time?
Yes, and running both in parallel is genuinely useful. Keep the backtest updated across the same dates the forward test covers, then compare the two records per trade each week. Divergence in trade frequency usually appears before divergence in the result, which gives you an early warning.
Does modelling quality decide whether a backtest is trustworthy?
It decides how finely the tester modelled movement inside each bar, which matters most for rules acting intrabar. A high figure does not repair fitted parameters, missing costs or a short sample. Treat modelling quality as one input among several rather than as a score for the strategy.
What if the forward test beats the backtest?
Enjoy it, then check the obvious causes before drawing a conclusion. A live record can run ahead of the tested one when conditions happen to suit the rules, when one large winner lands early, or when the tester’s cost settings were harsher than your account. A small sample flatters as easily as it disappoints, so keep going to the trade count you set.
Which one should a new trader run first?
The backtest, every time. It is cheap, it is quick, and it drops most ideas before they cost you anything. Learn to run a clean one on a single pair, with honest costs, before you spend a week on live testing. Writing rules clearly enough for a tester to follow is worth the effort on its own.
Can a demo account replace a backtest?
No. A demo account runs forward at the speed of the market, so it shows you one short path and nothing more. A backtest shows you many years and many regimes in minutes. Use the demo for what it does well, which is checking that your rules are complete and your platform behaves.
Should I re-run the backtest after the forward test finishes?
Yes, with the costs and the dates matched to the live record. That comparison isolates how much of the gap came from execution and how much came from the strategy itself. Review the two records together, look at how often it wins alongside the average size of the wins and losses, and treat any conclusion as provisional until the sample grows. Results are not guaranteed; past performance is not indicative of future results.
External references
- For background on this concept, see Hypothesis Testing at Corporate Finance Institute.
- For broader market context, see Training, Validation and Test Data Sets on Wikipedia.

About the author
Written by Dominic Walsh, a Forex trader and MT4/MT5 indicator, Expert Advisor and script developer. Every tool on forexmt4systems.com is tested on live charts before release and ships with ready-to-use compiled MT4 (.ex4) and MT5 (.ex5) files. Learn more about the trader and developer behind this site.
How we build, test and correct every tool: Editorial & Testing Policy. Trading carries risk; see the disclaimer.