
The MT4 Strategy Tester replays stored price history and applies your trading rules to it. Then it prints a report full of confident numbers. Those numbers carry exactly as much weight as the data and the settings behind them.
This guide covers every setting in the MT4 Strategy Tester that moves the result, then reads the report line by line. It also says plainly what the tool cannot model, because that gap explains most of the distance between a test and a live account.
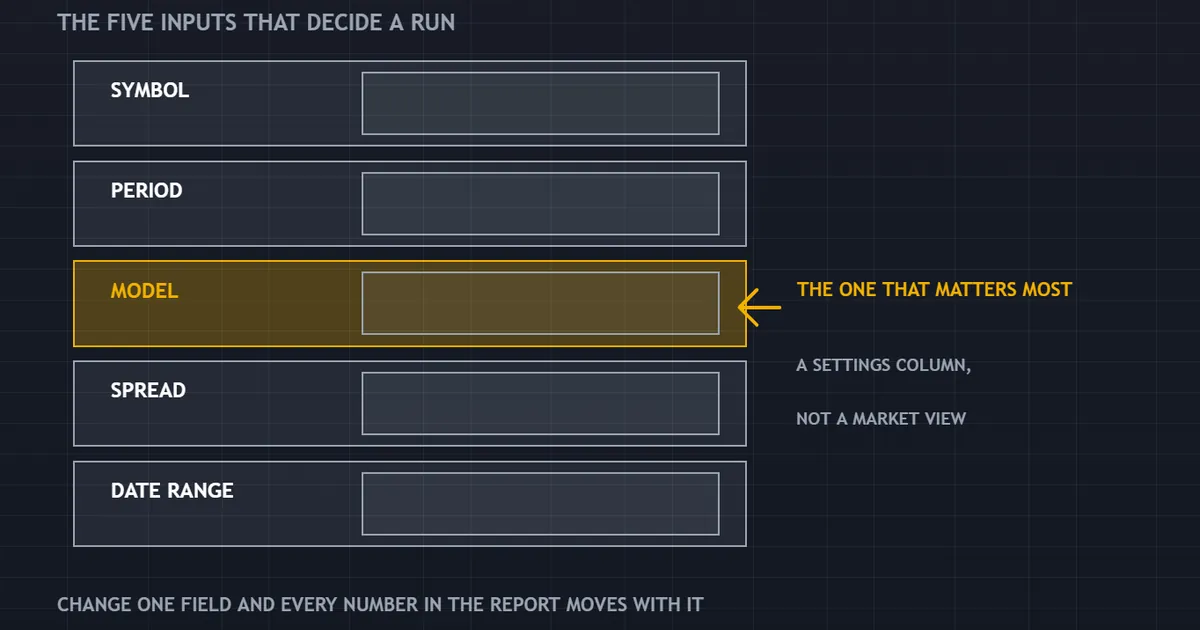
The panel above lists the inputs that decide a run. Change any one of them and every number downstream changes with it.
What the Tester Really Measures
Orders open and close inside a simulation. No money moves, and no broker ever sees the activity.
So the output describes a hypothesis rather than a result. It answers one narrow question: how would these rules have behaved on this history, under these assumptions?
Simulation, Not Prediction
Nothing in the report knows about tomorrow. The market that produced your test history has no duty to repeat itself, and it usually declines.
Use the tool the way an engineer uses a stress rig. It finds rules that break. Never treat it as a certificate for the rules that survive.
The One Honest Claim
A backtest can disprove a strategy, but it cannot prove one. That single sentence should sit above the screen while you work.
It sounds bleak. Still, it makes the tool far more useful, because killing bad ideas quickly saves months of wasted effort.
Our wider piece on forward testing covers the step that follows. Nothing on history settles the question on its own.
Preparing the Price History First
Everything downstream rests on the stored bars. So the history deserves attention before any setting gets touched.
Why One-Minute Bars Matter So Much
MT4 rebuilds its intrabar path from one-minute data. If those bars are thin, the simulation invents more of the movement than it reads.
That applies even when you test an hourly rule. The higher timeframe supplies the signal, while the one-minute record supplies the path between signals.
Check the Coverage You Actually Have
Look at how far the one-minute record stretches back for your symbol. Then compare that span against the date range you plan to test.
Traders regularly select five years and hold eight months of usable bars. The run completes anyway, and the report never mentions the shortfall in plain words.
Brokers Differ, So Records Differ
Two brokers rarely publish identical bars for the same pair. Quotes come from different liquidity sources, and the daily close sits at a different hour.
So a rule that thrives on one feed can stumble on another. Test on the history from the account you intend to trade, not on whatever was easiest to download.
The Settings That Decide a Run
Five choices shape everything the report says. Get them wrong and the rest of the exercise turns into theatre.
Symbol and Period
Pick the exact symbol your account trades. Suffixes matter, because a broker may carry several versions of the same pair with different specifications.
The period sets the bar size your rules read. It does not set the resolution of the simulated price path, which is a separate choice.
The Modelling Method
This one matters more than any other. It decides how much detail the simulation reconstructs inside each bar.
The next section covers all three options in full. For now, treat it as the dial that controls honesty.
Spread
The tester applies a fixed spread unless you configure something else. Real spread breathes, so a fixed figure flatters any rule that trades around news or near the daily rollover.
Date Range and Deposit
A start date chosen after the fact can rescue a poor rule. Shift it by three months and many curves change character entirely.
The opening deposit interacts with position sizing. Test the balance you actually hold, not a round number that makes the curve look tidy.
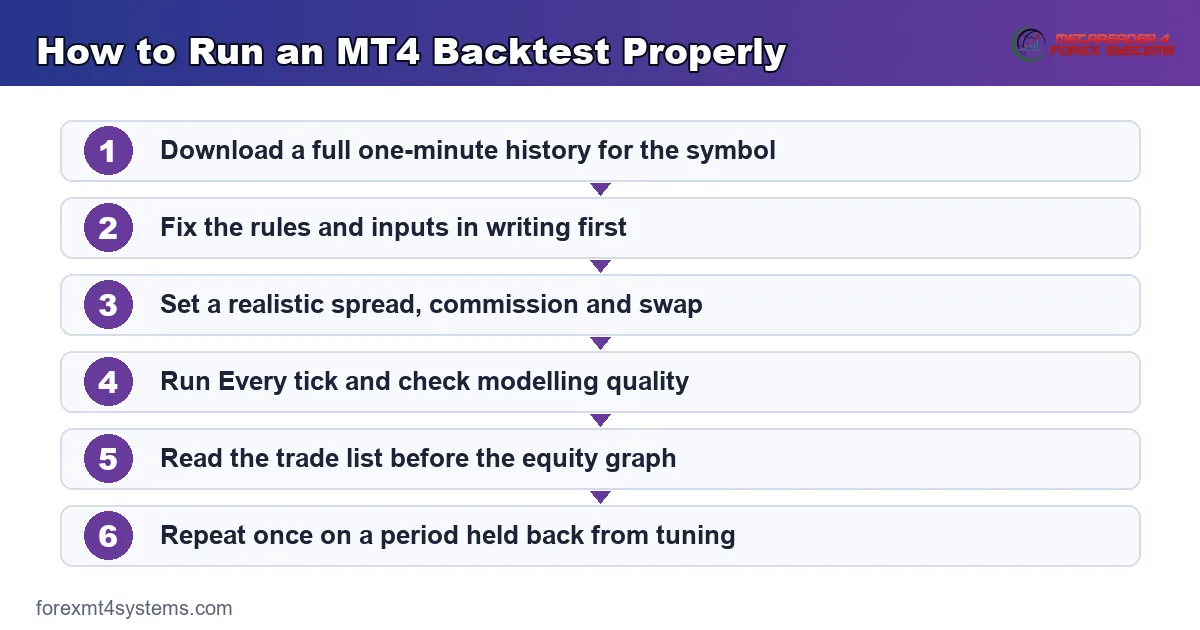
The diagram above sets out the order of work. Each step removes one way of fooling yourself, so skipping any of them costs you later.
Choosing a Modelling Method
MT4 offers three ways to reconstruct what happened inside a bar. They differ enormously in detail, speed and credibility.
Every Tick
This is the most precise of the three. MT4 builds a tick path for each bar from its own one-minute history, interpolating the movement between those points.
Unless you import real tick data with a third-party tool, those ticks remain an interpolation. So the method is the best available inside the platform, yet it still models an approximation.
Control Points
Control points use the nearest smaller timeframe to sketch the path. On an hourly test that means half-hourly detail, which is far rougher than it sounds.
The method runs quickly and suits a first sanity check. Any rule whose stop and target both sit inside a single bar deserves better treatment than this.
Open Prices Only
The fastest option evaluates your rules at the open of each bar and nothing else. For an end-of-bar system on a daily chart, that can be reasonable.
For any rule that acts intrabar, it is meaningless. Stops, targets and trailing logic all live inside the bar, and this method never looks there.
Modelling Quality in the Report
The report shows modelling quality as a percentage. It describes how much of the simulated path came from real data rather than a guess.
Around ninety percent marks the practical ceiling on MT4’s own one-minute history with Every tick. The field reads n/a for Open prices only, since no intrabar path exists to score.
Higher figures circulate widely, and they come from imported real tick data through third-party tools. Our companion guide to MT4 modelling quality unpacks what those numbers do and do not promise.
Reading the Report Without Fooling Yourself
Most traders open the report at the equity graph. That habit skips the information that actually describes behaviour.
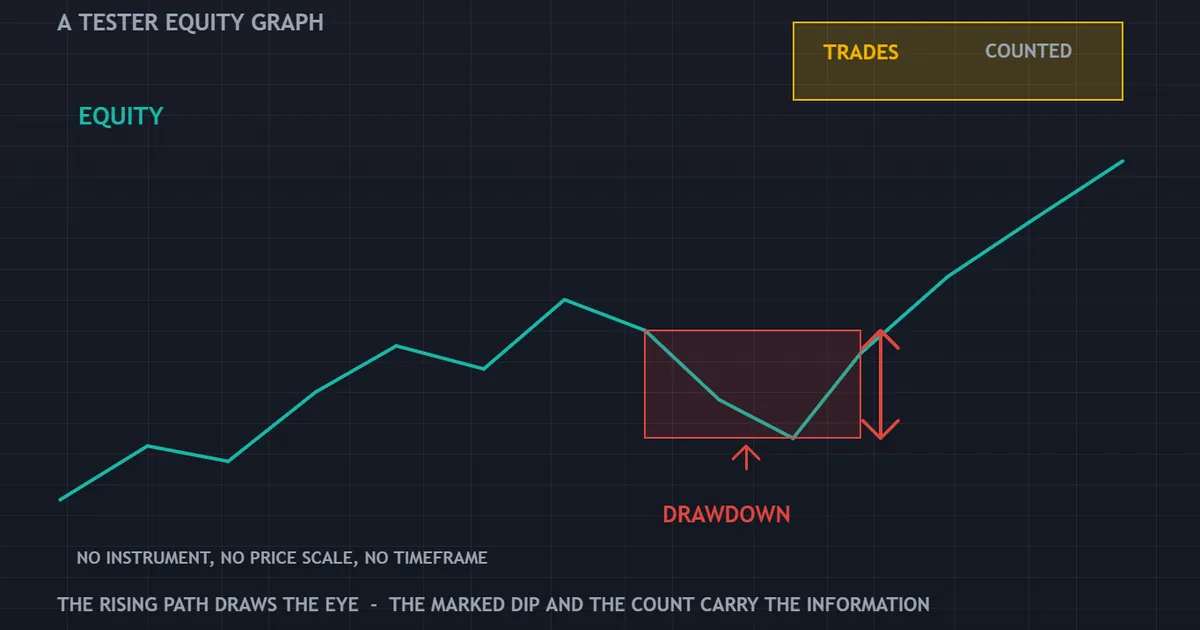
The equity panel above shows the shape most reports produce: a rising path with one deep dip and a trade count beside it. Both halves matter.
Start With the Trade List
Open the trade list first. Count the trades, check the holding times, and find the longest losing sequence.
A curve summarises. A trade list explains, and only one of the two survives a serious review.
Trade Count Before Anything Else
Forty trades tell you almost nothing. Randomness produces streaks of that length constantly, so the sample cannot separate an edge from luck.
Our note on backtest sample size puts numbers on that problem. Read it before you celebrate anything.
Profit Factor and Drawdown Together
Profit factor divides gross profit by gross loss. It says nothing about the path taken to get there.
Maximum drawdown describes that path. Pair the two, then ask whether you would still be trading at the bottom of the worst stretch.
Consecutive Losses
The report lists the longest run of losers and its size. Double that run, then imagine it arriving in your first month.
Model the damage against your own balance with our drawdown calculator. Seeing the figure in account terms changes how it feels.
Costs the Tester Understates
A simulation charges you a clean, predictable price. Live trading charges you something messier.
Fixed Spread Against Real Spread
The fixed spread setting applies one number to every fill. Spread widens through releases, at the weekly open and in thin hours, which happen to be the hours breakout rules like most.
Slippage and Requotes
No backtest contains slippage variation or a requote. Fast markets fill you away from your requested price, and fast markets arrive exactly when your rule fires.
Swap and Commission
Overnight financing shifts with rates and with your broker. Commission lands on every round turn, so a high-frequency rule pays it many more times than the report suggests.
Our breakdown of backtesting transaction costs works through each of these in order.

Matching the Test to Your Own Account
A run only informs you about the account it describes. Four details decide whether it describes yours.
Contract Size and Minimum Volume
The smallest lot your broker accepts sets a floor under your risk. If that floor already exceeds your limit per trade, the rule does not suit your balance yet.
Size the positions properly before judging anything with our position size calculator. A test run at the wrong size answers the wrong question.
Leverage and Margin
Leverage in the tester changes when a simulated position gets closed out. A rule that survives at high leverage can hit a stop out at the level your regulator permits.
The Trading Server Clock
Bar boundaries follow the server clock, not yours. A session filter written in local time drifts twice a year, and the drift quietly reshapes the results.
Symbol Specification
Point value, stop level and swap all live in the symbol specification. Copy them from your live account, since defaults belong to whichever server the terminal last used.
Data Gaps and Mismatched Charts Errors
The report sometimes shows a count of mismatched charts errors. Traders read it as a verdict on the strategy, which it never is.
What the Message Means
It means your history has holes. The one-minute bars do not line up with the higher timeframe bars the tester rebuilt from them.
So the message flags a data problem. Fix the history, then run again before you read a single performance number.
How Holes Get There
Terminals download only part of the record by default. Old data expires, brokers change feeds, and a fresh installation starts nearly empty.
Check the length of your one-minute history before any serious run. A test that quietly covers half the period you selected tells you very little.
Optimisation and Where It Goes Wrong
The optimiser sweeps a range of settings and ranks the outcomes. Used carelessly, it manufactures results that exist only in the past.
The Lonely Peak
Test enough combinations and one will top the table. That combination usually describes noise in the sample rather than anything durable.
Check the neighbours. A robust setting sits inside a broad plateau of acceptable outcomes, while a fitted one stands alone.
Every Parameter Costs Credibility
Two inputs across a long sample can survive scrutiny. Nine inputs across two years cannot, because the search space swamps the evidence.
Our guide to curve fitting in trading shows the shapes that give it away.
Hold Back Data
Reserve a period the optimiser never touches. Apply the chosen settings once to that period, then accept whatever it says.
Visual Mode and Sanity Checks
Visual mode replays the chart with your orders drawn on it. It runs slowly, and it catches errors no statistic reveals.
What to Watch For
Look for entries at impossible prices and stops that never move. Watch for trades opening on bars your rule should have skipped.
Ten minutes of watching often beats an hour of reading. The eye spots nonsense faster than a spreadsheet does.
Cross-Check One Trade by Hand
Pick a single trade from the list. Find that bar on a normal chart, then confirm the entry, the exit and the size by hand.
If the manual version disagrees with the report, stop. Something in the code or the settings does not do what you think.
A Checklist Before You Trust a Run
Work through this list before any result earns your attention. It takes an afternoon and saves considerably more.

| Check | What good looks like | Warning sign |
|---|---|---|
| Modelling method | Every tick, with an intrabar-aware rule | Open prices only on a rule that acts inside the bar |
| Modelling quality | Around ninety percent on platform history | A low figure, or n/a treated as acceptable |
| Mismatched charts errors | Zero, after the history has been repaired | A large count ignored because the curve looked fine |
| Spread setting | A realistic figure, or variable spread modelled | An optimistic fixed number carried over from a demo |
| Commission and swap | Both included in the account specification | Neither appears anywhere in the report |
| Trade count | Several hundred trades across varied conditions | A few dozen trades inside one calm year |
| Unseen data | Identical settings confirmed on a held-back period | One long optimised run and nothing else |
| Worst losing sequence | A stretch you could sit through calmly | A depth nobody has looked at yet |
Turn the trade statistics into a per-trade figure with our expectancy calculator. One honest number beats a page of them.
What the MT4 Strategy Tester Cannot Tell You
Three limits sit beyond any setting. No configuration removes them, so plan around them instead.
It Cannot Model You
Hesitation, early exits and a hand on the off switch never appear in a simulation. Yet they end more automated records than any market condition does.
It Cannot Model a Regime It Never Saw
A rule tested through calm ranges keeps firing when volatility doubles. Nothing in the code measures the regime, so nothing warns you.
It Cannot Certify an Edge
Survival on history means the rule has not yet failed. That is genuinely useful, and it falls far short of proof.
For the wider process around the tool, our overview of MT4 indicators shows where these rules usually start life.
Download the complete indicator database
Put these concepts on your charts. One email unlocks the full library of 1,380+ indicators with compiled MT4 and MT5 files, plus my TradingView scripts. No paywall, no spam, unsubscribe any time.
Get free access to my indicator database
One email unlocks 1,380+ free MT4, MT5 and TradingView indicators — the complete library. No single-tool download; you get the whole database.
From a Passing Test to a Live Rule
A clean run marks the start of the work, not the end. Three stages sit between the report and real size.
Freeze Everything
Write down the inputs and the version, then stop touching them. Any change after this point restarts the evidence from zero.
Traders drift here without noticing. One small tweak per week, and after a month nobody can say what the rule does.
Run on Demo With Live Prices
Demo exposes the errors history hides. Session boundaries, symbol names, weekend behaviour and terminal restarts all show up within days.
Compare the demo log against the tester log for the same period. Where the two disagree, the disagreement is the lesson.
Go Live at the Smallest Size
Minimum volume answers the question demo cannot. Fills, slippage and financing arrive properly, and the cost of learning stays small.
Keep a written record of every deviation. Our guide to keeping a trading journal covers what to capture and how often.
Common Mistakes Worth Avoiding
Five habits ruin more runs than any technical fault. Each has a simple correction.
Testing on a Fresh Terminal
A new installation holds almost no one-minute history. So the first run covers a fraction of the period you chose, and the report says nothing about it.
Reading the Curve First
The equity graph flatters everything. Open the trade list, then return to the picture once you know what produced it.
Changing Two Things at Once
Alter the spread and the modelling method together and you learn nothing from the difference. Move one variable per run.
Ignoring the Journal Tab
Errors surface there long before they surface in the numbers. A rule that silently fails to place half its orders still produces a tidy report.
Trusting a Single Symbol
One pair across one period is an anecdote. Run the same rules on several instruments before you form any view.
Treating the Report as a Forecast
The figures describe a sample of the past. They carry no claim about the months ahead, however tidy the curve looks.
So phrase your conclusion carefully. “This rule survived these conditions” holds up, while “this rule makes money” does not.
Testing Only the Calm Years
Quiet periods flatter mean reversion, and trending periods flatter breakouts. A range that covers just one character tells you about the calendar rather than the rule.
Stretch the window across both. Then read the two halves separately, because an average across them hides the part you need to see.
FAQ
What modelling quality should I aim for in MT4?
On MT4’s own one-minute history with Every tick, roughly ninety percent is the practical ceiling. Anything materially lower usually points to gaps in the stored bars rather than a problem with your rules. Figures above that come from imported real tick data through third-party tools, and they still describe a reconstruction rather than the exact stream your broker sent.
Why does the report show mismatched charts errors?
Because the price history has holes. The one-minute bars do not reconcile with the higher timeframe bars rebuilt from them, so the tester flags the inconsistency. Treat the count as a data warning, never as a comment on the strategy. Repair or reimport the history, then run the test again from scratch.
Is Open prices only ever a sensible choice?
Sometimes, though the conditions are narrow. It suits a rule that decides at the open of a bar, holds until a later bar opens, and uses no intrabar stop or target. Anything with a stop loss, a take profit or trailing logic acts inside the bar, and this method simply never looks there.
Does a good backtest mean the strategy will work?
No. A test on history shows that a rule has not yet failed under one set of assumptions, on one stretch of data. That is worth knowing, and it stops well short of evidence about the future. Follow every promising run with a forward test on live prices before any real size goes near it.
Should I test on the same broker I trade with?
Yes, wherever practical. Quotes, the daily close hour, swap rates and the minimum volume all vary between servers, and each of those shifts the outcome slightly. Testing on a demo from a different company gives you a useful rough sketch, but the figures belong to that company’s feed rather than yours.
Why do my optimised settings perform badly afterwards?
Usually because the optimiser found an accident. Sweeping hundreds of combinations across one sample almost always produces a leader, even when the underlying data holds no pattern at all. Check the settings either side of the winner: a durable choice sits in a broad plateau of decent outcomes, while a fitted one stands alone on a spike.
How many trades does a run need before the numbers mean anything?
More than most people use. A few dozen trades sit well inside the range that chance alone produces, so hundreds across varied market conditions is a fairer starting point. Even then, the figures describe the sample you tested rather than the market as a whole. Results are not guaranteed; past performance is not indicative of future results.
External references
- For background on this concept, see Testing Trading Strategies in the MQL5 Documentation.
- For broader market context, see MetaTrader 4 in the BabyPips Forexpedia.

About the author
Written by Dominic Walsh, a Forex trader and MT4/MT5 indicator, Expert Advisor and script developer. Every tool on forexmt4systems.com is tested on live charts before release and ships with ready-to-use compiled MT4 (.ex4) and MT5 (.ex5) files. Learn more about the trader and developer behind this site.
How we build, test and correct every tool: Editorial & Testing Policy. Trading carries risk; see the disclaimer.