
Backtest sample size is the number of closed trades behind a result, and it decides how much that result is worth. A strong curve built on thirty trades is a story, not evidence.
Most testing arguments come down to this one variable. So it deserves a page of its own, ahead of any debate about entries or filters.

The panel above shows one measured result at three sample sizes. The band around the estimate is enormous at twenty trades and still wide at one hundred.
Why Backtest Sample Size Decides What You Can Claim
A backtest cannot prove a strategy works. It can only fail to reject it, and the strength of that non-rejection depends almost entirely on the trade count.
With few trades, luck and edge look identical. With many trades, luck averages out and whatever remains starts to mean something.
The Claim Scales With the Count
Thirty trades support a sentence like “this did not blow up immediately”. Five hundred trades support a sentence about the average result.
Nothing supports a sentence about next quarter. So keep the claim inside the evidence, and say plainly where the evidence stops.
What Variance Does to a Small Sample
Randomness produces streaks. Long ones, convincing ones, and far more often than intuition suggests.
The Coin That Looks Skilled
Flip a fair coin twenty times and runs of five heads turn up regularly. Nobody would call the coin skilled, yet the same pattern in a trade list gets called an edge.
Trading outcomes carry more spread than coin flips. So the illusion is stronger, not weaker.
The Error Band Around an Estimate
Every measured average sits inside an error band. That band shrinks as the sample grows, and it never disappears.
Report the band, or at least look at it. A figure of 0.30R per trade means one thing at plus or minus 0.05R and something else entirely at plus or minus 0.40R.
Two Traders, One Rule
Give the same rule to two traders and start them a month apart. Their first fifty trades will differ enough to produce opposite opinions.
One declares the rule excellent. The other abandons it, and neither has enough evidence to be right.
That scenario plays out constantly in forums. It explains most disagreements about strategies far better than any argument about the logic.
Square Root, Not Straight Line
Uncertainty falls with the square root of the sample. Four times the trades gives half the error band, not a quarter of it.
That relationship is brutal. Going from one hundred trades to a genuinely tight estimate takes thousands, which is why so few claims survive scrutiny.
A Rough Rule for the Floor
You can approximate the count you need in one line. Divide the spread of your trade results by your edge, square the result, then multiply by four.
Working It Through
Say your edge is a quarter of an R and your results spread about one R either side. One divided by 0.25 gives four, four squared gives sixteen, and sixteen times four gives sixty four.
So sixty four trades reaches roughly two standard errors on those assumptions. Real trade lists spread wider than one R, so a couple of hundred is the more honest floor.
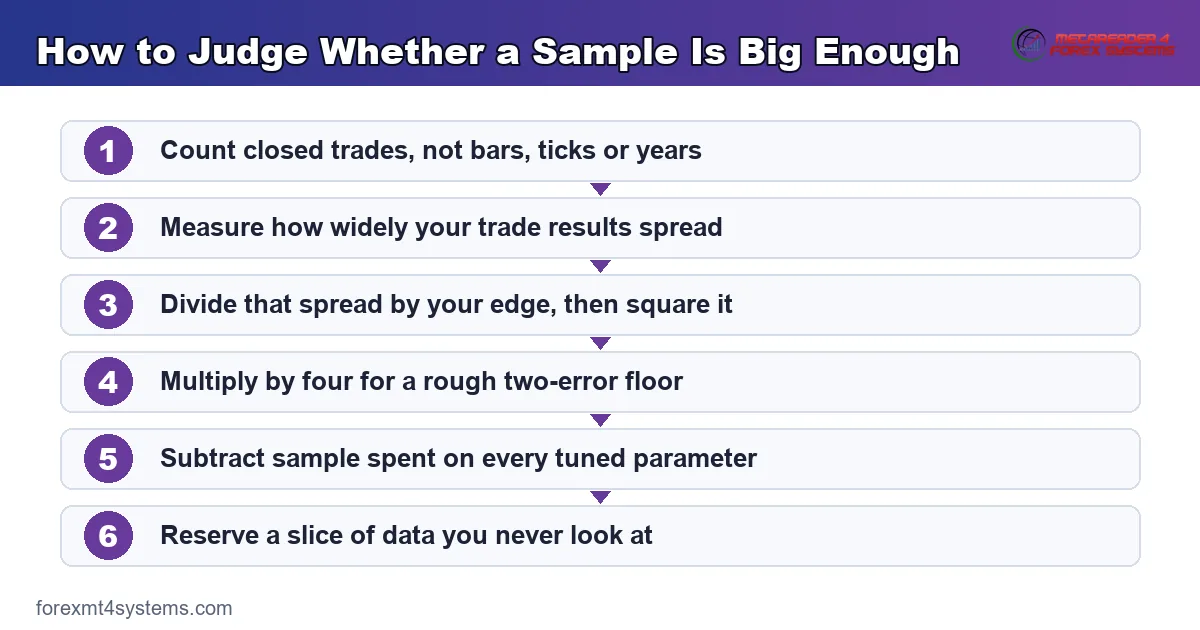
The flow above turns that into a checklist. Work down it before you accept any result, including your own.
Why Thirty Is a Myth
The thirty-trade rule comes from statistics teaching, where thirty samples get an average close to normal. Trading results break that assumption badly.
Outcomes are skewed, with a long tail of large winners or large losers. So thirty tells you very little, and it never told you what people think it did.
One Occurrence Is Not Evidence
Single examples convince people. They should not, and a real one makes the point better than an argument.

The box held for 28 bars, then price closed down out of it on 2026-07-23 and travelled 4.9 ATR further in that direction over the next 10 bars. That is a textbook range break on EURCAD hourly bars, and it worked beautifully.
What the Chart Actually Supports
The chart supports one statement: this happened once, here. It says nothing about the rate at which range breaks follow through.
To learn that rate you need every range break in the period, including the dull ones and the failures. Screenshots select for the good ones automatically.
The Screenshot Problem
Nobody publishes the break that stalled. So the visual record you encounter online is filtered before you ever see it.
Treat any single chart as an illustration of a rule, never as proof of one. The proof lives in the count.
The Rare Trade That Carries the Result
Small samples have another failure mode. One enormous outcome can create an edge that is not there.

Price ran up 6.4 ATR over 18 bars and the deepest pullback against that run was only 29 percent of the distance travelled — a position sold into it was never given a recovery. That is a weekly US10Y run, and a rule that happened to be long through it would post a spectacular result.
Check the Result Without the Best Trades
Remove your three largest winners and recompute. If the edge collapses, the sample was carrying one unrepeatable stretch.
Then remove the three largest losers as well. A rule that only works when you delete both tails is telling you the sample is far too small.
Trend Rules Need the Longest Samples
Rules that rely on rare large winners need more trades than rules with tidy outcomes. The tail is where their edge lives, and tails turn up rarely by definition.
Our note on trading expectancy covers the same point from the arithmetic side. Lumpy outcomes push the required count up sharply.
Download the complete indicator database
Put these concepts on your charts. One email unlocks the full library of 1,380+ indicators with compiled MT4 and MT5 files, plus my TradingView scripts. No paywall, no spam, unsubscribe any time.
Get free access to my indicator database
One email unlocks 1,380+ free MT4, MT5 and TradingView indicators — the complete library. No single-tool download; you get the whole database.
Where the Count Hides in an MT4 Report
The MT4 Strategy Tester prints the number you need. It sits in the results header as total trades, and most readers scroll straight past it.
Read Three Fields First
Open the report and read total trades, then the number of consecutive losses, then the maximal drawdown. Only after those three does the profit figure mean anything.
Our walkthrough of the MT4 Strategy Tester covers the rest of the panel. The trade count is the field that decides how much of it you can use.
Modelling Quality Is a Separate Question
A high modelling quality percentage describes tick detail, not sample size. You can model every tick beautifully across forty trades and still know nothing.
So treat the two as independent gates. Detail per trade sits on one axis, and the number of trades sits on the other.
Mismatched Charts Errors Shrink Your Sample
The report also counts mismatched charts errors, which flag gaps in the history. Gaps remove trades that should have happened, so the effective count drops below what the header shows.
Fix the data before you trust the count. A clean history is cheaper than a wrong conclusion.
Reshuffling the Same Trades
You cannot always add trades. Sometimes the sample is what it is, and the useful move is to interrogate it harder.
Reorder and Look Again
Take your trade results and shuffle their order, many times over. Each shuffle produces a different equity curve from identical trades.
That exercise is sobering. The same rule yields a comfortable ride in one ordering and an account-ending drawdown in another.
Resample With Replacement
Draw trades at random from your list, with repeats allowed, until you have a synthetic run of the same length. Repeat that a thousand times and you get a distribution instead of a point estimate.
The spread of that distribution is your honest uncertainty. A thin sample produces a spread so wide it usually ends the discussion.
What It Cannot Fix
Reshuffling adds no new information. It only reveals how little the original sample contained, which is valuable and limited at the same time.
So use it as a warning device. Then go and collect more trades, or narrow the claim.
Count Trades, Not Bars or Years
People quote test length in years. Years are the wrong unit, because a rule that trades twice a month covers a decade in a few hundred trades.
The Two Numbers to Publish
Publish the trade count and the calendar span together. One without the other invites a false impression, usually the flattering one.
Ten years and eighty trades is a thin sample over a long period. Six months and eight hundred trades is a dense sample over a narrow one.
Both Kinds of Thin
A long span with few trades misses nothing about market conditions and everything about trade behaviour. A short span with many trades has the opposite gap.
So aim for both: enough trades to measure, spread over enough conditions to matter. Anything less leaves a hole you should name out loud.
Independence Is the Assumption Everyone Breaks
Statistical rules assume each trade is independent. Real trade lists rarely are, and the effective sample is smaller than the raw count.
Overlapping Positions
Two trades open at the same time on the same driver are close to one trade. Counting them as two inflates your sample without adding information.
Correlated Instruments
A basket of euro crosses moves together. Twenty trades across five correlated pairs behave more like eight independent outcomes.
Check the correlations before you claim the count. The forex correlation matrix shows which pairs currently move as one.
One Regime Repeated
Five hundred trades inside a single trending year is one condition sampled many times. The count looks healthy, and the diversity does not.
So slice by year and check that the edge survives each slice. A rule that only works in one calendar year has told you something important.
Growing the Sample Honestly
There are good ways to raise the trade count and bad ones. The bad ones create the illusion of evidence.
More Instruments
Running the same unchanged rule across more symbols adds genuinely new outcomes. Keep the parameters identical, or you are optimising rather than sampling.
More History
Extending the period backwards helps, within limits. Very old data reflects wider spreads, slower fills and different participants.
So weight recent data more heavily. A rule that works across twenty years but fails across the last three has a problem worth naming.
Cross-Check Against a Neighbour Rule
Test a close variant on the same data and compare the shapes. A robust idea leaves a broad patch of decent results across neighbouring settings.
That check does not enlarge the sample. It does tell you whether the sample is describing an idea or an accident.
What Not to Do
Dropping to a faster timeframe multiplies the trade count and multiplies the cost drag with it. That is a different strategy, not a bigger sample.
Loosening the entry filter does the same thing. More trades of a weaker kind is not progress.
Sample Size and Optimisation Pull Against Each Other
Every parameter you tune consumes evidence. Fit four settings on two hundred trades and the effective sample shrinks toward nothing.

Degrees of Freedom
Think of it as trades per parameter. Fifty trades for each tuned setting is a rough minimum, and more is better.
Our note on curve fitting in trading explains what happens when that ratio collapses. The result describes noise with great precision.
Reserve Data You Never Touch
Split the history before you start. Optimise on the first portion, then test once on the reserved portion and accept the answer.
Rolling that idea forward gives you walk forward analysis. It costs sample size, and it buys credibility.
A Quick Reference Table
Use the table below as a sanity check, not as a licence. The right column is the honest claim at each count.
| Closed trades | What it can show | What it cannot show |
|---|---|---|
| Under 30 | Whether the code runs and the logic fires | Anything at all about the average result |
| 30 to 100 | Obvious failure, gross cost problems | Whether a modest edge exists |
| 100 to 300 | A rough estimate with a wide band | Small differences between two variants |
| 300 to 1000 | A usable estimate for a tidy outcome shape | Reliable behaviour in unseen conditions |
| Over 1000 | A reasonably tight estimate of the average | That the edge persists after publication |
Common Sample Size Mistakes
Four errors turn up in almost every thin test. Each one is easy to correct.
Counting the Wrong Thing
Bars tested, ticks modelled and years covered are not trade counts. Only closed trades belong in the denominator.
Comparing Variants on Thin Data
Two variants measured on eighty trades each will differ, always. That difference carries no information.
Stopping When It Looks Good
Deciding to stop testing after a strong stretch bakes the streak into the result. Fix the test window in advance, then run it to the end.
Quoting a Percentage Without the Base
A share of winners means nothing without the denominator. Sixty percent of ten trades and sixty percent of a thousand are different claims entirely.
So always print the base beside the percentage. Marketing material almost never does, which tells you something on its own.
Treating Every Trade as Equal Evidence
Trades taken during one unusual week carry less information than trades spread across a year. Cluster them and the effective count falls again.
Check when your trades happened before you trust the total. A calendar histogram of entries takes a minute and often changes the conclusion.
Ignoring Your Live Sample
Your own record is the sample that matters most. Keep it complete, and a trade journal makes that painless.
Forward Trades Count Too
The sample does not stop growing when the backtest ends. Every demo and live trade extends it, and those trades are worth more than historical ones.
Why Forward Trades Weigh More
Forward trades arrive on data nobody tuned against. They also carry real fills, real spread and real hesitation, so they measure the traded rule rather than the written one.
Twenty forward trades will not settle anything on their own. Still, they test something the backtest never could.
Keep One Combined Record
Append forward results to the tested list and recompute as they land. That way the estimate improves over time instead of freezing at the moment you stopped testing.
Our guide to forward testing covers how long to run one. Sample size answers most of that question as well.
Do Not Restart the Clock
Traders often discard the old record after a settings change. That habit destroys sample constantly, and the count never grows past a few dozen.
Change settings rarely, and log the date when you do. Then you can measure each version separately without throwing anything away.
What a Thin Sample Can Still Do
Small tests are not worthless. They are simply limited, and the limits are specific.
It Can Reject
A rule that loses badly across fifty trades has failed a cheap screen. Rejection needs far less evidence than acceptance.
It Can Expose Mechanics
Fifty trades reveal coding errors, wrong session filters and silly stop placement. Those bugs show up immediately, so run the short test first.
It Can Size Your Ambition
A thin sample tells you how long a proper test will take. That estimate alone often ends the project, and ending it early is a good outcome.
Before you commit real money, check survival odds at your intended risk with the risk of ruin calculator. Thin evidence and heavy size is the worst pairing in trading.
Where This Sits in a Testing Process
Sample size is a gate, not a step. It sits between measuring a result and believing one.
The Order That Works
Write the rule, run the test, count the trades, then decide what the count entitles you to say. Reversing those last two produces most of the overconfidence in this field.
Strategy families differ in natural frequency, and our MT4 indicators library spans both the busy and the patient kinds. Pick the family first, then plan the sample around it.
Then Add Forward Data
Live and demo trades keep arriving after the test ends. Append them, recompute, and let the sample grow on its own.
That habit turns a one-off test into an ongoing measurement. It also stops the original result from freezing into a belief.
Say the Count Out Loud
State the trade count every time you quote a result, in your own notes and in any post. The discipline is small, and it corrects a great deal of sloppy thinking.
It also filters what you read. Any claim that omits the count has answered your question already.
FAQ
How many trades does a backtest need?
A few hundred as a working floor, and more when outcomes are lumpy. The honest answer depends on the size of your edge relative to the spread of your results, so a rule with a large edge and tidy outcomes needs fewer trades than a trend rule that relies on rare big winners.
Is thirty trades really too few?
Yes, for almost any trading question. The thirty-sample rule comes from settings where outcomes cluster tightly around an average, and trading results do the opposite. Thirty trades can screen out an obvious disaster, and nothing more than that.
Can I use more currency pairs to reach the count faster?
You can, provided the parameters stay identical across every symbol and you allow for correlation. Twenty trades spread across five closely linked pairs behave more like a handful of independent outcomes, so the raw count overstates what you actually learned.
Does a longer backtest period fix a small sample?
Only if it produces more trades. A rule that trades twice a month covers a decade in roughly two hundred and forty trades, so the calendar span looks impressive while the sample stays thin. Publish both numbers and the picture becomes clear.
How does sample size interact with optimisation?
Every tuned parameter spends part of your evidence. Fitting several settings on a few hundred trades leaves an effective sample close to zero, which is why the result looks perfect in testing and behaves badly afterwards. Reserve data you never touch during tuning, then test once on it and accept whatever comes back. Results are not guaranteed; past performance is not indicative of future results.
External references
- For background on this concept, see Sampling Error at Investopedia.
- For broader market context, see Standard Error on Wikipedia.

About the author
Written by Dominic Walsh, a Forex trader and MT4/MT5 indicator, Expert Advisor and script developer. Every tool on forexmt4systems.com is tested on live charts before release and ships with ready-to-use compiled MT4 (.ex4) and MT5 (.ex5) files. Learn more about the trader and developer behind this site.
How we build, test and correct every tool: Editorial & Testing Policy. Trading carries risk; see the disclaimer.