
Trading expectancy is the average result of one trade, stated as a single number. It answers one narrow question: across many repetitions, what does a rule tend to return per trade?
The arithmetic takes a minute to learn. Reading the number honestly takes longer, because it describes a long-run average and tells you nothing about your next ten trades.
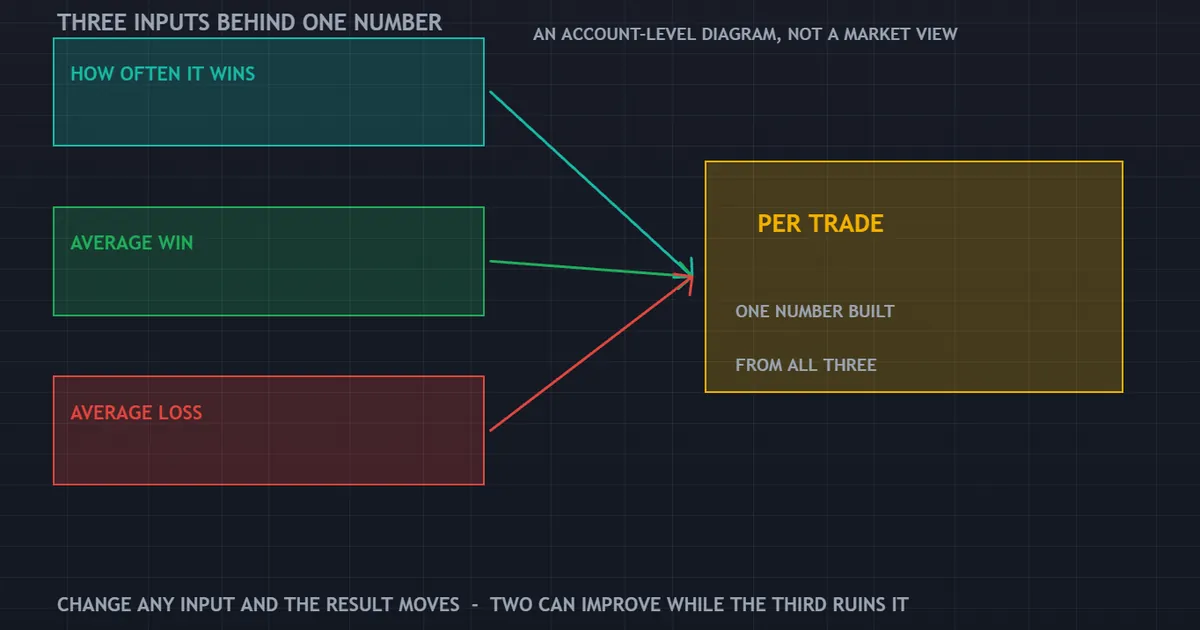
The panel above splits the figure into its parts. How often it wins, the average win and the average loss all feed one per-trade result.
What Trading Expectancy Actually Measures
Expectancy measures the centre of a distribution. Your individual trades scatter around that centre, and most of them land nowhere near it.
So a positive figure does not promise a profit on the next trade. It says that if the same conditions repeated forever, the average outcome would sit above zero.
Why an Average Feels Wrong
No single trade returns the average. A rule worth a fifth of one R per trade still produces winners, losers and scratches, and none of them equals a fifth of an R.
Think of it as the edge on a game. The edge decides the long-run outcome, while every round still goes either way.
That gap between the average and the experience causes most of the confusion around the term.
Expectancy Is Not a Forecast
A measured expectancy is a description of the past. It becomes a forecast only if you assume the market keeps behaving the way it behaved during your sample.
Markets change character without warning. So treat the number as a summary of what happened, not as a projection of what comes next.
The Unit Matters More Than the Value
An expectancy quoted without a unit is useless. A quarter of an R and a quarter of a currency unit are wildly different claims.
So always state the unit. Then state the trade count beside it, because the two travel together.
Most published figures skip both. That omission is rarely accidental, since a bare number sounds far more authoritative than an honest one.
The Formula in Plain Words
Expectancy is how often it wins times the average win, minus how often it loses times the average loss. The result is stated per trade.
Written as a line: expectancy equals (win share x average win) minus (loss share x average loss). Nothing else belongs in it.
The Three Inputs
You need three numbers from your trade list, and only three.
- The share of winning trades. Winners divided by total trades, counting scratches as they actually closed.
- The average winner. Total gross profit divided by the number of winners.
- The average loser. Total gross loss divided by the number of losers, written as a positive figure.
Every trade must appear once. Deleting the ugly ones is the fastest way to produce a number that means nothing.
Working It in R Multiples
R multiples make the math cleaner. One R is the amount you risked on that trade, so a trade that returns twice your risk is a 2R winner.
Convert every trade to R first. Then expectancy comes out in R per trade, and account size stops mattering.
Our note on R multiples in trading covers the conversion in detail. Once the list is in R, the rest is one subtraction.
Scratches and Partial Exits
Real trade lists are messier than the formula. Trades close at breakeven, and positions come off in two or three pieces.
Handle scratches by counting them as tiny winners or tiny losers, whichever the net result says. Never park them in a third bucket, because that quietly shrinks both averages.
Partial exits need one decision, made once. Either treat each exit as its own trade, or roll the pieces into a single weighted result.
Both approaches work. Mixing them inside one list does not.
A Worked Example
Take a rule that wins four trades in ten. The average winner returns 2.0R, and the average loser costs 0.9R.
Multiply: 0.4 times 2.0 gives 0.80. Then 0.6 times 0.9 gives 0.54.
Subtract, and expectancy comes to 0.26R per trade. Over one hundred trades that is 26R before any cost comes off.
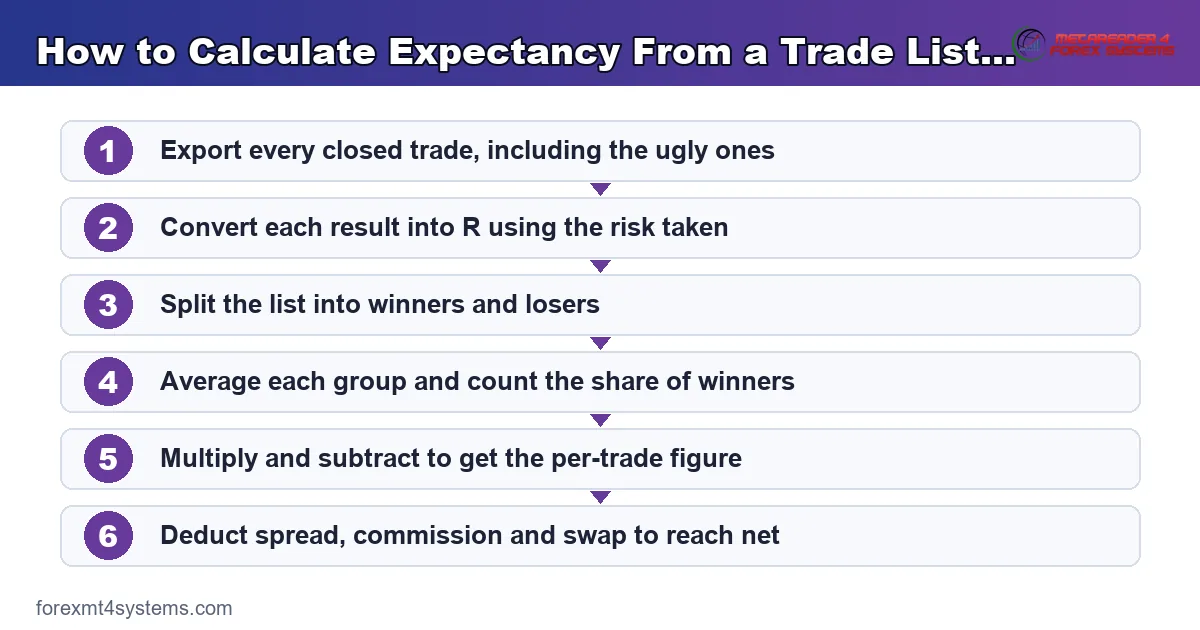
The flow above runs the same steps against a real trade list. You can also drop your own figures into the expectancy calculator rather than doing it by hand.
Two Rules Can Share One Expectancy
Here is the part that surprises people. Two rules with the same expectancy can feel completely different to trade.
The Second Rule
Take a second rule. It wins seven trades in ten, the average winner returns 0.8R, and the average loser costs 1.0R.
Run the math: 0.7 times 0.8 gives 0.56, and 0.3 times 1.0 gives 0.30. Expectancy again lands at 0.26R per trade.
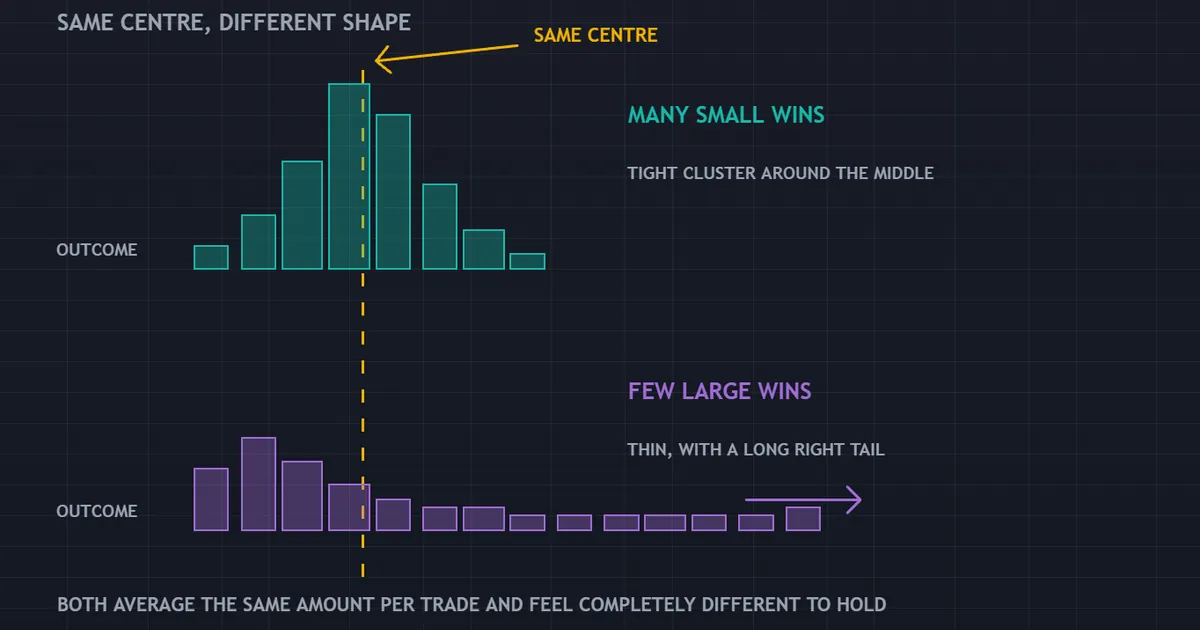
The panel above shows both outcome shapes side by side. Same centre, very different spread.
Why They Feel Different
The first rule loses six trades in ten. Runs of five or six losers in a row turn up regularly, and the account grinds down between the large winners.
The second rule loses three in ten. Long losing runs are rare, but a single bad loser wipes out several small wins.
Both rules earn the same average. Only one of them will suit your temperament, and no formula can tell you which.
The Practical Consequence
Choose the shape you can actually sit through. A rule you abandon during a losing run has an expectancy of zero, whatever the spreadsheet says.
So test the shape as well as the average. Look at the longest losing run and the deepest drawdown before you commit size.
Expectancy Against Profit Factor
Traders often quote profit factor instead. The two numbers describe the same trade list from different angles, so neither replaces the other.
What Profit Factor Reports
Profit factor is gross profit divided by gross loss. It is a ratio, so it carries no unit and no sense of scale.
A ratio of 1.4 says the winners outweighed the losers by forty percent. It does not say whether that came from six trades or six hundred.
What Expectancy Adds
Expectancy is stated per trade, so you can multiply it by frequency. That turns a ratio into something you can plan around.
Our note on what a good profit factor looks like covers the ratio side. Read both numbers together and the picture sharpens considerably.
When They Disagree
They rarely disagree in direction, though they often disagree in emphasis. A rule with a modest ratio and high frequency can out-earn a rule with a glorious ratio and four trades a year.
Frequency also raises cost drag. So the rule that looks better on paper sometimes loses once the charges land.
Expectancy and Sample Size Are One Topic
A measured expectancy carries an error band, and early on that band is enormous. Variance dominates before the edge shows through.
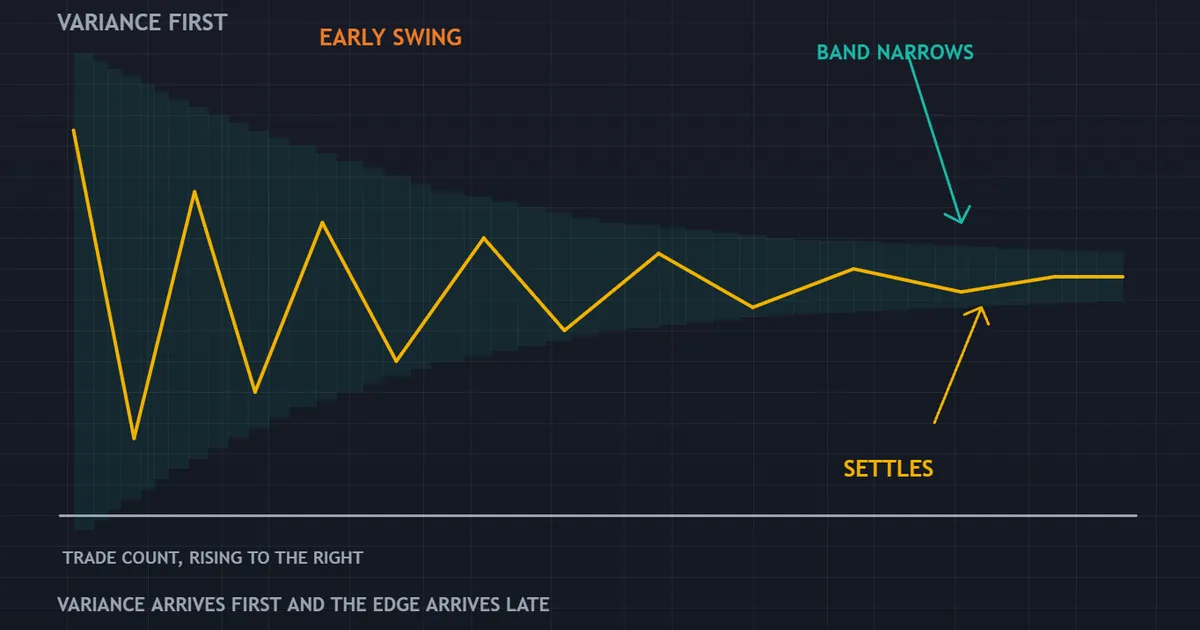
The panel above tracks a measured result against trade count. It swings wildly at first, then settles as the sample grows.
Twenty Trades Tell You Almost Nothing
With twenty trades, an edge of a quarter R is buried under noise. A rule with no edge at all can post a strong twenty-trade run, and often does.
So a short backtest cannot confirm anything. It can only reject a rule that fails badly and obviously.
How the Band Narrows
Uncertainty falls with the square root of the sample. Quadruple the trade count and the band halves, which is slower than most people expect.
Our companion piece on backtest sample size works through the counts in detail. The short version: hundreds, not dozens.
Fat Tails Make It Worse
Trade outcomes are not tidy. A handful of very large winners often carry the whole result, especially in trend-following rules.
Remove the three best trades and check what remains. If the edge disappears, your sample was carrying one lucky stretch.
Where Costs Enter the Number
Gross expectancy flatters every rule. Costs come off each trade, so the drag scales directly with how often you trade.
The Three Charges
Spread applies on entry and exit. Commission applies per side on many accounts. Swap applies to anything held past the daily rollover.
Convert all three into R and subtract them from the gross figure. That single step kills a large share of promising backtests.
Frequency Multiplies the Damage
A rule taking two trades a week pays cost twice a week. A rule taking forty trades a day pays it eighty times.
So a high-frequency edge has the thinnest margin for a wrong cost assumption. Our guide to backtesting transaction costs shows how quickly that drag compounds.
Slippage Belongs in the Figure Too
Spread, commission and swap are easy to model because they are published. Slippage is not, and it varies with speed and size.
Estimate it from your own fills rather than from a default. Compare the price you asked for against the price you received, then average the difference across a few hundred orders.
That single measurement often explains the gap between a tested figure and a live one.
Download the complete indicator database
Put these concepts on your charts. One email unlocks the full library of 1,380+ indicators with compiled MT4 and MT5 files, plus my TradingView scripts. No paywall, no spam, unsubscribe any time.
Get free access to my indicator database
One email unlocks 1,380+ free MT4, MT5 and TradingView indicators — the complete library. No single-tool download; you get the whole database.
Measuring Expectancy From Your Own Records
Your own trade log beats any published figure. It already contains your fills, your costs and your hesitation.
What to Export
Pull every closed trade with its entry, exit, size, stop distance and net result. Keep the timestamps, since they let you slice by session later.
A trade journal makes this trivial. Rebuilding the list from memory does not work.
Slice It Carefully, Once
Splitting the list by pair, session or setup is useful. Splitting it twenty ways until one slice looks good is not.
Decide your slices before you look. Otherwise you are optimising, and the result stops being a measurement.
Expectancy and Position Size Interact
The formula assumes constant risk per trade. Break that assumption and the measured figure stops describing anything real.
Constant Risk Keeps the Math Honest
Risk the same fraction on every trade and R stays comparable across the list. Vary it by instinct and the averages start reporting your confidence rather than the rule.
So fix the risk first. Then measure, and only then think about scaling.
A Positive Edge Still Ruins Accounts
Size too large and a normal losing run ends the account before the average arrives. The edge was real, and the account still died.
That failure mode has nothing to do with the rule. It comes entirely from the fraction risked per trade.
Scaling Up Changes the Inputs
Larger size sometimes worsens fills. A rule tested at minimum lots can degrade once orders start moving through thinner liquidity.
Re-measure after every meaningful size increase. Treat the old figure as history, not as a property of the rule.
How an Edge Decays
Expectancy is not a constant. It drifts, and it sometimes drifts to zero without any announcement.
Regime Change
A mean-reversion rule earns its keep in ranges. Let volatility double and the same rule keeps firing while the market stops obliging.
Nothing in the code notices. The trade list simply gets worse, one entry at a time.
Crowding
Popular patterns get traded harder. As more orders sit at the obvious level, the fills worsen and the follow-through shrinks.
That erosion is gradual. You see it as a slowly falling average rather than a sudden break.
Watching for Drift
Recompute expectancy on a rolling window rather than once. A rolling hundred-trade figure shows drift long before the lifetime average moves.
Set a review date and keep it. Reviewing only after a painful month means you always land on the worst possible sample.
Reading an Expectancy Table
The table below shows four rules with the same three inputs measured differently. Read the whole row, never one column.
| Share of winners | Average win | Average loss | Expectancy per trade | Character |
|---|---|---|---|---|
| 4 in 10 | 2.0R | 0.9R | 0.26R | Long losing runs, large winners |
| 7 in 10 | 0.8R | 1.0R | 0.26R | Frequent small wins, painful losers |
| 3 in 10 | 3.5R | 1.0R | 0.35R | Very long droughts, rare large wins |
| 9 in 10 | 0.2R | 1.6R | 0.02R | Looks strong, one loser undoes ten wins |
The last row is the trap. A high share of winners hides an edge close to zero.
Row three shows the opposite problem. Its edge is the strongest on the page, yet seven losers in ten will test anyone’s patience long before the average shows up.
So read the character column as seriously as the arithmetic. It describes what you will actually live through.
A Second Example Without R Multiples
Some traders prefer plain money terms. The method is identical, and only the unit changes.
The Trade List
Suppose fifty trades close over a quarter. Eighteen of them win, and thirty two of them lose.
Total gross profit across the winners comes to nine hundred units of account currency. Total gross loss across the losers comes to five hundred and forty units.
Running the Numbers
The average winner is fifty units, since nine hundred divided by eighteen gives fifty. The average loser is about seventeen units, from five hundred and forty divided by thirty two.
Winners make up 36 percent of the list, so losers make up 64 percent. Multiply: 0.36 times fifty gives eighteen, and 0.64 times seventeen gives about eleven.
Subtract and expectancy lands near seven units per trade before costs. Across fifty trades that is roughly three hundred and sixty units, which matches the raw net.
Now Take the Costs Off
Assume round-trip cost of two units per trade. That removes one hundred units across the sample, and per-trade expectancy falls from seven to five.
The rule survives, though the margin thinned by nearly thirty percent. Double the trade frequency and the same cost assumption starts doing real damage.
Common Mistakes When Reading Expectancy
Five errors turn a useful number into a misleading one. Each has a simple correction.
Quoting It Gross
Costs belong inside the figure. A gross expectancy is a marketing number, not a trading number.
Mixing Position Sizes
Sizing varies across most trade logs. Convert to R first, or the average win reflects your sizing habits rather than the rule.
Dropping the Outliers
People delete the worst trade as an accident. That trade belongs in the sample, because accidents recur.
Reading It as Monthly Income
Expectancy per trade times trades per month gives an expected monthly figure, and the word expected is doing heavy work there. Real months scatter widely around it.
Comparing Across Different Periods
A rule measured through a trending year and another measured through a quiet year are not comparable. Match the periods or drop the comparison.
What Expectancy Cannot Tell You
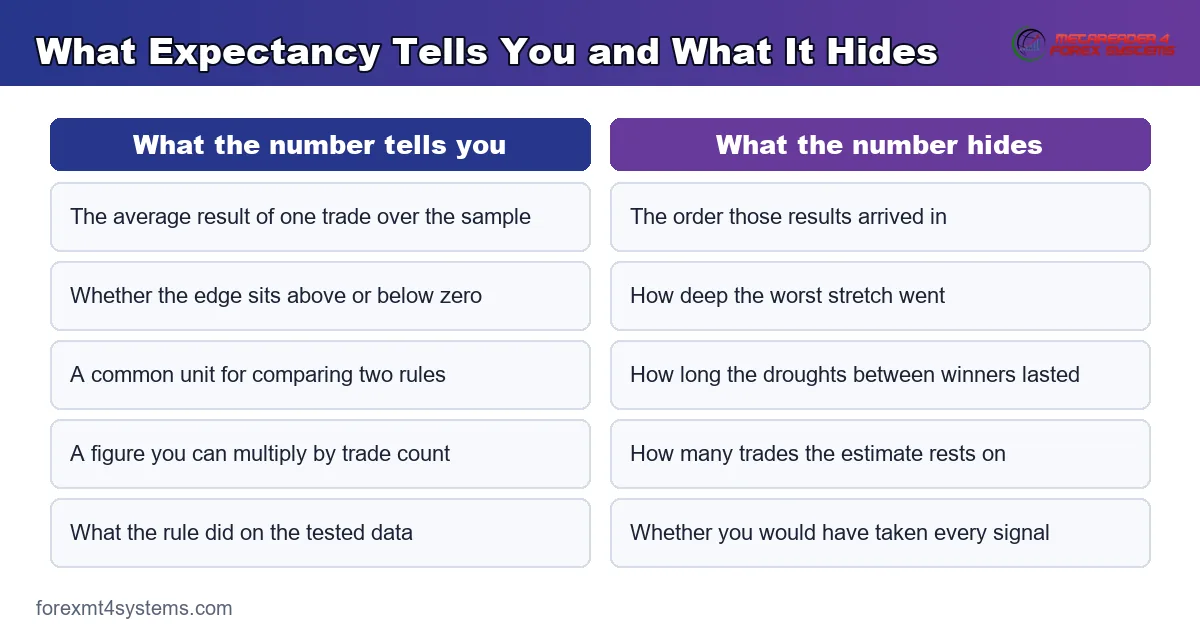
The number is narrow by design. Four things sit outside it entirely.
It Cannot Tell You the Path
Two rules with identical expectancy can produce very different drawdowns. Model the depth with our drawdown calculator before you decide anything.
It Cannot Tell You Whether the Edge Survives
A measurement covers the period you measured. Nothing in it speaks to next quarter.
It Cannot Tell You How You Will Behave
The formula assumes you take every signal. Most traders do not, and the gap between the tested rule and the traded rule is usually large.
It Cannot Rescue a Small Sample
Precision in the arithmetic does not create precision in the input. Four decimal places on thirty trades is decoration.
It Cannot Separate Skill From Conditions
A trend-following rule measured through a strong trending year looks superb. The same rule through a choppy year looks broken.
Expectancy reports the combination of rule and market. Splitting those two apart takes several years of data, and often more than that.
Fitting Expectancy Into a Testing Process
Expectancy is one output among several. It belongs beside the trade count, the longest losing run and the maximum drawdown.
Order of Operations
Measure gross expectancy first, then subtract costs, then check the sample size, and only then compare rules. Reversing that order produces confident nonsense.
The wider process sits in our guide to what backtesting is. Expectancy is the summary line, not the test.
Pair It With Risk of Ruin
A positive edge still ends an account if the size is wrong. Feed your figures into the risk of ruin calculator and check the survival odds at your chosen risk.
Strategy families behave differently here, and our forex trading strategies hub shows how the shapes vary between them.
FAQ
What is a good trading expectancy?
There is no threshold that applies everywhere, because the figure only means something next to trade count and cost. A quarter of an R per trade across several hundred trades after costs is a solid result for a discretionary rule. The same figure across thirty trades tells you almost nothing.
Can expectancy be positive while the account still loses?
Yes, and it happens often. Position sizing, a long losing run early, or a few trades taken outside the rules can all sink an account whose average trade is positive. The average describes the rule, while the equity curve records what you actually did with it.
Should I measure expectancy in currency or in R?
Use R for comparing rules and currency for planning. R strips out account size and position sizing, so two rules become comparable. Currency matters when you want to know what a month of trading might look like in your own account.
How many trades before the figure means anything?
Hundreds rather than dozens, and more when the outcomes are lumpy. Uncertainty falls with the square root of the sample, so going from twenty five trades to one hundred only halves the error band. A rule that relies on rare large winners needs a longer sample still.
Does a higher share of winning trades make a better rule?
Not on its own. A rule that wins nine times in ten can still carry an edge near zero if the rare loser is large enough to undo the wins. Read the share of winners, the average win and the average loss together, then judge the rule on the combined figure. Results are not guaranteed; past performance is not indicative of future results.
External references
- For background on this concept, see The Payoff Ratio in the BabyPips Forexpedia.
- For broader market context, see Testing Statistics Constants in the MQL5 Documentation.

About the author
Written by Dominic Walsh, a Forex trader and MT4/MT5 indicator, Expert Advisor and script developer. Every tool on forexmt4systems.com is tested on live charts before release and ships with ready-to-use compiled MT4 (.ex4) and MT5 (.ex5) files. Learn more about the trader and developer behind this site.
How we build, test and correct every tool: Editorial & Testing Policy. Trading carries risk; see the disclaimer.