
Backtesting transaction costs is the step most traders skip, and it is the step that decides whether a result survives. A rule that clears its costs by a hair on paper rarely clears them at all in practice.
Three charges do the damage: spread, commission and swap. Each one is small, and together they close the gap between an exciting curve and a flat one.
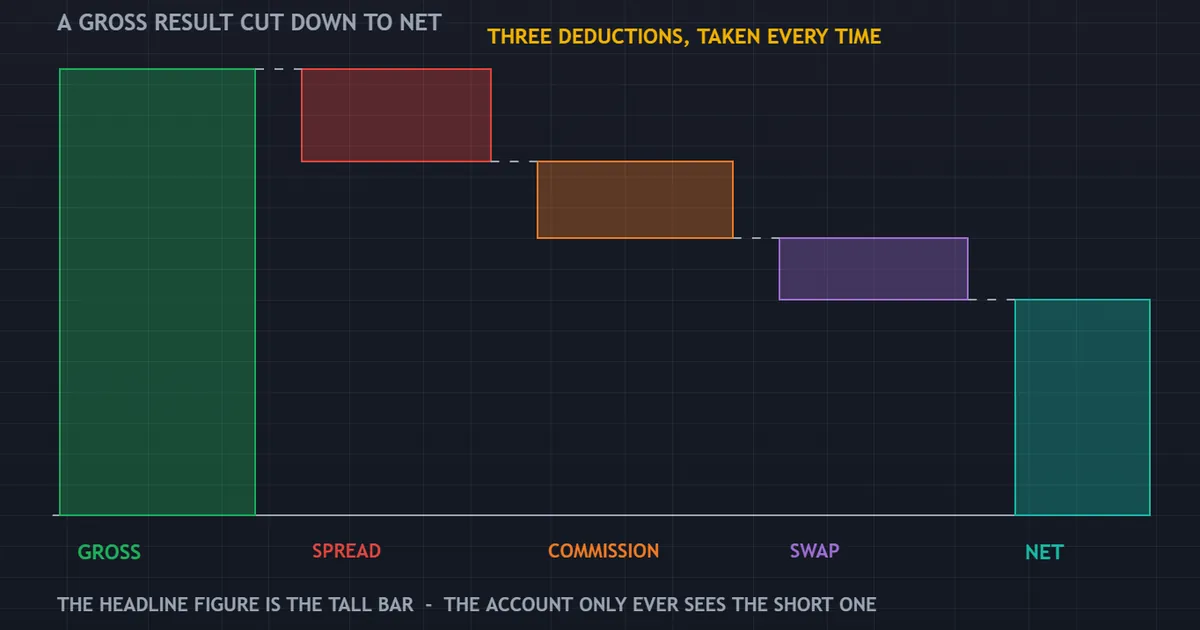
The panel above shows the shape of the problem. A tall gross bar loses a slice to each charge, and the net bar that remains is far shorter than the headline.
Why Backtesting Transaction Costs Changes the Answer
Costs do not shave a result evenly. They attack the thin edges hardest, which is exactly where most tested rules live.
So the ranking of two strategies can flip once charges land. The busier rule looked better gross, and the quieter one wins net.
Small Numbers, Large Effect
A cost of a tenth of an R per trade sounds trivial. Apply it across five hundred trades and it removes fifty R from the result.
Compare that against a gross edge of a quarter R per trade. Forty percent of the edge disappears into friction.
The Three Charges Explained
Each charge behaves differently, so treat them separately in your model. Lumping them into one number hides where the damage comes from.
Spread
Spread is the gap between bid and ask, and you pay it on entry and again on exit. It is the only cost that applies to every single trade without exception.
It also moves. Spread widens around data releases, at the daily rollover and through thin hours, and our note on why spreads widen covers the mechanics.
Commission
Raw and ECN style accounts charge commission per side. The spread looks tighter, and the total cost often lands in a similar place.
Compare the combined figure rather than either half. A spread comparison tool makes that arithmetic quick.
Swap
Swap applies to any position held past the daily rollover. It can credit or debit you, depending on the rate differential and the broker’s markup.
Most brokers charge three days of swap on one weekday, commonly Wednesday, to cover the weekend value date. A rule that holds trades for a week meets that charge every time.
Our page on swap in forex explains the calculation. You can size the effect on your own holding period with the swap calculator.
What the MT4 Tester Assumes About Cost
The Strategy Tester is precise about price and blunt about cost. Knowing which assumptions it makes stops a great deal of self-deception.
Fixed Spread by Default
The tester applies a fixed spread unless you configure it otherwise. So a backtest systematically understates cost during news and at the daily rollover.
That single default flatters every rule that trades around releases. Our walkthrough of the MT4 Strategy Tester covers where to change it.
No Requotes and No Rejections
Every order fills in a backtest. Real accounts see requotes on instant execution and outright rejections in fast conditions.
Those events cost you the trade rather than a few points. A rule whose best trades start in fast markets loses more than the arithmetic suggests.
Slippage Is Simply Absent
A backtest cannot contain slippage variation, requotes, a widening spread, or the trader’s own hesitation. None of those exist in a simulation.
So model slippage yourself from your own fills. Compare the price you requested against the price you received across a few hundred live orders, then average the difference.
Cost Drag Scales With Trade Count
Frequency is the multiplier. Cost per trade stays roughly constant, so the total scales directly with how often you trade.
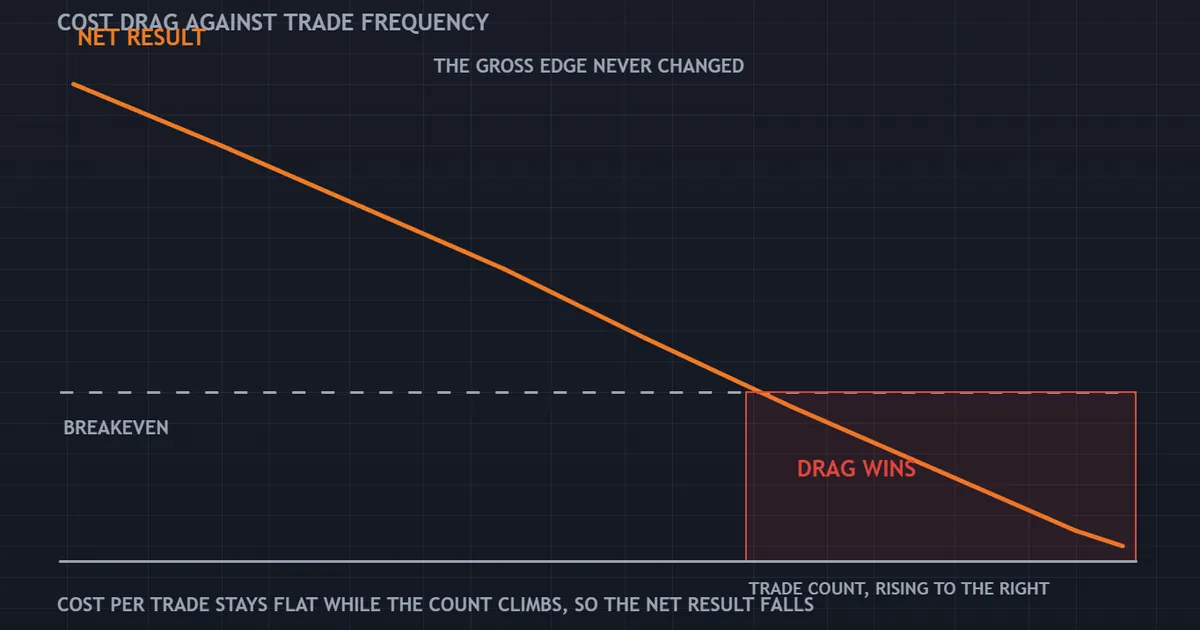
The panel above plots net result against trade frequency. That line falls as the count rises, even though the gross edge per trade never changes.
The Arithmetic
Take a gross edge of a quarter R and a cost of a tenth of an R. Net edge lands at 0.15R per trade, whatever the frequency.
Now scale it. Two hundred trades a year yields 30R net, while two thousand trades a year yields 300R net and needs the edge to hold two thousand times.
Why High Frequency Is Fragile
A busy rule has the least room for a wrong cost assumption. Underestimate cost by a fiftieth of an R and a scalping rule loses forty R across two thousand trades.
The same error costs a swing rule four R. So the fastest result in your test folder is the one most likely to be wrong.
A Frequency Table
The table below holds the gross edge constant and varies only the trade count and the cost assumption.
| Trades per year | Gross edge per trade | Cost per trade | Net edge per trade | Net R per year |
|---|---|---|---|---|
| 100 | 0.25R | 0.05R | 0.20R | 20R |
| 500 | 0.25R | 0.10R | 0.15R | 75R |
| 2000 | 0.10R | 0.06R | 0.04R | 80R |
| 2000 | 0.10R | 0.09R | 0.01R | 20R |
Read the last two rows together. A cost error of three hundredths of an R wipes out three quarters of the annual result.
Download the complete indicator database
Put these concepts on your charts. One email unlocks the full library of 1,380+ indicators with compiled MT4 and MT5 files, plus my TradingView scripts. No paywall, no spam, unsubscribe any time.
Get free access to my indicator database
One email unlocks 1,380+ free MT4, MT5 and TradingView indicators — the complete library. No single-tool download; you get the whole database.
The Break That Barely Cleared Its Costs
Range breaks look generous on a chart. Measured honestly, many of them are not.
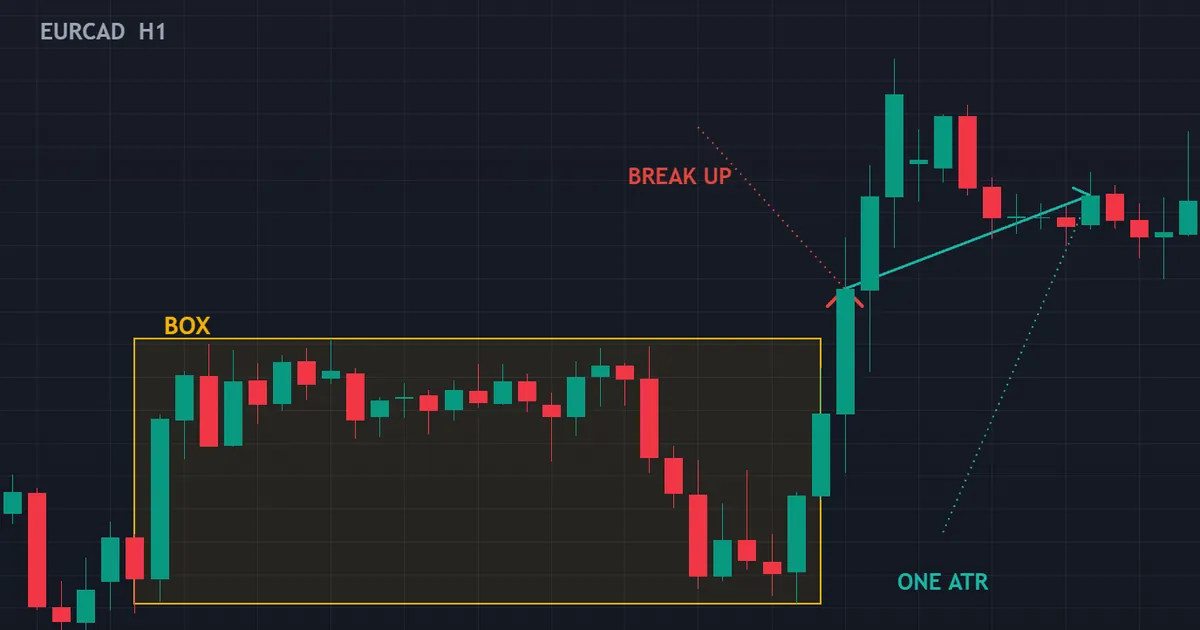
The box held for 28 bars, then price closed up out of it on 2026-07-29 and travelled 1.0 ATR further in that direction over the next 10 bars. That is a real EURCAD hourly break, and it moved about one average range beyond the box.
Why That Distance Matters
One ATR of follow-through is a modest reward. Once the spread on entry, the spread on exit and any commission come off, the margin thins considerably.
Hold the position overnight and swap joins the queue. A trade that clears its costs by a small amount is not a trade you can repeat carelessly.
Set the Bar Before You Test
Decide the minimum follow-through your rule needs, then check whether the market usually supplies it. That order stops you from tuning a target to fit a result.
Measure the distribution of follow-through across every break in the sample, not just the successful ones. Failed breaks belong in the average, and leaving them out is how a marginal idea starts to look strong.
The General Point
Small-target rules pay the same fixed cost as large-target rules. So the cost is a far larger share of a one-ATR trade than of a five-ATR trade.
Measure the average follow-through of your own setup, then divide the cost by it. That ratio tells you how much friction your idea can afford.
A Worked Cost Model
Numbers make this concrete. Here is one rule, modelled from the ground up.
The Setup
Assume a major pair rule with an eighty-point stop and a one hundred and sixty point target. It trades roughly four times a week, and it closes most positions inside the day.
Round-trip spread comes to three points at the hours it trades. Commission adds another point equivalent per round trip, so total friction is four points.
The Conversion
Four points against an eighty-point stop gives 0.05R per trade. Across two hundred trades a year that removes ten R.
Suppose the gross expectancy measured 0.22R per trade. Net expectancy lands at 0.17R, and the annual figure falls from 44R to 34R.
Now Break an Assumption
Say the real spread averages five points rather than three, because a quarter of the trades fire around releases. Friction rises to six points, or 0.075R per trade.
Net expectancy drops to 0.145R, and the annual figure falls to 29R. A two-point error in one input cost a third of the remaining edge.
Then Add Overnight Holds
Now assume a third of the trades sit through the rollover. Swap adds a small charge on those trades, and the triple-swap weekday adds more.
None of these steps is dramatic on its own. Stacked together, they turn a comfortable result into a marginal one, which is exactly the point.
Converting Costs Into R
Costs quoted in points are hard to compare across instruments. Converting them into R fixes that immediately.
The Conversion
Divide the round-trip cost in points by your stop distance in points. A four-point cost against an eighty-point stop is 0.05R.
Then subtract that figure from your gross expectancy. Our note on trading expectancy shows where it slots into the formula.
Tight Stops Cost More
Halve the stop distance and you double the cost in R. Nothing about the market changed, and the friction doubled anyway.
That relationship explains why very tight stops struggle. The reward has to stretch further to cover the same charge.
How to Model Costs Honestly
A decent cost model takes an afternoon. It also removes most of the surprises later.

The flow above lists the steps in order. Skip none of them, and record the assumptions beside the result so a future version of you can check them.
Use Pessimistic Numbers
Model the spread you meet at your worst trading hour, not the advertised average. Then add a slippage allowance on top.
If the rule survives the pessimistic model, you have something. If it only survives the optimistic one, you have nothing.
Re-Run at Two Cost Levels
Run the same test twice, once at a realistic cost and once at double it. The gap between the two results tells you how sensitive the rule is.
A robust rule loses some of its result. A fragile rule loses all of it.
Cost Varies by Session and by Instrument
One average cost figure hides a lot. Both the clock and the symbol move the number around.
The Clock
Spread tightens when the London and New York hours overlap. It widens through the late Asian session and again in the minutes around the daily rollover.
So a rule that trades quiet hours pays more than the daily average implies. Check your entry timestamps against the forex market hours tool before you settle on a figure.
The Symbol
Major pairs carry the tightest pricing. Crosses, exotics and metals cost several times more, and the gap widens further outside peak hours.
Test each symbol with its own cost. Applying a major-pair assumption to a basket of crosses is one of the quickest ways to invent an edge.
Converting to a Common Unit
Points are not comparable across symbols. Convert to your account currency with the pip value calculator, then convert that into R.
Only after both conversions can you compare a metals rule against a major-pair rule. Skipping the step makes the cheaper instrument look better than it is.
Where Cost Shows Up in a Report
Costs rarely appear as a line item. They arrive quietly, embedded in every other figure.
The Ratio Moves First
Gross profit falls and gross loss rises, so profit factor gets squeezed from both ends. A ratio of 1.6 gross can land near 1.2 net on a busy rule.
That is the same result described honestly. Nothing about the strategy changed between the two numbers.
The Average Loser Grows
Costs make winners smaller and losers larger. So the shape of your outcome distribution shifts as well as its centre.
Watch the average loser in particular. A rule with tight stops sees that figure move noticeably once friction is included.
Consecutive Losses Get Longer
Marginal winners become scratches, and scratches become small losers. Losing runs stretch as a direct consequence.
Check the longest run before and after the cost model. The difference often explains why a live account feels worse than the test looked.
Reducing Cost Without Fooling Yourself
Some cost reduction is real. Some of it simply moves the charge somewhere less visible.
Account Structure
Raw pricing with commission and wider pricing without it can total the same amount. Compare the round trip, not the advertised half.
Higher volume sometimes earns a rebate on commission. A rebate calculator shows whether that rebate matters at your trade count, and for most retail volumes it does not.
Trade Design
Wider stops and larger targets cut cost as a share of the trade. That change alters the strategy, so re-measure everything rather than assuming the edge survives.
Fewer, better trades beat more, thinner ones on cost grounds alone. The arithmetic favours patience even before you consider execution quality.
What Does Not Help
Switching venue to shave a fraction of a point rarely rescues a rule. If a fraction of a point decides the outcome, the edge was inside the noise all along.
The Costs People Forget
Four charges rarely appear in any model. Each one is small until it is not.

Triple Swap Days
One weekday carries three days of swap. Rules that hold across that day pay the charge fifty two times a year.
Currency Conversion
Profit in a currency other than your account currency gets converted. That conversion carries its own small margin on every trade.
Partial Fills and Scaling
Entering in three pieces pays three spreads. Scaling out pays them again on the way out.
The Cost of Waiting
Margin tied up in a slow trade earns nothing elsewhere. That opportunity cost never shows in a report, and it shapes real decisions.
Common Cost Mistakes in Testing
Five errors turn up constantly. Each has a one-line fix.
Using the Advertised Spread
Advertised figures describe good conditions. Pull the spread you actually met from your own trade history instead.
Forgetting Commission Entirely
Raw accounts show a tiny spread and charge separately. Testing one without the other produces a result that cannot exist.
Ignoring Swap on Held Positions
Swing rules meet swap on every trade. Our overview of forex trading costs covers how the charges combine.
Applying One Cost Across All Sessions
Cost varies by hour. A rule that trades the quiet hours pays more than the daily average suggests.
Reading Profit Factor Gross
Costs move the ratio downward, sometimes below the level that made it interesting. Our note on a good profit factor shows how far the figure can fall.
Testing on One Broker Feed
Every price history carries its own quirks. A rule tuned against one feed can behave differently against another, and the cost profile differs as well.
Run the same test against a second history if you can. Large disagreements point at data rather than at strategy.
Assuming Costs Stay Put
Pricing changes over time, and so do account terms. A model built three years ago describes conditions that may no longer exist.
Refresh the numbers each year from your own fills. It takes ten minutes and prevents a slow drift into fiction.
What Costs Cannot Explain
Cost modelling is necessary, and it is not a universal excuse. Two failures have nothing to do with friction.
A Rule With No Edge
If the gross result is already flat, cost is not the problem. Adding a better cost model to a broken idea changes nothing worth having.
A Fitted Result
An over-tuned rule fails on fresh data at any cost level. That failure comes from the fitting, not from the spread.
So diagnose in order. Check the gross edge, then the sample, then the costs, and only then the execution.
A Market That Moved On
Some rules simply stop working. Blaming friction for that is comfortable and wrong, because the gross result fell before the charges arrived.
Separate the two by plotting gross and net side by side. When both decline together, the market changed rather than the cost.
Building Cost Into the Rest of Your Process
Cost is not a footnote at the end of testing. It belongs in the design stage, because it shapes which ideas are worth testing at all.
Filter Ideas Early
Estimate the cost in R before you write any code. An idea whose average target is smaller than three times its cost rarely justifies the work.
That filter saves weeks. It also pushes you toward the setups where the arithmetic has room to breathe.
Write the Assumption Down
Record the cost you modelled next to every saved result. Six months later you will not remember, and the number will look far more authoritative than it deserves.
Include the date, the symbol and the hours traded. Those three details let you check the assumption instead of inheriting it.
Match the Tool to the Cost
Slower rules tolerate wider costs, and faster ones need tight ones. Our MT4 indicators library spans both speeds, so pick the family that suits the account you actually have.
FAQ
How much does spread really cost a backtest?
It depends entirely on your target size and trade count. A round-trip spread that equals a twentieth of your stop distance removes 0.05R per trade, which is modest at one hundred trades a year and severe at two thousand. Convert the spread into R first, then the answer becomes obvious.
Does the MT4 Strategy Tester include commission and swap?
Swap comes from the symbol settings, and commission depends on how the account and the tester are configured, so check both before trusting a report. The spread is fixed by default, which understates cost during news and at the daily rollover. Set those three fields deliberately rather than accepting whatever appears.
Should I test with a pessimistic cost assumption?
Yes, as the main run. Model the spread you meet at your worst hour, add a slippage allowance, and include commission per side where the account charges it. A rule that only survives optimistic assumptions has already told you what it is.
Why do high-frequency strategies fail more often after costs?
Because cost drag scales with trade count while the edge per trade does not. A small error in the cost estimate gets multiplied by every trade, so a busy rule can lose most of its result to an assumption that was wrong by a fraction of a point. Slower rules absorb the same error easily.
Can better execution rescue a rule that fails on costs?
Sometimes, though rarely by as much as people hope. Tighter pricing and better fills can recover part of the gap, and they cannot create an edge that was never there. Fix the gross result first, then reduce friction, and treat any remaining shortfall as an answer rather than an obstacle. Results are not guaranteed; past performance is not indicative of future results.
External references
- For background on this concept, see Market Impact in the BabyPips Forexpedia.
- For broader market context, see Symbol Properties in the MQL5 Documentation.

About the author
Written by Dominic Walsh, a Forex trader and MT4/MT5 indicator, Expert Advisor and script developer. Every tool on forexmt4systems.com is tested on live charts before release and ships with ready-to-use compiled MT4 (.ex4) and MT5 (.ex5) files. Learn more about the trader and developer behind this site.
How we build, test and correct every tool: Editorial & Testing Policy. Trading carries risk; see the disclaimer.