
Every tester report prints one ratio near the top. Traders latch onto it, quote it in forums, and compare it across systems that share almost nothing.
So what is a good profit factor? The honest answer starts with the formula, because the number means nothing until you know how it was built and how many trades went into it.
What Is a Good Profit Factor? Start With the Formula
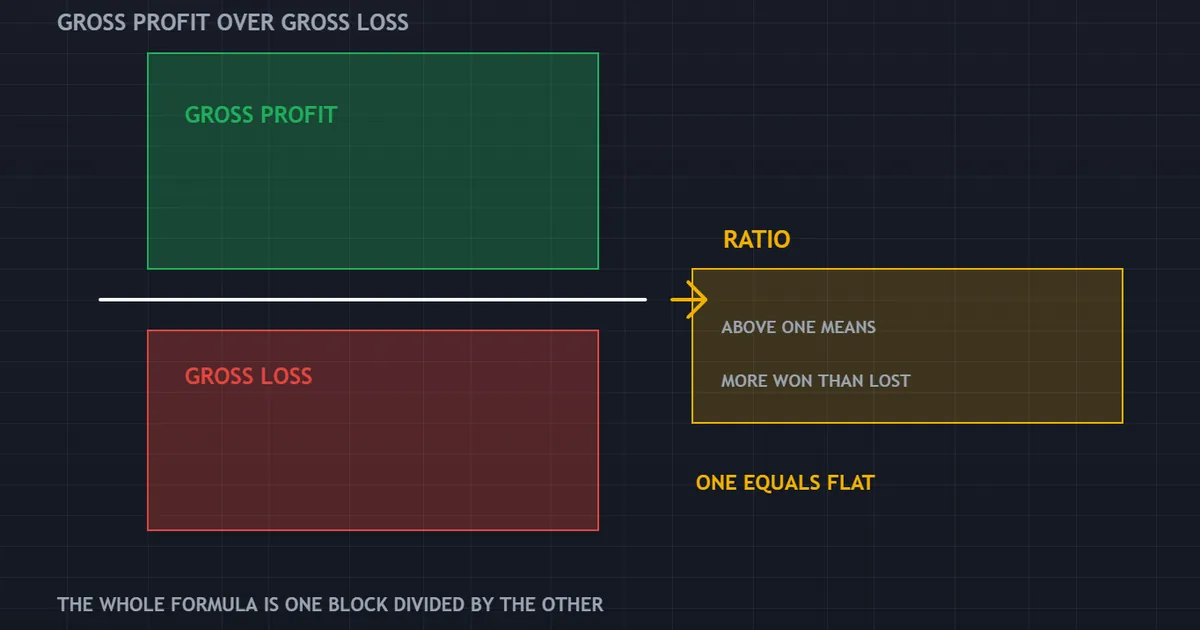
Profit factor is gross profit divided by gross loss. Nothing else enters the calculation.
Gross profit adds up every winning trade. Gross loss adds up every losing trade, as a positive number.
A Small Worked Example
Take forty trades. The winners together made twelve thousand four hundred units.
The losers together lost eight thousand units. Divide one by the other and the ratio comes out at 1.55.
That is the whole sum. The ratio says the winners covered the losers roughly one and a half times over.
What the Ratio Means at Each Level
A ratio of one means the winners exactly covered the losers. The account finished flat.
Below one, the losers won. Above one, the winners did.
Notice how little that tells you. It says nothing about how the result arrived, or whether it repeats.
The ratio also has no upper bound and no units. That makes it easy to quote and easy to misread, which explains why it travels so far in forum posts.
Where the Formula Breaks
A run without a single losing trade leaves the denominator at zero. Some reports then show a blank, some show a very large figure, and neither means much.
Treat that output as a warning. It usually means the sample is tiny or the test has a bug.
Why No Single Number Works as a Rule
Forums quote thresholds constantly. Someone will tell you that anything above a certain level is fine.
Ignore that. A ratio only carries meaning alongside four other facts.
The Four Facts You Need
First, the trade count. Second, whether the figure includes costs.
Third, the worst decline along the way. Fourth, whether one huge winner produced most of the gross profit.
Strip any of those away and the ratio floats free. Two systems can print the same figure and behave like different animals.
The Same Number, Two Systems
System A takes six hundred small trades a year. Its ratio sits at 1.25.
System B takes eleven trades a year. Its ratio also sits at 1.25.
The first number rests on a real sample. The second rests on almost nothing, so the two claims are not the same claim at all.
Five Checks Before You Trust the Ratio
Run through these in order. They take a minute and catch most of the traps.

Check the Trade Count
Look for the total trades line first, not the ratio. Under thirty trades, treat the whole report as a sketch.
Check the Costs
Ask whether spread, commission and swap all sat in the test. A gross figure and a net figure can differ enormously.
Check the Largest Winner
Divide the biggest single win by the gross profit. If one trade supplied a third of it, the ratio describes that trade rather than the system.
Check the Worst Decline
Find the deepest decline and the longest losing run. A strong ratio reached through a long, deep trough is a ratio you would never have collected.
Check the Period
Note which years the test covered. A ratio earned across one trending year says little about a range-bound one.
Where the Ratio Sits in an MT4 Report
The Strategy Tester prints the ratio in the results tab. Several nearby lines change how you should read it.
The Lines to Read First
Total trades comes first. Then gross profit and gross loss, which are the two numbers behind the ratio.
Maximal drawdown and the longest losing run sit further down. Read all five together or read none of them.
Modelling Quality and Mismatched Charts
The header shows a modelling quality percentage. Around ninety percent is the practical ceiling on Every tick using MT4’s own one-minute history.
Open prices only shows n/a instead, since it evaluates at each bar open and nowhere else. Higher percentages come from real tick data imported through third-party tools.
Mismatched chart errors point at holes in the history. That line describes your data rather than your strategy, so fix it before reading the ratio at all.
The Spread Setting
Check which spread the run used. A test at one point, on a pair that usually trades wider, lifts every line in the report including this one.
Note the commission setting as well, because MT4 keeps it outside the spread field. A raw-spread account with a per-lot commission needs both entered, and leaving one out quietly inflates the result.
Sample Size Changes the Claim Entirely
This is the point most articles skip. The same ratio measured over twenty trades and over five hundred trades are two different statements.

Twenty Trades
Twenty trades is a handful. Shuffle the order and the picture changes. Remove the best two and the ratio can fall below one.
So a strong ratio over twenty trades tells you the last twenty trades went well. It carries almost no information about the next twenty.
One Hundred Trades
At a hundred trades the picture firms up. One outsized winner still moves the number, though less.
Test that directly. Remove your three largest wins and recalculate, then see whether the conclusion survives.
Five Hundred Trades
Five hundred trades starts to look like evidence. Single trades barely move the ratio now.
Even here, a caveat applies. Five hundred trades taken inside one market regime still describes that regime and nothing wider.
How to Report It Honestly
Always quote the ratio with the trade count beside it. Our guide to backtest sample size sets out how many trades different strategies need.
Anyone quoting a bare ratio has left out the most important half. Ask for the count before you ask anything else.
Costs Pull the Ratio Down
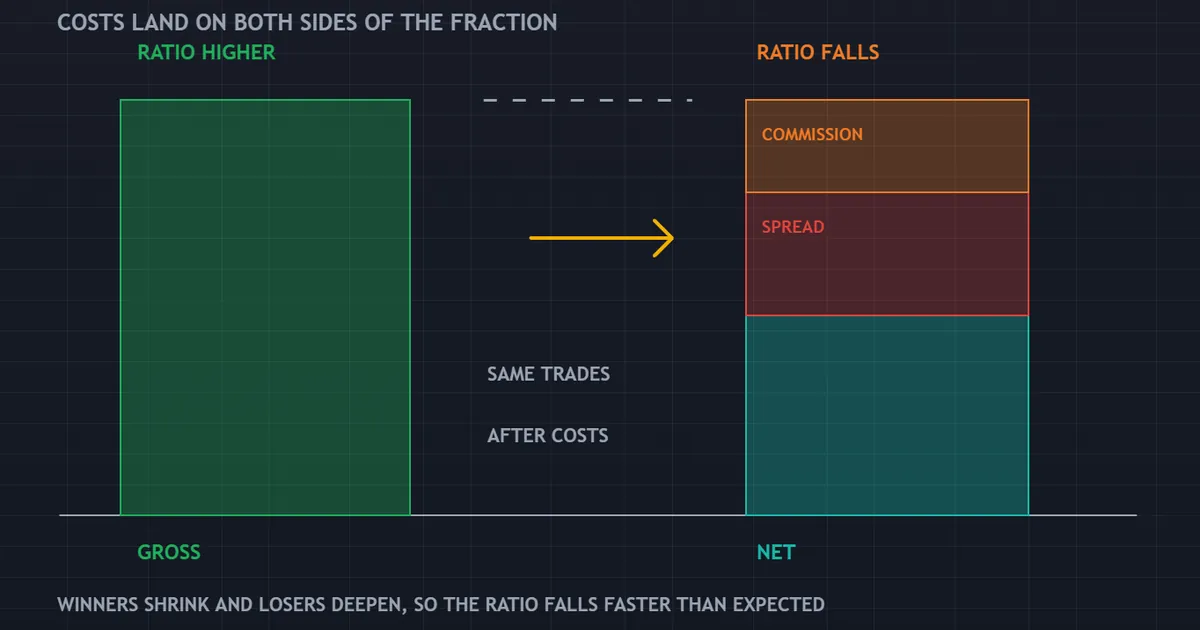
A gross ratio always flatters. Every cost you add lands on both sides of the fraction, and both effects push the same way.
Where the Cost Lands
Spread shrinks each winner and deepens each loser. Commission does the same. Swap adds a small charge to every night a position stays open.
So gross profit falls while gross loss rises. The ratio therefore drops faster than a quick glance suggests.
A Worked Cost Example
Return to the earlier example. Gross profit twelve thousand four hundred, gross loss eight thousand, ratio 1.55.
Now add a round-trip cost of fifty units per trade across forty trades. That removes two thousand units in total.
Split it roughly by the win and loss counts. Gross profit falls to around eleven thousand three hundred and gross loss climbs to around eight thousand nine hundred.
The ratio lands near 1.27. One modest cost assumption took nearly a fifth off the headline.
Frequency Decides the Damage
A rule holding trades for weeks pays that cost rarely. A rule taking twenty trades a day pays it constantly.
So the same cost per trade can barely dent one system and wreck another. Our guide to backtesting transaction costs works through the arithmetic in full.
Work out your round-trip cost once, in the same units as your average win. Comparing those two figures directly answers most questions about whether a rule can survive at all.
A rule whose average win sits at five times the round-trip cost has room to breathe. A rule whose average win sits at one and a half times that cost has none, and the ratio will show it the moment costs go in.
The Tester Uses a Fixed Spread
MT4’s Strategy Tester applies a fixed spread unless you tell it otherwise. Real spreads widen around news and around the daily rollover.
That gap flatters short-term rules most of all. Our guide to the spread in forex explains when the widening usually hits.
Download the complete indicator database
Put these concepts on your charts. One email unlocks the full library of 1,380+ indicators with compiled MT4 and MT5 files, plus my TradingView scripts. No paywall, no spam, unsubscribe any time.
Get free access to my indicator database
One email unlocks 1,380+ free MT4, MT5 and TradingView indicators — the complete library. No single-tool download; you get the whole database.
What a Profit Factor Never Tells You
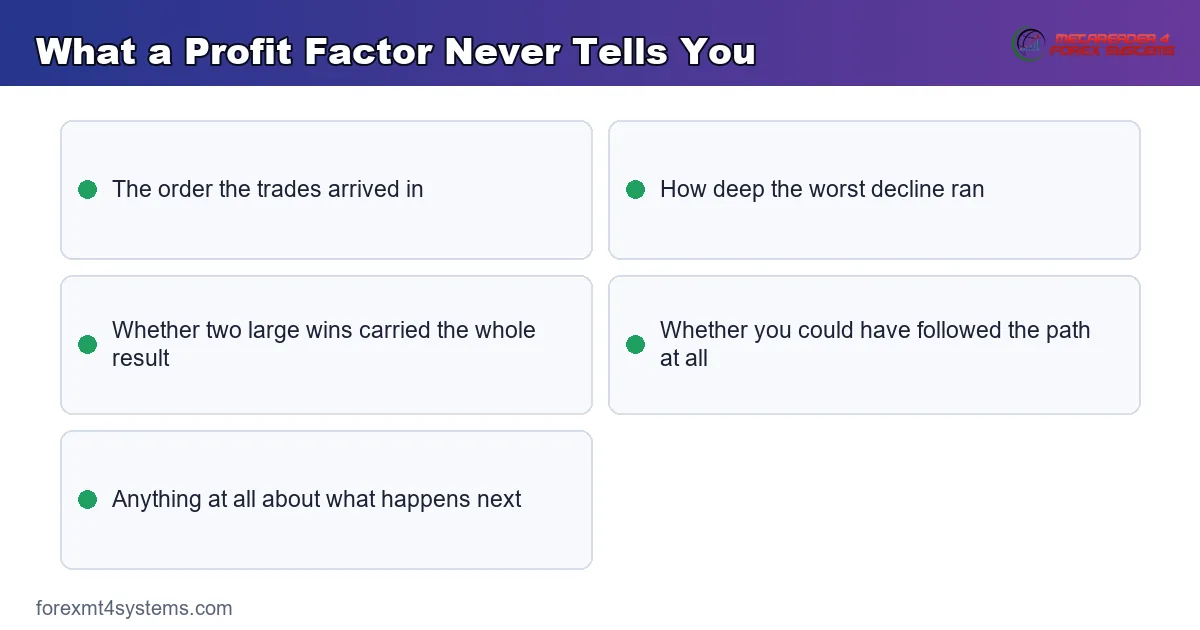
The ratio is one summary of a trade list. Several important things vanish inside it.
The Order of the Trades
Profit factor treats the trade list as a bag of numbers. Order does not enter the sum at all.
Yet order decides whether you survive. Ten losses in a row early on ends many accounts, whatever the final ratio says.
The Depth of the Decline
Two systems with the same ratio can dig very different holes. Our drawdown calculator shows what each hole demands in recovery.
How the Wins Were Distributed
A ratio built on many small wins behaves nothing like one built on two enormous ones. The second version depends on catching rare events that may not recur.
Whether You Could Trade It
A fine ratio reached through a nine-month flat stretch is a ratio most traders abandon before collecting. The report never mentions that part.
What Happens Next
Nothing in the ratio predicts live results. It measures a finished list of trades, and the market owes that list nothing.
How Trading Style Shifts the Picture
The same ratio means different things to different systems. Style changes both the sample and the cost load.
Scalping and Intraday Rules
These build a large sample quickly, which helps a great deal. They also pay the spread constantly, which hurts.
A gross ratio for a scalping rule is close to meaningless. Net figures carry all the weight here, and small cost changes swing them hard.
Swing Rules
Swing systems pay costs rarely and gather trades slowly. So a solid figure over two hundred swing trades carries real weight, though it may take years to collect.
Overnight charges enter the picture here. A rule holding for a week pays them repeatedly, and one side of a pair usually pays more than the other.
Position and Trend Rules
Trend systems produce lopsided trade lists. Many small losses fund a few very large wins, so the ratio leans heavily on catching those few.
Check what happens when you remove the top three trades. If the ratio collapses, the system depends on rare events, and the sample must be long enough to contain several of them.
Profit Factor Against Expectancy
Two summaries compete for attention. They answer different questions, so keep both.
What Each One Says
Profit factor is a ratio of totals. It tells you how much the winners covered the losers by.
Expectancy is an average per trade. It tells you what one trade is worth on average, in money or in risk units.
Why Expectancy Travels Better
Expectancy scales with trade count directly. Multiply it by the number of trades you expect and you get a rough forecast of the total.
Profit factor resists that. Our free expectancy calculator builds the per-trade figure from how often it wins and the average size of each outcome.
Use Them Together
Read the ratio first as a sanity check. Then read expectancy to size the opportunity, and read the worst decline to size the risk.
Our guide to trading expectancy covers the arithmetic step by step.
Three Reports With the Same Ratio
Numbers make the point better than argument. Here are three tests that all print 1.45.
Report One
Six hundred and twenty trades over eight years. Costs included, the largest win worth two percent of gross profit, and a shallow worst decline.
This version repays study. Nothing single-handedly produced the result.
Report Two
Twenty-six trades over four months. Costs excluded, with the largest win worth forty-one percent of gross profit.
Remove that one trade and the ratio drops under one. So the report describes a trade rather than a system.
Report Three
Four hundred trades over three years, costs included. The ratio holds up, yet the worst stretch ran flat for eleven months.
The arithmetic works fine. Sitting through eleven flat months is the part that does not.
| Report | Trades | Costs included | Largest win share | Worst stretch | Verdict |
|---|---|---|---|---|---|
| One | 620 | Yes | 2 percent | Short and shallow | Worth a forward test |
| Two | 26 | No | 41 percent | Unknown | Not yet meaningful |
| Three | 400 | Yes | 6 percent | Eleven months flat | Sound but hard to follow |
All three print the same ratio. Only one of them supports a decision.
Conditions Under Which a Number Means Something
Rather than quote a threshold, set conditions. A ratio earns attention only when all of these hold.
| Condition | Why it matters |
|---|---|
| The trade count sits in the hundreds | Small samples move with one or two trades |
| Spread, commission and swap all sat in the test | Gross ratios flatter every strategy |
| No single trade supplied a large share of gross profit | Otherwise the ratio describes one lucky trade |
| The test spans several market conditions | One regime teaches you about one regime |
| The parameters were not tuned to this data | Fitted numbers rarely repeat |
| The worst decline is one you could sit through | An untradeable path never delivers its ratio |
| The same ratio appears out of sample | Held-back data is the only real check |
Miss two or three of those and the number becomes decoration. Meet them all and a modest ratio beats an impressive one that meets none.
Common Mistakes With the Ratio
Six habits turn a useful summary into a misleading one. Each shows up constantly.
- Comparing ratios across strategies with different trade counts. The comparison is not like for like.
- Quoting a gross figure. Costs move the ratio more than most traders expect.
- Optimising directly for the ratio. That pushes the optimiser towards rare, large winners and fragile settings.
- Ignoring the worst decline. A path you cannot follow never pays out.
- Treating a very high figure as good news. Extreme values usually flag a tiny sample or a data problem.
- Reading it as a forecast. The ratio describes a finished list, nothing more.
The last one causes the most damage. Our risk of ruin calculator shows how a strategy with a decent ratio can still fail at the wrong position size.
Putting the Number in Its Place
Profit factor works well as a filter and badly as a verdict. Use it early and lightly.
As a First Screen
A ratio well below one, on a large sample with honest costs, ends the discussion quickly. That is a useful minute saved.
As a Stability Check
Split the test into halves or thirds and calculate the ratio for each part. A figure that holds roughly steady across parts is worth far more than a strong overall figure built in one lucky stretch.
As One Line in a Fuller Picture
Record the ratio beside trade count, expectancy, the worst decline and the longest losing run. Our guide to R-multiples shows how to express all of them in risk units.
Traders who want the underlying rules drawn on a chart can browse our MetaTrader indicators library while the testing runs.
FAQ
What profit factor should I aim for?
Set conditions rather than a target number. A modest ratio on hundreds of trades, with full costs included and a decline you could sit through, beats a headline figure built on thirty trades with no costs. Aiming at a number also tempts you to optimise towards it, which usually produces fragile settings rather than a better strategy.
Is a very high profit factor a good sign?
Usually it is a warning. Extreme values tend to come from tiny samples, missing costs, a data error or a strategy that avoids taking losses by holding them open. Check the trade count, the largest single win and the deepest decline before treating any unusually high figure as good news.
Does profit factor include spread and commission?
Only if the test included them. Many published figures are gross, which flatters every strategy and flatters frequent traders most. Add your real round-trip cost, recalculate, and compare the before and after figures. The size of that drop tells you how much of the apparent edge belongs to the broker.
Can I compare profit factors between two strategies?
Only when the samples are comparable. Match the period, the cost assumptions and roughly the trade count, then compare. A scalping rule with six hundred trades and a swing rule with twenty trades cannot be ranked by this number, because one figure rests on evidence and the other rests on chance.
What is the difference between profit factor and expectancy?
Profit factor divides gross profit by gross loss, so it is a ratio of totals. Expectancy averages the outcome of a single trade, usually in money or in risk units. Expectancy scales with trade count and therefore helps with planning, while the ratio works better as a quick screen. Keep both, along with the worst decline.
Can I optimise a strategy for profit factor?
You can, and it usually backfires. Optimising for the ratio pushes the search towards settings that dodge small losses and hold on for rare large wins. That combination looks elegant in history and behaves badly live. Optimise for something steadier, such as a risk-adjusted result, then read the ratio afterwards as a description rather than a target.
What if my report shows almost no losses?
Then the denominator is tiny and the ratio becomes unstable. In most cases the cause is a short sample, a test that ended while trades were still open, or a rule that avoids booking losses by holding them. Lengthen the test, check how open positions were handled at the end, and look at the largest open loss rather than the ratio.
Does a good profit factor in a backtest mean the strategy will work live?
No. The ratio summarises a finished list of historical trades under modelled fills and a fixed spread. Live trading adds variable spread, slippage, requotes and your own decisions, all of which push the figure down. Treat a solid ratio, measured across a large sample with honest costs, as a reason to forward test rather than as a verdict. Then review how often it wins and the average size of each outcome across the live record too. Results are not guaranteed; past performance is not indicative of future results.
External references
- For background on this concept, see Profit Factor in the BabyPips Forexpedia.
- For broader market context, see The Law of Large Numbers at Corporate Finance Institute.

About the author
Written by Dominic Walsh, a Forex trader and MT4/MT5 indicator, Expert Advisor and script developer. Every tool on forexmt4systems.com is tested on live charts before release and ships with ready-to-use compiled MT4 (.ex4) and MT5 (.ex5) files. Learn more about the trader and developer behind this site.
How we build, test and correct every tool: Editorial & Testing Policy. Trading carries risk; see the disclaimer.