
Optimise a strategy across ten years of history and the result will look excellent. That number tells you very little, because the same history picked the settings.
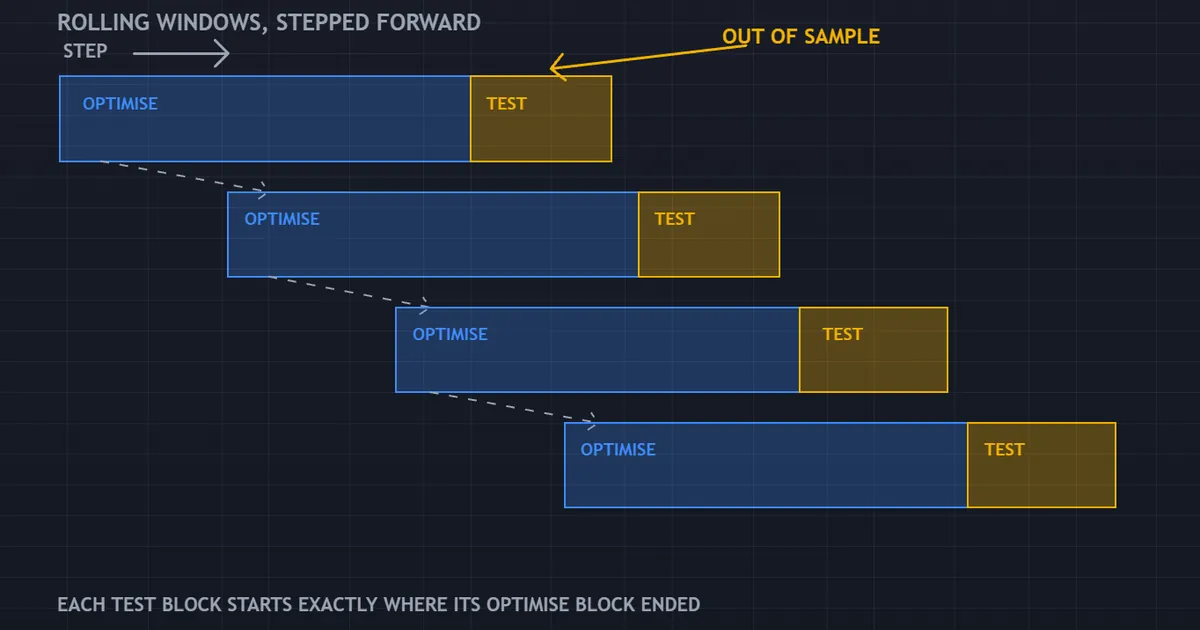
Walk forward analysis exists to break that circle. It fits parameters on one block of bars, scores them on the next block the optimiser never touched, then steps forward and repeats the pair until the history runs out.
What Walk Forward Analysis Actually Does
An optimiser hunts for the parameters that fitted the past best. That is its only job, so it hands back a flattering answer whether or not a real pattern exists underneath.
The method hides data from that search. Parameters come from one window, while the score comes from bars the search never saw.
The Two Windows
One window supplies the parameters. Call it the optimise window, since fitting is all it does.
The next window then measures those parameters on fresh bars. Nothing about that second window feeds back into the first.
So the second number carries information the first cannot. In short, one window runs an exercise in fitting and the other runs a small experiment.
Why One Split Is Not Enough
A single train-and-test split hands you exactly one out-of-sample result. If it looks strong, luck remains a perfectly good explanation.
Repeating the split across the whole history changes the picture. Each repetition adds another untouched result, and a run of them carries far more weight than any single score.
Our guide to curve fitting in trading covers the failure this method targets. Read it first if the phrase is new to you.
Why an Optimiser Always Finds Something
Understanding the failure mode makes the cure obvious. So it pays to look at what an optimiser really does across a few thousand runs.
The Arithmetic of Searching
Suppose a rule carries four inputs and each one accepts twenty values. That grid holds one hundred and sixty thousand combinations.
Some of them will look wonderful on any history, including history produced by a coin. The best of a large search reflects luck as much as merit.
Noise Wears the Same Clothes as Edge
A backtest cannot label which profits came from a repeatable pattern. Both kinds of profit draw the same rising line.
An optimiser therefore rewards whichever combination absorbed the most noise. That combination rarely repeats, because noise itself does not repeat.
Hiding Data Is the Only Real Defence
Other fields solve this by holding data back and cross-validating. Markets add a wrinkle, since the order of the data matters and you cannot shuffle it.
Walking the split forward respects that ordering. Each test block sits after its optimise block in time, exactly as live trading would.
The Rolling Loop, Step by Step
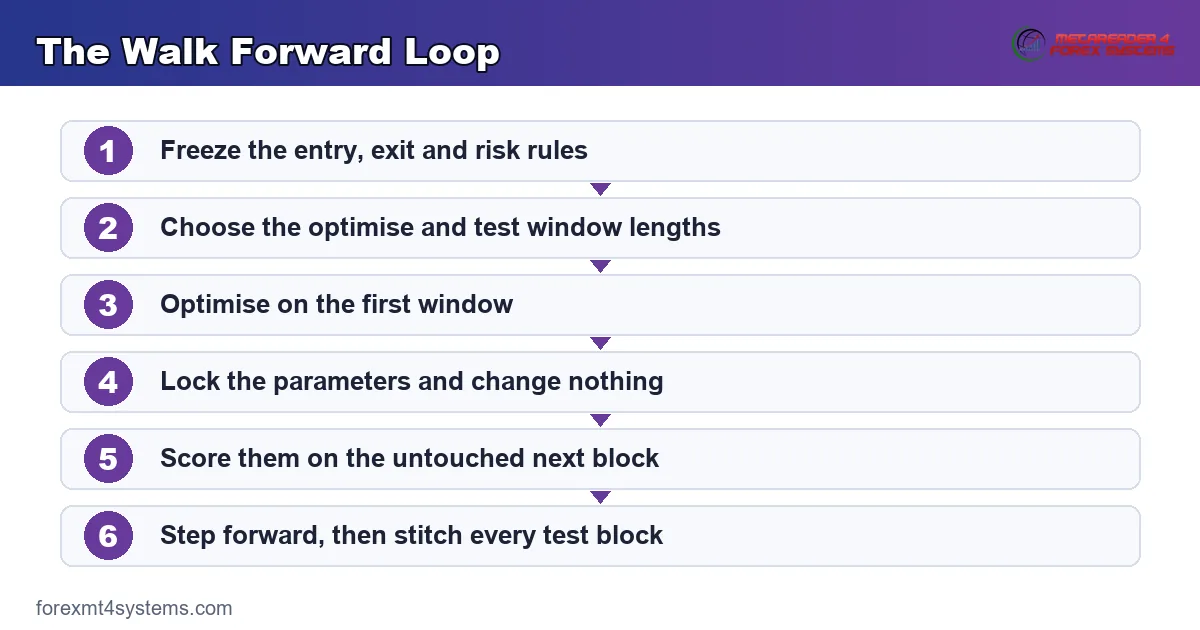
Five steps describe the whole procedure. None of them demands unusual software, though a tester that automates the loop saves hours of clicking.
Step One: Freeze the Rules
Write the entry, the exit and the risk rules before any optimiser runs. Only numeric parameters may move afterwards.
Adding a rule midway turns the exercise into ordinary curve fitting with extra steps. So keep the structure fixed and let the numbers vary.
Step Two: Choose the Window Lengths
Pick an optimise length and a test length before you look at any output. A common shape uses four parts optimise to one part test.
Both lengths must carry enough trades to mean anything. A test window holding three trades measures noise and nothing else.
Step Three: Optimise, Then Lock
Run the optimiser on the first window and record the parameters it picks. Then lock them, because touching them later contaminates everything downstream.
Choose the selection rule in advance too. Best net result, best drawdown-adjusted result and best parameter stability each point at different settings.
Step Four: Score on Untouched Bars
Apply the locked parameters to the following block. Record what happens and change nothing.
Resist the urge to peek and re-run. A second attempt on the same block destroys the property that made the block useful.
Step Five: Step Forward
Slide both windows ahead by the length of the test block. Repeat until the data ends.
Ten or twelve repetitions across a decade is typical. Fewer than five leaves you with very little to judge.
Reading the Stitched Out-of-Sample Path
Join every test block end to end and one continuous path appears. That stitched path is the only result worth quoting to anyone.
What the Panel Above Shows
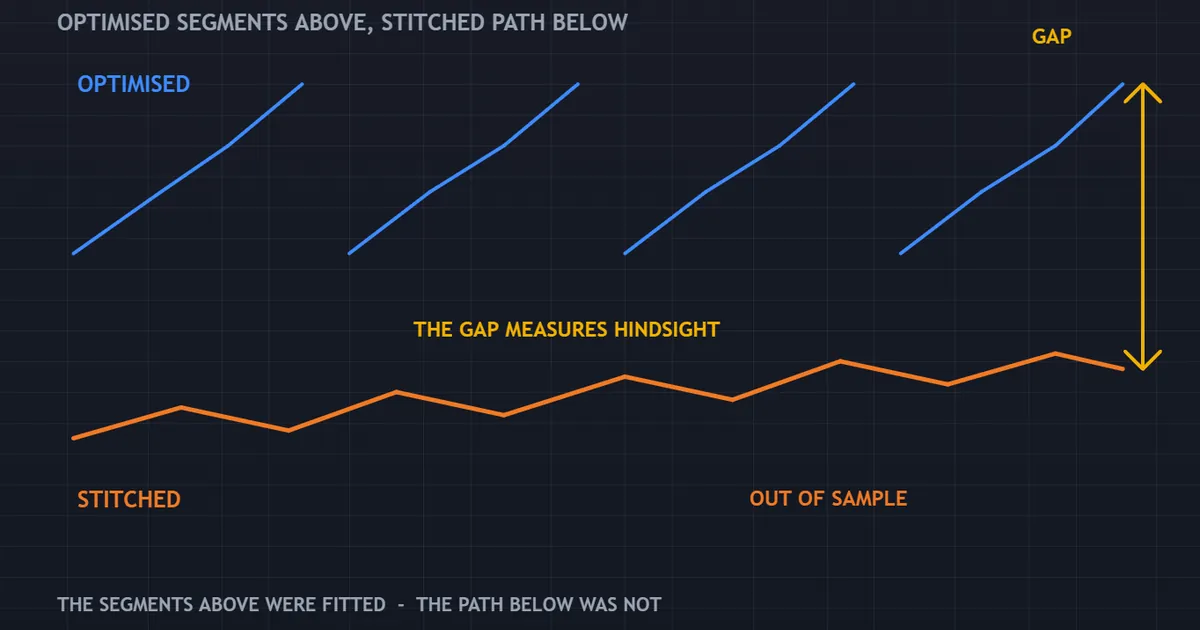
The optimised segments run across the top of that panel. Underneath them, the stitched out-of-sample segments join into a single path that sits clearly lower.
The distance between the two lines measures hindsight. Nothing more mysterious than that produces it.
Why the Stitched Path Looks Worse
Every optimised segment enjoyed an unfair advantage. It knew the answers before the exam started.
Out-of-sample blocks get no such help. As a result, the stitched path usually sags, and a sag of some size is normal rather than alarming.
Judge the stitched path on shape as well as height. A path that grinds along, dips and recovers describes a system with a pulse.
When the Stitched Path Is Flat
A flat or falling stitched path is a genuine result, not a setup failure. It says the parameters carried no information forward.
People rarely publish that outcome, yet it arrives more often than the alternative. Treat it as the method working correctly.
Discarding a rule at this stage costs you an afternoon. Discovering the same thing with a funded account costs considerably more, so the flat path is cheap information.
Anchored Windows Against Rolling Windows
Two window shapes dominate practice. Both walk forward, but they treat old data differently.
The Rolling Shape
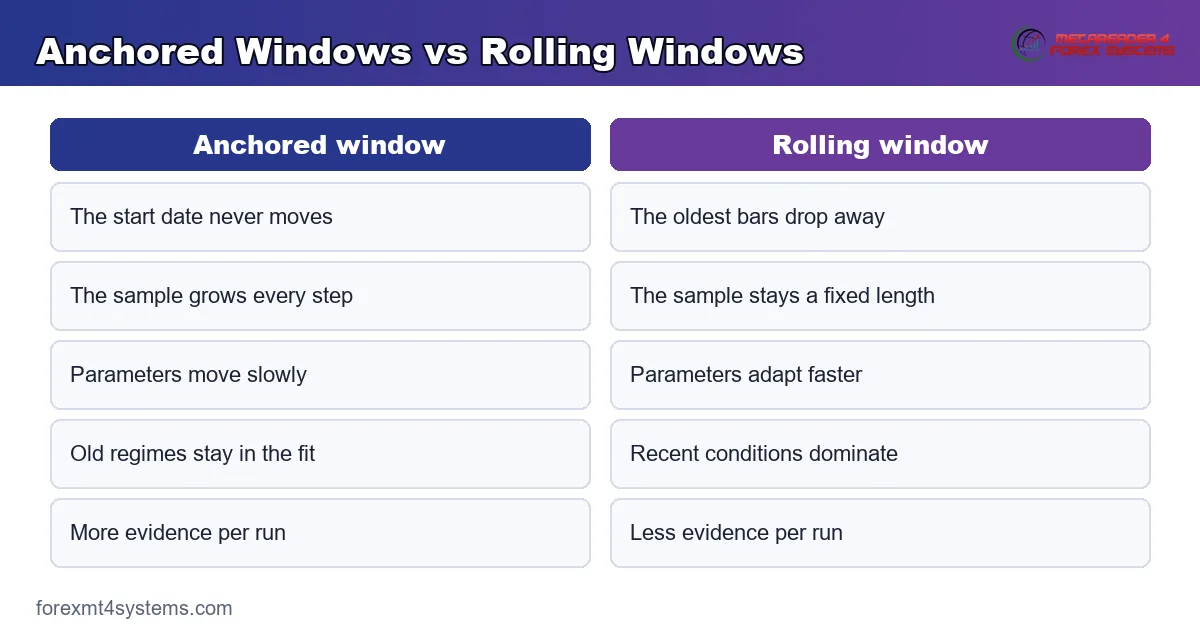
A rolling window keeps a fixed length and drops the oldest bars as it advances. Recent conditions therefore dominate every optimisation.
That suits markets whose behaviour drifts. It also throws away evidence, which hurts when the sample was thin already.
The Anchored Shape
An anchored window keeps its start date and simply grows. Old regimes never leave the sample.
Parameters then move more slowly, because each new block forms a smaller share of the total. Stability improves, while adaptation slows down.
Which One to Use
Neither shape wins outright. Run both if you can, and compare the stitched paths rather than the optimised ones.
Wide disagreement between them is informative on its own. It usually means the parameters depend heavily on which years you fed the optimiser.
Walk Forward Efficiency and What It Means
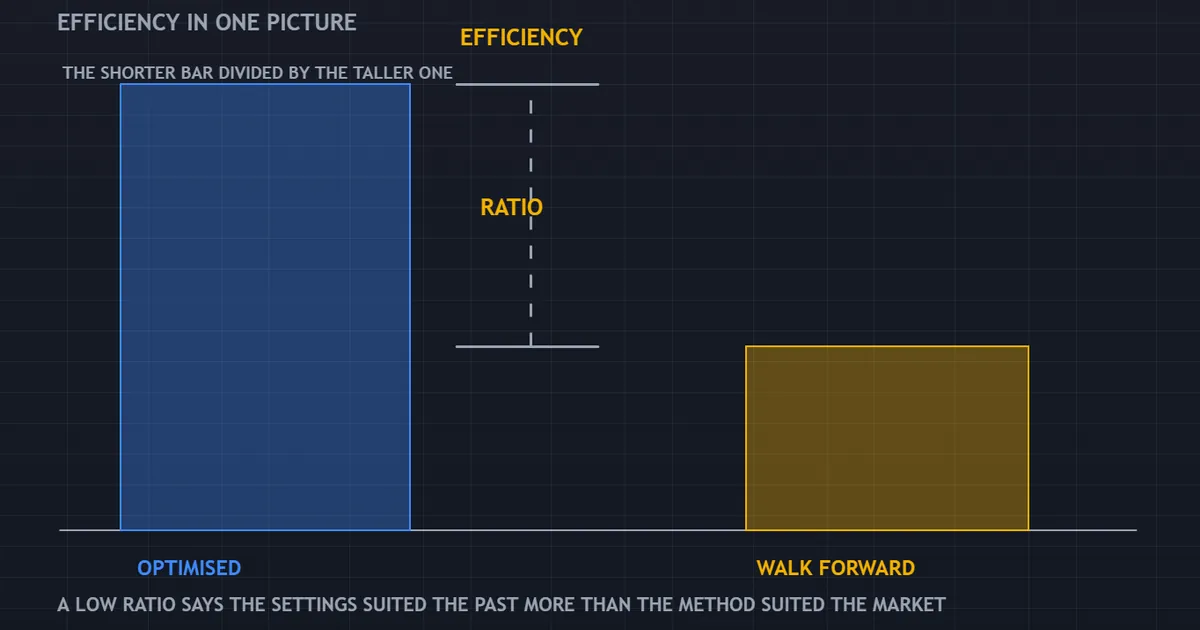
One ratio summarises the whole exercise. Divide the out-of-sample result by the in-sample result over the same span.
Reading the Ratio
A ratio near one says the optimised numbers survived contact with new bars. A ratio near zero says they described the past and nothing else.
Most honest systems land somewhere in the middle. Because the figure depends on how you optimised, treat it as a relative measure across your own tests rather than an industry standard.
What the Ratio Hides
Efficiency says nothing about drawdown. A system can score well on the ratio and still travel through a decline you would never sit through.
Check the depth of the worst decline on the stitched path as well. Our drawdown calculator shows what a given decline demands in recovery terms.
A Worked Example in Plain Numbers
Numbers make the loop concrete. Here is a small run with the arithmetic written out.
The Setup
Take eight years of hourly data and a rule averaging forty trades a month. Choose a two-year optimise window and a six-month test window.
That geometry produces twelve steps across the history. Each test block then holds roughly two hundred and forty trades, which is a workable sample.
What the Blocks Reported
Eight of the twelve test blocks finished ahead. Three finished behind, and one finished almost exactly flat.
So the stitched path rose, but it rose unevenly. Two losing blocks landed back to back, producing a decline that ran for nine months.
What the Trader Learned
The headline here was not the profit. It was the nine-month decline, which arrived in the middle of a system that worked.
Ask an honest question about that stretch. Nine months of losses removes most traders from a strategy long before any recovery arrives.
A second lesson sat in the parameters themselves. Across twelve optimisations one input wandered between four and thirty-one, which says more about the rule than about the market.
Choosing Window Lengths Without Fooling Yourself
Window length quietly decides the outcome. Get it wrong and the exercise measures your choice rather than the strategy.
Count Trades, Not Months
Calendar length is the wrong unit. A scalping rule might produce two hundred trades in a month, while a weekly swing rule needs three years for the same count.
Set the optimise window so it holds a few hundred trades where possible. Set the test window so it holds enough to move the needle, which usually means dozens rather than a handful.
The Ratio Between Them
Four to one and five to one both appear widely. Neither is sacred.
Shorter test blocks give you more repetitions and noisier individual scores. Longer test blocks reverse both effects, so the trade-off never disappears.
Do Not Tune the Windows
Here sits the subtle trap. Trying several window lengths and keeping the flattering one re-introduces exactly the bias the method removed.
Decide the geometry first, then run it once. If you must compare shapes, report every shape you tried, including the ugly ones.
Download the complete indicator database
Put these concepts on your charts. One email unlocks the full library of 1,380+ indicators with compiled MT4 and MT5 files, plus my TradingView scripts. No paywall, no spam, unsubscribe any time.
Get free access to my indicator database
One email unlocks 1,380+ free MT4, MT5 and TradingView indicators — the complete library. No single-tool download; you get the whole database.
Running the Loop in the MT4 Strategy Tester
MT4 has no built-in walk forward mode. Still, the loop runs fine by hand, and third-party wrappers automate the stepping.
The Manual Procedure
Set the date range to your first optimise window and run the optimiser. Note the winning inputs, then set the date range to the following block and run a single test with those inputs.
Copy the report figures into a spreadsheet. Move both dates forward and repeat, which is tedious but perfectly workable.
Settings That Change the Answer
Use the same modelling method for every run. Mixing Every tick in one block with Open prices only in another makes the comparison meaningless.
Keep the spread setting identical across blocks as well. Our guide to the MT4 Strategy Tester walks through each of those inputs in detail.
Watch the History Quality
Mismatched chart errors in the report mean the history has holes. That is a data problem, so fix it before you read a single result.
Traders running automated rules on charts often pair the tester with their live setup. Our MT4 indicators library shows the same logic drawn on a live chart.
What Walk Forward Analysis Cannot Fix
The method removes one specific illusion. It leaves several others completely intact.
Bad Data Stays Bad
Gappy history, a wrong symbol suffix or an unrealistic fixed spread poisons every window equally. Splitting poisoned data changes nothing.
Execution Still Differs
No tester models a widening spread, a requote or a fill that arrived late. Those costs land in live trading only.
Our guide to backtesting transaction costs puts numbers around that gap. It is usually larger than traders expect.
Regime Change Still Arrives Unannounced
Stepping through history covers the regimes that history contained. It cannot cover the one that arrives next.
A decade of range-bound behaviour teaches an optimiser nothing about a violent trend. So a strong stitched path across quiet years says little about a noisy one.
Read the calendar of your test period afterwards. Knowing which central bank cycle or crisis sat inside each block adds useful context to every number.
A Strategy With No Edge Stays Empty
If the rules capture nothing real, walk forward reveals that fact rather than repairing it. Revealing it is the entire value.
Traders sometimes respond by rewriting the rules and running the loop again. Do that often enough and the out-of-sample blocks stop being out of sample.
Where the Loop Sits in a Testing Sequence
Walk forward is one stage among several. Running it out of order wastes the effort.
What Comes Before
A single clean backtest comes first. If a rule fails there on sensible default settings, no amount of stepping will rescue it.
Our guide to backtesting in trading covers that first pass. Treat it as a filter rather than as evidence.
What Comes After
A forward test follows, and only then a small live allocation. Each stage adds a cost the previous stage could not model.
Keep one record across every stage. A trade journal makes the comparison between tested behaviour and live behaviour possible at all.
How Long the Sequence Takes
Plan for weeks rather than an afternoon. Optimisation itself runs fast, yet the discipline of not peeking is what consumes the calendar, and there is no shortcut around it.
Rushing the sequence defeats it entirely. Traders who skip stages usually discover the missing information with real money instead.
Common Mistakes That Break the Method
Five habits undo the whole exercise. Each of them is easy to commit by accident.
- Peeking at the test block. Looking, adjusting and re-running turns out-of-sample data into training data.
- Changing the selection rule after seeing results. Pick your criterion before the first optimisation and keep it.
- Reporting the optimised curve. The stitched out-of-sample path is the result; the optimised segments are working notes.
- Testing too few blocks. Three repetitions cannot separate a working system from a lucky one.
- Ignoring costs. A rule that survives ten blocks gross may not survive one block net.
Notice the pattern behind all five. Each one lets information leak backwards from the test block into the parameter choice.
From Stitched Path to a Trading Decision
A stitched path is evidence, not permission. Three questions turn it into a decision.
Does the Edge Survive Costs?
Recalculate the stitched result with realistic spread and commission. Then check the average result per trade against your round-trip cost.
Our free expectancy calculator does that arithmetic from your own numbers. A thin margin per trade rarely survives live conditions.
Could You Sit Through the Worst Stretch?
Find the longest losing run on the stitched path and count the trades in it. Then imagine that run arriving first, because order is arbitrary.
Our guide to drawdown in trading explains why the depth matters less than the duration for most traders.
What Happens Next?
Walk forward earns a forward test, never a live account. Our guide to forward testing covers how long that stage should run.
Traders automating the rules should also read our guide to expert advisors before letting anything trade unattended.
A Compact Checklist
Run through this before you accept any walk forward result. It takes a minute and catches most errors.
| Check | Why it matters |
|---|---|
| Were the rules frozen before the first optimisation? | New rules mid-run reintroduce fitting |
| Did every block use the same modelling method and spread? | Mixed settings make blocks incomparable |
| How many out-of-sample blocks exist? | Fewer than five tells you almost nothing |
| How many trades sit in each test block? | A handful of trades measures noise |
| Are you quoting the stitched path or the optimised one? | Only the stitched path is untouched |
| Do the parameters jump wildly between blocks? | Unstable parameters suggest a fragile rule |
| Does the result survive realistic costs? | Gross edges vanish at the spread |
FAQ
Is walk forward analysis better than a simple backtest?
It answers a different question. A simple backtest asks how a fixed set of rules behaved on a stretch of history. Walk forward asks whether the process of choosing parameters produces settings that keep working on bars nobody optimised against. The second question matters far more once an optimiser enters the workflow, because an optimiser will always find something.
How many out-of-sample blocks do I need?
More than most people run. Five blocks is a bare minimum, ten to fifteen is a reasonable target, and the trade count inside each block matters more than the block count itself. If a decade of data yields only four blocks with twelve trades apiece, the sample cannot support a confident conclusion.
What does a good walk forward efficiency number look like?
No single figure works as a threshold, and anyone quoting one is skipping the conditions. The ratio moves with your optimise-to-test ratio, your selection criterion and how many parameters you searched. Compare the number across your own tests, built the same way, rather than against a value from a forum post.
Can I run walk forward analysis on MT4?
Yes, though MT4 gives you no automated mode. Step the date range manually, optimise on one window, lock the inputs, test the next window, then record the figures in a spreadsheet. Several third-party wrappers automate the stepping and produce the stitched report for you.
Does a strong walk forward result mean the strategy will work live?
No. It means the strategy survived a harder test than a plain optimisation, which is meaningful but limited. Live trading adds variable spread, slippage, requotes, downtime and your own behaviour, none of which appear in any tester. Treat a strong stitched path as a reason to forward test rather than as a verdict.
What if the parameters jump around between blocks?
Treat that as a finding rather than a nuisance. Stable parameters across steps suggest the rule captures something the market keeps doing. Wild swings suggest the optimiser chases whatever the last two years happened to look like. Some traders average the chosen values across blocks and test the average, which is a reasonable compromise as long as you report it honestly.
Should I re-optimise once the system trades live?
Many traders do, on a schedule that matches their test window. Fix the schedule in advance and follow it, because re-optimising after a losing stretch is just fitting with extra steps. Keep a record of every re-optimisation and the parameters it chose, then review how often it wins across the whole record rather than judging any single period. Results are not guaranteed; past performance is not indicative of future results.
External references
- For background on this concept, see Cross-Validation on Wikipedia.
- For broader market context, see Overfitting at Corporate Finance Institute.

About the author
Written by Dominic Walsh, a Forex trader and MT4/MT5 indicator, Expert Advisor and script developer. Every tool on forexmt4systems.com is tested on live charts before release and ships with ready-to-use compiled MT4 (.ex4) and MT5 (.ex5) files. Learn more about the trader and developer behind this site.
How we build, test and correct every tool: Editorial & Testing Policy. Trading carries risk; see the disclaimer.