
A strategy that describes the past perfectly usually describes nothing else. Curve fitting in trading is the process of tuning rules until they match one stretch of history so closely that they capture its accidents along with its patterns.
This guide explains how curve fitting in trading happens, what it looks like on a report, and which guards genuinely reduce it. It also shows two real market episodes of the kind that ends a fitted system.
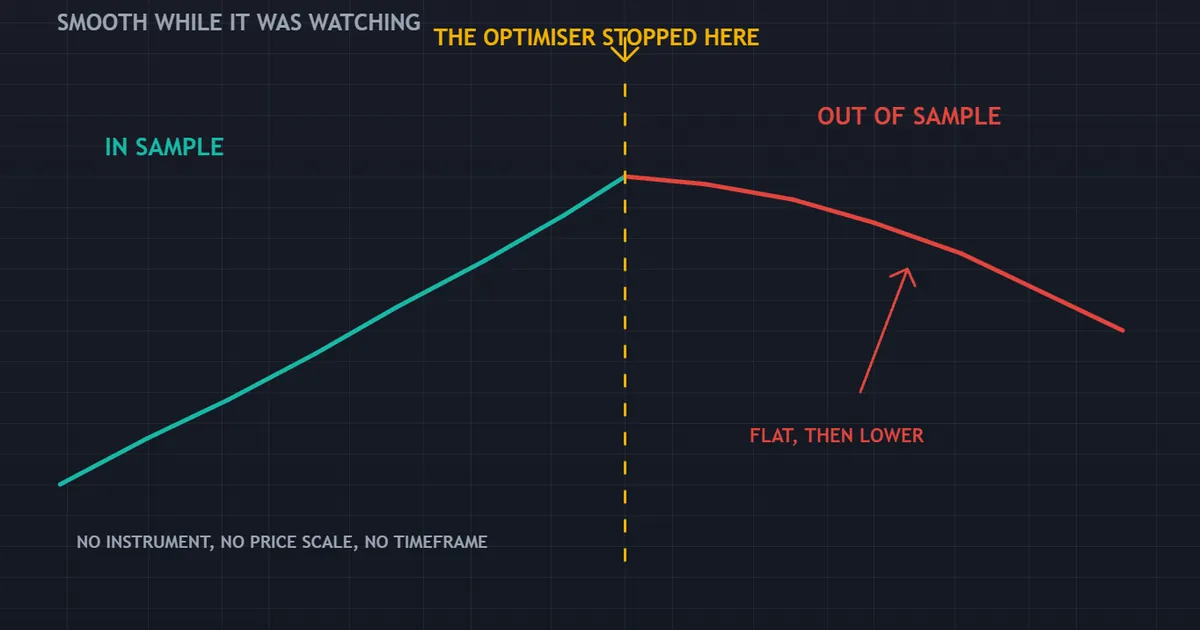
The panel above shows the shape everyone eventually meets. Smooth and rising while the optimiser was watching, then flat and falling once it stopped.
What Curve Fitting in Trading Looks Like
Fitting rarely arrives as a deliberate act. It arrives as a series of small, sensible adjustments.
You test a rule. The result disappoints, so you widen the stop. Better. Then you add a session filter, and better again.
Each Step Feels Like Research
Nothing in that sequence feels dishonest. Every change had a reason, and every change improved the number on screen.
But the number improved because you kept looking at the same data. The rule learned that specific history rather than the market behind it.
The Definition, Plainly
A fitted rule explains a sample. A general rule explains the process that produced the sample.
Those two look identical on a backtest report. They diverge sharply the moment fresh data arrives.
Why the Word Matters
Statisticians call the same thing overfitting, and they treat it as the central problem in model building. Traders meet it earlier and with more money at stake.
Borrowing their vocabulary helps. Once you think of a strategy as a model of the market, the question becomes obvious: how much of this describes the market, and how much describes my sample?
Why It Happens So Easily
Three forces push in the same direction. Together they make fitting the default outcome rather than a rare error.
Software Makes Searching Free
An optimiser can evaluate ten thousand combinations while you make coffee. Nothing about that speed feels dangerous, and it removes the friction that used to protect people.
A Good Result Ends the Search
Traders stop testing when the curve looks acceptable. So the search ends precisely at its luckiest point, which is exactly the wrong stopping rule.
Nobody Records the Failures
You remember the settings that worked. The ninety-seven combinations you discarded leave no trace, so the survivor looks far more impressive than it should.
Keep a note of how many variations you tried. That single number changes how you read the winner.
The Arithmetic of Searching
Some numbers make the problem concrete. They are worth carrying around.
Combinations Multiply Fast
Two inputs with twenty values each produce four hundred combinations. Add a third and you reach eight thousand.
Add a session filter, a day-of-week filter and a volatility filter, and the search space runs into millions. Somewhere in there sits a beautiful curve built entirely from coincidence.
Random Data Produces Winners Too
Run the same sweep across a series of coin flips dressed up as prices. A leader still emerges, and it still looks convincing.
That thought experiment settles the argument. A high ranking proves the search happened, and nothing more.
More Rules, Less Evidence
Every parameter consumes evidence. A rule with two inputs tested across a thousand trades stands on firmer ground than a rule with nine inputs tested across two hundred.
Warning Signs You Can Check Today
Fitted strategies leave fingerprints. Six of them show up on almost any report.
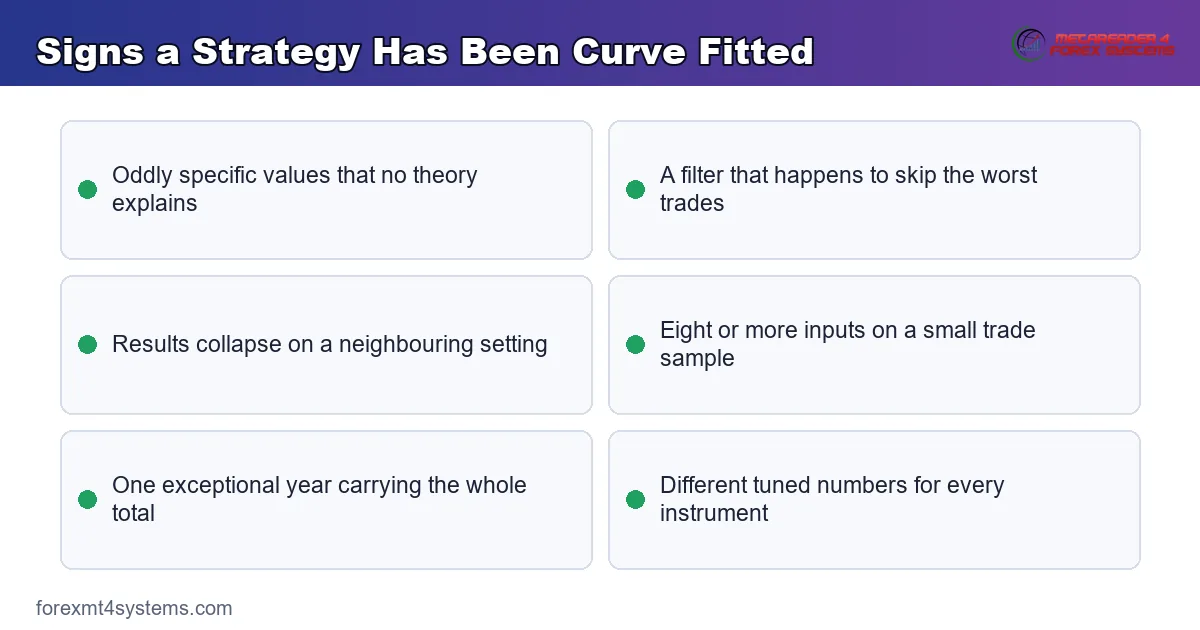
The diagram above collects the signs in one place. Any single one deserves attention, and two together should stop the project.
Oddly Specific Numbers
A stop of forty-three points and a filter at eleven twenty-two in the morning did not come from a theory. They came from a search.
Rules That Exclude Specific Losses
A condition that happens to skip the three worst trades in the sample is not a filter. It is a description of those three trades.
Performance That Collapses on a Neighbouring Setting
Move a length from fifty to forty-eight and watch. A real edge degrades gently, while an accident falls off a cliff.
The Lonely Peak Against the Broad Plateau
This test does more work than any other, and it costs nothing. Look at the neighbourhood around your chosen settings.
What a Plateau Means
A broad region of decent results suggests the rule captured something structural. Small changes barely move the outcome, so small changes in the market probably will not either.
Pick the middle of that plateau rather than its best point. The middle survives drift; the peak does not.
What a Spike Means
A single tall result surrounded by poor ones means the rule found a coincidence. Nothing about that combination generalises.
Traders often defend the spike by pointing at its size. Size is exactly what a coincidence produces when you search hard enough.
How to Look
Run the optimiser, then sort by setting rather than by result. Read the column as a landscape, not as a league table.
Regime One: A Break That Did Not Follow Through
Fitted rules die when the market changes character. Here is one such moment, measured on real bars.

The box held for 28 bars, then price closed down out of it on 2024-06-16 but the break failed: it came back 1.1 ATR against the break within 10 bars.
Why This Ends a Fitted Breakout Rule
A breakout rule tuned on a stretch where breaks ran will have learned to hold through the first adverse move. Here that habit costs directly, because the adverse move was the whole story.
Note what the numbers say. The break happened, the entry triggered, and then price travelled more than an ATR back through it inside ten bars.
The Filter That Fits Itself
The tempting fix is a confirmation filter chosen after seeing this episode. Add a rule that would have skipped exactly this trade and the backtest improves immediately.
That improvement is fitting in its purest form. You have not learned anything about breaks; you have memorised one of them.
The Honest Response
Failed breaks are a permanent feature of ranges, not an anomaly to be engineered away. Size the rule so a run of them is survivable, then leave the logic alone.
Model that run against your own balance with our drawdown calculator before you decide what you can tolerate.
Download the complete indicator database
Put these concepts on your charts. One email unlocks the full library of 1,380+ indicators with compiled MT4 and MT5 files, plus my TradingView scripts. No paywall, no spam, unsubscribe any time.
Get free access to my indicator database
One email unlocks 1,380+ free MT4, MT5 and TradingView indicators — the complete library. No single-tool download; you get the whole database.
How to Guard Against Curve Fitting
No method removes the risk entirely. Six habits reduce it substantially.
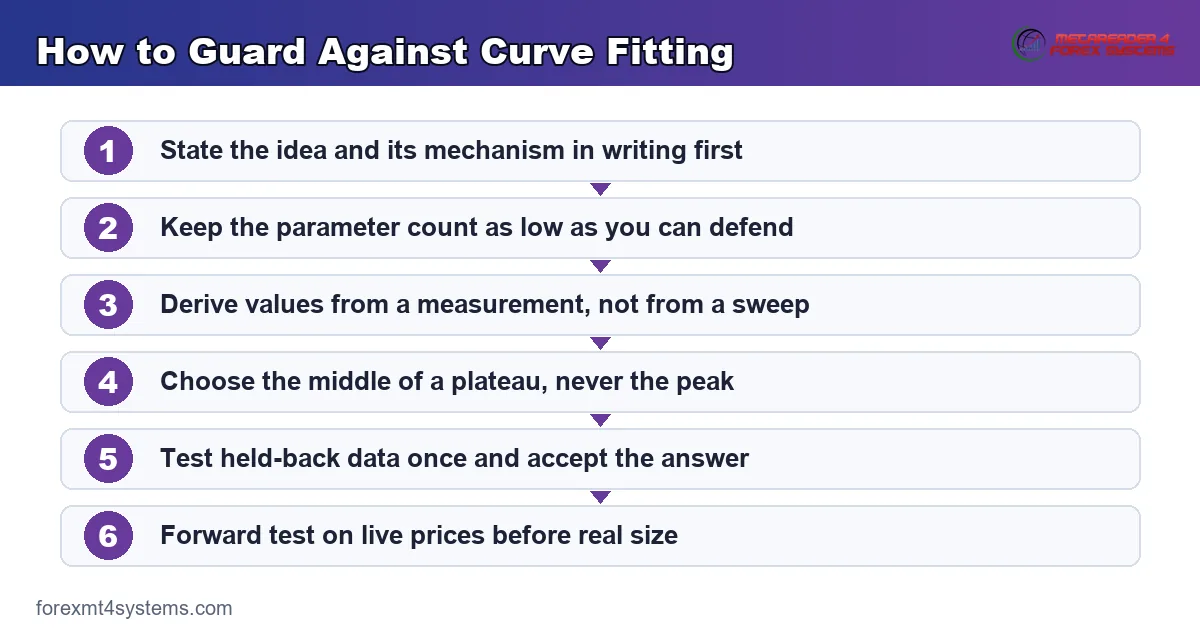
The diagram above sets the guards in order. Applying them in sequence matters, because the later steps only mean something if the earlier ones happened.
Write the Rule Before You Test
State the idea in one sentence and the mechanism behind it in one paragraph. If neither exists, the rule came from the data rather than from thought.
Hold Data Back and Actually Hold It
Reserve a period the optimiser never touches. Then apply the chosen settings once and accept the answer, whatever it says.
Peeking ruins it. A held-back period that you check five times has become part of the training set.
Prefer Fewer Inputs
Cut every parameter you cannot justify from first principles. A simpler rule with a worse backtest usually beats a complex rule with a better one.
Degrees of Freedom and How to Cut Them
Traders count parameters and stop there. The real count runs much higher.
Hidden Choices Count Too
Your instrument, your timeframe, your start date and your exit style are all decisions. Try three pairs and pick the best, and you have used a degree of freedom without recording it.
Count every choice made after seeing results. That total, not the parameter list, describes how hard you searched.
Ways to Reduce the Count
Fix values from theory where you can. A stop set at one ATR rests on a measurement, while a stop set at forty-three points rests on a sweep.
Reuse the same settings across several instruments. A rule that needs different numbers for every pair has nine rules hiding inside it.
Record Every Version You Tried
Keep a simple log of each variation and its result. That log is the only honest record of how hard you searched.
Traders resist this because the total looks embarrassing. Embarrassment is the point, since it recalibrates how much the winner deserves.
Test the Idea, Not the Version
Ask whether the family of settings works, rather than whether one member does. Our guide to walk forward analysis formalises that question.
Regime Two: A Run That Gave Nothing Back
The second way a fitted rule dies looks entirely different. Here the market simply refuses to reverse.

Price ran down 6.4 ATR over 18 bars and the deepest pullback against that run was only 28 percent of the distance travelled — a position bought into it was never given a recovery.
Why This Ends a Fitted Mean Reversion Rule
Rules tuned on ranging data learn that dips get bought. That lesson holds until it stops holding, and nothing in the code notices the change.
Read the second half of the measurement carefully. The deepest pullback reached a little over a quarter of the distance travelled, so patience never paid.
The Scaling Trap
Fitted mean reversion rules often add to losing positions, because on the tuning sample that always worked. A run like this one converts that habit into the largest loss in the record.
So test any averaging logic against a period of relentless direction. If the rule only survives when reversals arrive, it depends on a regime rather than an edge.
What the Two Episodes Share
Neither event is exotic. Ranges produce failed breaks, and trends produce shallow pullbacks, and both keep happening.
A fitted rule treats them as anomalies. A general rule treats them as the cost of doing business.
Watching a Search Go Wrong
Abstractions about search space stay vague. So follow a realistic session at the keyboard.
The Starting Idea
You begin with a moving average crossover on the hourly chart. Fast length twenty, slow length one hundred, a fixed stop and a fixed target.
The first run comes back flat. Not a disaster, and not encouraging either.
The Slide Begins
You sweep the fast length from five to fifty. One value stands out, so you keep it.
Then you sweep the slow length, and another value stands out. Two sweeps, and the curve now looks respectable.
Next comes a session filter, because the losses cluster in one window. Then a volatility filter, because a few large losses came in quiet conditions.
Counting What Just Happened
Four searches took place, each choosing from dozens of options. Roughly a hundred thousand combinations sat behind the final settings.
Your sample holds two hundred and forty trades. So the search space is several hundred times larger than the evidence supporting it.
The Test That Settles It
Apply the final settings, unchanged, to two years the search never touched. Most rules built this way come back flat or worse.
That outcome is not bad luck. It is the arithmetic of the search finally showing itself.
Sample Size and the Illusion of Detail
Fitting and thin samples reinforce each other. The fewer trades you hold, the easier it is to fit them.
Trades, Not Years
Ten years of daily data with one trade a month gives you a hundred and twenty trades. That is a small sample dressed up as a long history.
Count trades, then count how many happened in each market condition. Our note on backtest sample size puts numbers on how much a small sample can mislead.
Segment the Sample
Split results by year and read each year separately. A rule carried by one exceptional stretch shows up immediately.
An average across the whole period hides that. Averages are where fitted rules do their best work.
Fitting in Discretionary Trading Too
Most articles treat this as a programmer’s problem. Manual traders fit constantly, and they rarely notice.
Rules Rewritten After the Fact
You lose on a setup, then add a condition that would have avoided it. Do that twenty times and your method becomes a description of your own losing trades.
The result feels like learning. It reads exactly like a fitted parameter sweep, only slower and without a record.
Scrolling Charts Until It Works
Manual backtesting on historical charts carries the same danger. Your eye already knows what came next, so every judgement leans on information the moment never held.
Use a replay tool that hides the future, or test on a market you have never studied. Both remove the advantage you cannot help using.
The Fix Is the Same
Write the method down, then stop editing it for a fixed number of trades. Any change made before that count arrives is a change made in response to noise.
What Fitting Costs You in Live Trading
The damage goes beyond a disappointing result. Three costs land in sequence.
The Wrong Expectations
You size the position for the drawdown the backtest showed. The real drawdown arrives deeper, and the size that felt comfortable no longer does.
Turn the honest figures into a per-trade number with our expectancy calculator, then size from that.
The Wrong Diagnosis
When results disappoint, the fitted trader tunes again. That reaction deepens the problem, because the new settings fit the new data just as tightly.
The Wrong Lesson
Repeated failure convinces some traders that testing is pointless. The real lesson is narrower: searching without discipline produces results that mean nothing.
Recording what you actually did protects against this. Our guide to reviewing your trades covers the habit.
A Practical Checklist
Run through this before any strategy earns real size. It takes an afternoon.
| Check | What good looks like | Warning sign |
|---|---|---|
| Idea first | A mechanism you can state in one sentence | The rule appeared only after the search did |
| Parameter count | Two or three inputs, each justified | Eight or more, several with odd values |
| Neighbouring settings | A broad plateau of acceptable outcomes | One tall spike with poor results either side |
| Held-back period | Tested once, with the result accepted | Checked repeatedly until it improved |
| Trade count | Several hundred across varied conditions | Under a hundred, mostly in one regime |
| Yearly breakdown | Every year contributes something | One exceptional stretch carries the total |
| Cross-instrument | Similar settings work on related markets | Every market needs its own tuned numbers |
| Forward test | Months of live prices before real size | Straight from the report to a funded account |
Then run the rule forward before committing anything. Our guide to forward testing explains how long that stage should last.
Robustness Tests Worth Running
Four cheap tests separate a durable rule from a fitted one. None of them needs special software.
Shift the Start Date
Move the beginning of the test forward by three months, then by six. A rule whose character changes with the calendar depends on a lucky opening stretch.
Round the Numbers
Replace forty-three with forty, and eleven twenty-two with eleven. Performance should soften a little rather than collapse.
Rounding also tells you something useful about the original. Precision that cannot survive rounding was never precision.
Change the Instrument
Apply identical settings to a related market. Correlated pairs will not deliver identical results, and they should not deliver nonsense either.
Add Noise to the Costs
Double the spread assumption and rerun. A thin edge that dies under that treatment was living on an optimistic cost model rather than on the market.
Then read the two reports side by side. The distance between them measures how much of the result depended on friction you may not actually pay.
The Honest Summary
Fitting is not a mistake that careless people make. It is the natural result of testing on the same data repeatedly, and everyone who optimises does some of it.
So the goal is control rather than elimination. Fewer parameters, fewer looks at the same data, honest counting of every choice, and a genuine held-back test.
Above all, remember what a backtest can do. It can disprove a strategy convincingly, and it cannot prove one. For rule ideas worth testing properly, our forex trading strategies section is a reasonable starting point.
FAQ
Is all optimisation curve fitting?
No, though the line is thinner than most traders assume. Choosing a sensible range for a parameter using a mechanism you can explain is ordinary engineering. Sweeping thousands of combinations and keeping the best one is fitting, whatever it gets called, because the search itself produced the result rather than the market.
How many parameters are too many?
There is no fixed limit, since it depends on how many trades you hold. A rough guide: each extra input demands a substantially larger sample to stay meaningful, so two or three inputs across several hundred trades is defensible while eight inputs across two hundred trades is not. Cut anything you cannot justify from first principles.
Does walk forward analysis solve the problem?
It reduces it considerably rather than solving it. Repeatedly optimising on one window and testing on the next enforces a discipline that a single run never does. Even so, the choice of window lengths, the parameter ranges and the instrument are all still decisions made by you, and each one uses up evidence.
Can I fix a fitted strategy?
Sometimes, by simplifying rather than by tuning further. Strip out the filters that exist only to exclude specific losses, replace searched numbers with values derived from a measurement such as ATR, then retest on data the original search never touched. If nothing survives that treatment, the idea itself was the problem.
How do I tell fitting apart from a genuine market change?
Look at where the rule sat in its parameter landscape before live trading began. A setting picked from the middle of a broad plateau that then stops working points toward a change in conditions, while a setting picked from a lonely spike was fragile from the start. The distinction matters because only one of the two is worth waiting out.
Why did my strategy work for months and then stop?
Most often because the market changed character rather than because anything broke. A rule tuned on ranging conditions meets a sustained trend, or a breakout rule meets a stretch where every break fails, and the code has no way to notice. Regime change explains far more failures than bad execution does. Results are not guaranteed; past performance is not indicative of future results.
External references
- For background on this concept, see Overfitting on Wikipedia.
- For broader market context, see Data Mining at Investopedia.

About the author
Written by Dominic Walsh, a Forex trader and MT4/MT5 indicator, Expert Advisor and script developer. Every tool on forexmt4systems.com is tested on live charts before release and ships with ready-to-use compiled MT4 (.ex4) and MT5 (.ex5) files. Learn more about the trader and developer behind this site.
How we build, test and correct every tool: Editorial & Testing Policy. Trading carries risk; see the disclaimer.