
Backtesting mistakes rarely announce themselves. They arrive as a better result, which is precisely why they survive so long inside a testing process.
Every error on this page pushes the outcome in the same direction. Each one makes the rule look stronger than it was, and none of them makes it look weaker.

The panel above lists five of the worst, each with the damage it does. Work down that list before you trust any report, including one you produced yourself.
Why Backtesting Mistakes Skew in One Direction
Bias in testing is not random. You stop looking when the number pleases you, and you keep looking when it does not.
So errors that flatter a rule survive, while errors that hurt it get found and fixed. That asymmetry, not arithmetic, causes most of the damage.
The Core Limit
A backtest can only disprove a strategy. It can never prove one, because proof would need data that does not exist yet.
Hold that sentence in mind through everything below. It reframes every mistake as a way of dodging a rejection you should have accepted.
Lookahead Bias Is the Worst Offender
Lookahead bias means using information the trader could not have held at that moment. It produces spectacular results and impossible trades.

The panel above shows the classic shape. A decision gets made using a bar’s close, then acted on at that same bar’s open, with the arrow pointing backwards in time.
The Classic Version
A rule reads the closing price of a bar, then enters at the open of the same bar. Nobody could do that, and the tester allows it happily.
Signals must resolve on closed bars only. Entry belongs on the next bar, never on the one that produced the signal.
Repainting Indicators
Some indicators redraw earlier signals once later bars arrive. History then shows arrows that were never visible when they mattered.
Check any indicator by comparing a live screenshot against the same chart a day later. Anything that moved has told you what it is.
Daily and Weekly Values
Pivot levels, session ranges and daily highs all firm up only at the end of their period. Using a completed daily value inside that same day is lookahead in a quieter costume.
How to Catch It
Two tests find most cases. Run the test bar by bar and watch whether a trade appears before its signal, then compare a handful of tested entries against your live chart.
A result that seems too clean usually is. Suspicion is cheaper than a live account.
Survivorship Hides in the Symbol List
Survivorship bias means testing only the things that are still here. In forex it shows up in symbol selection rather than in delisted companies.
Where It Creeps In
You test the pairs that trend nicely today. Pairs that were pegged, redenominated or simply removed from the platform never enter the sample.
Currency regimes change too. A pair with a managed band for part of your window behaves nothing like a free-floating one.
The Strategy-Level Version
The same bias applies to your own ideas. You keep testing the ones that worked and quietly abandon the rest, so your folder of results is a filtered record.
Keep a log of every test, including the failures. Our note on reviewing your trades applies to tests as well as to positions.
Overfitting Turns Noise Into a Rule
Try enough settings and one combination will look excellent. That combination usually describes the noise in your sample and nothing else.
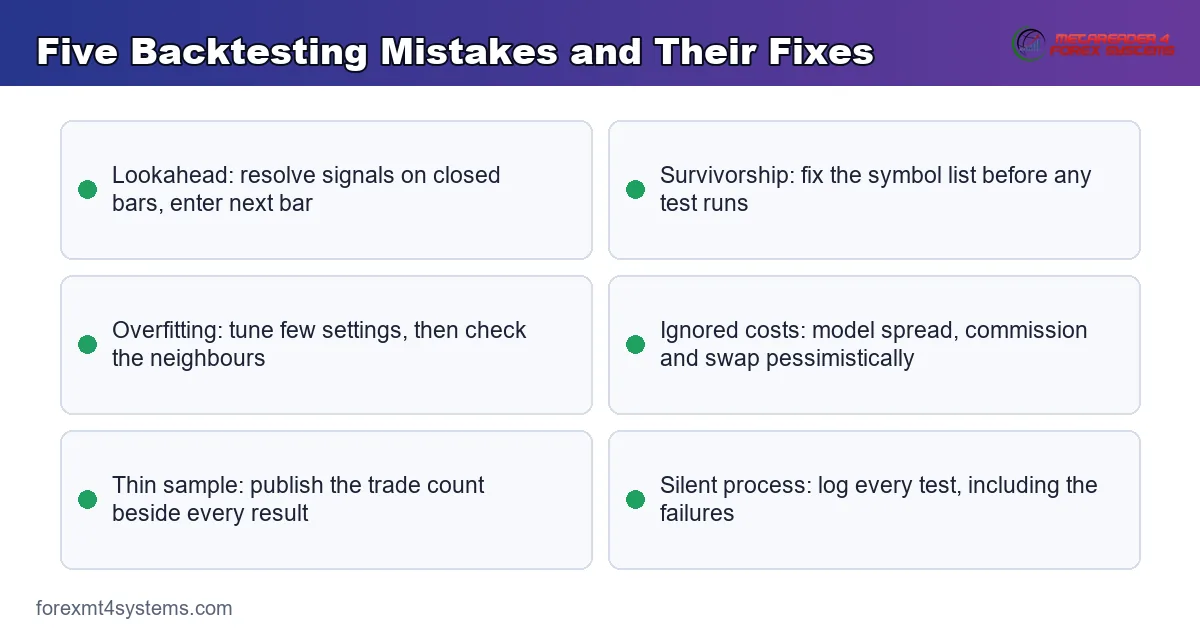
The diagram above pairs each error with its correction. Overfitting is the one that most often survives a careful reader, because it looks like diligence.
The Neighbour Test
Check the settings either side of your winner. A robust idea leaves a broad patch of decent results, while a fitted one leaves a lonely spike.
Our deeper treatment of curve fitting in trading works through that shape. The tell is always the neighbours.
Count Your Degrees of Freedom
Every tuned parameter spends evidence. Four settings fitted on two hundred trades leaves an effective sample close to nothing.
Fifty trades per tuned parameter is a rough floor. Below that, the result describes your search rather than the market.
Download the complete indicator database
Put these concepts on your charts. One email unlocks the full library of 1,380+ indicators with compiled MT4 and MT5 files, plus my TradingView scripts. No paywall, no spam, unsubscribe any time.
Get free access to my indicator database
One email unlocks 1,380+ free MT4, MT5 and TradingView indicators — the complete library. No single-tool download; you get the whole database.
Ignoring Costs Rescues Dead Rules
A zero-cost backtest is a fantasy with a chart attached. Spread applies twice per trade, commission applies per side on many accounts, and swap applies to anything held overnight.
Frequency Multiplies the Error
Cost drag scales with trade count. So a high-frequency result is the most fragile thing in your folder, because a tiny cost error gets multiplied thousands of times.
Our page on backtesting transaction costs works through the arithmetic. The short version: model the pessimistic case and see what survives.
The Default Spread Trap
The MT4 Strategy Tester uses a fixed spread unless configured otherwise. That default systematically understates cost during news and at the daily rollover.
Set the field deliberately. Accepting whatever appears is not a decision, and the report will not mention it.
Too Short a Sample Proves Nothing
Thirty trades cannot separate an edge from a streak. Randomness produces convincing runs constantly, and a small sample is mostly randomness.
The Count Is the Claim
Publish the trade count beside every result. A figure without a denominator is a decoration rather than a measurement.
Our companion piece on backtest sample size sets out the working floors. Hundreds of trades, not dozens.
Comparing Variants on Thin Data
Two variants measured on eighty trades each will always differ. Picking the higher one is a coin toss dressed up as analysis.
Wait until both samples are large enough to separate. Until then, keep the simpler variant.
Years Are the Wrong Unit
Ten years of history and eighty trades is a thin sample. Quote both numbers, because either one alone invites a false impression.
Data Mistakes That Look Like Results
Three data problems masquerade as strategy behaviour. Each one is visible in the report if you know where to look.
Mismatched Charts Errors
The MT4 report counts mismatched charts errors. That figure means the history has gaps, so it is a data problem rather than a strategy result.
Fix the history first. A test run over holes will produce a number, and that number describes the holes.
The Wrong Modelling Model
MT4 offers three models. Every tick is the most precise, control points uses the nearest smaller timeframe and runs much rougher, and open prices only evaluates at bar open and is meaningless for any rule that acts intrabar.
Modelling quality reports as a percentage, and it reads not applicable for open prices only. Around ninety percent is the practical ceiling using MT4’s own minute history on every tick.
Higher figures come from imported real tick data through third-party tools. Our note on MT4 modelling quality explains what that percentage does and does not promise.
Gaps and Missing Bars
Weekend gaps move price without any bars in between. A stop placed inside a gap does not fill where you placed it.
Our page on weekend gaps in forex covers the mechanics. Testers handle them inconsistently, so check what yours did.
The Wrong Symbol Settings
Contract size, minimum volume and swap values all come from the symbol specification. Test against a symbol whose settings differ from your live one and every figure shifts.
Check tick value and minimum lot before the run. Those two fields quietly rescale an entire report.
Mistakes in How Results Get Compared
Three errors appear when two results sit side by side. Comparison invites more sloppiness than measurement does.
Different Periods
A rule measured through a trending year and another measured through a quiet year are not comparable. Match the windows or drop the comparison entirely.
Shifting a start date by three months changes many curves noticeably. So publish the exact dates, not just the number of years.
Different Cost Assumptions
One test with a tight spread against another with a realistic one produces a meaningless ranking. Normalise the cost model before you compare anything.
Different Position Sizing
Fixed lots and percentage risk produce very different curves from identical signals. Convert both to R first, then the shapes become comparable.
Compounding hides in there too. A percentage-risk curve looks steeper simply because size grew, not because the rule improved.
Bias You Bring to the Chart
Some errors live in the reader rather than the software. They are harder to fix, because nothing in the report flags them.
Hindsight Reading
Scrolling back through history, every signal looks obvious. The bars to the right of your entry are already visible, and they were not visible then.
Cover the future portion of the chart when you review. Manual replay is the only honest way to read a past setup.
Confirmation Reading
You notice the trades that fit your idea and skim past the ones that do not. That filter operates quietly, and it operates every time.
Count occurrences rather than recalling them. Numbers resist the filter, and memory does not.
Narrative Reading
A story attached to a chart makes a random outcome feel inevitable. Explaining why a move happened is not the same as predicting it.
Keep the explanation out of the test. Rules take signals, and narratives arrive afterwards.
Execution Mistakes the Tester Cannot Show
Some errors come from what a simulation leaves out. A backtest cannot contain slippage variation, requotes, a widening spread, or your own hesitation.
One Bar, Two Prices
On many bars, price touches both your stop and your target. The tester must pick one, and different settings pick differently.
That single choice can flip a curve from strong to poor. Find out which assumption your run used before reading any figure.
Perfect Fills
Every order fills in a test, at the requested price. Real fast markets deliver slippage, and instant execution accounts deliver requotes.
Breakout rules suffer most, since they fire precisely when conditions are worst. Model that deliberately rather than hoping.
The Missing Human
The tested rule takes every signal. You will not, especially after three losers in a row.
So the tested rule and the traded rule are different rules. Only a forward record measures the second one.
Process Mistakes Beat Technical Ones
Technical errors are fixable once you know them. Process errors repeat forever, because they feel like work.

The comparison above sets a careless run against a careful one. Nothing in the careful column is difficult, and almost all of it is boring.
Changing the Rule Mid-Test
Adjusting a filter after seeing a bad stretch converts a test into a fitting exercise. Write the rule down first, then run it once.
Stopping When It Looks Good
Ending a test after a strong run bakes that run into the result. Fix the window in advance and run it to the end, whatever it shows.
Testing Only Ideas You Like
Enthusiasm shapes which tests get finished. Run the boring variant too, since it sometimes wins.
Abandoned tests also carry information. Note why you stopped, because the reason is often the finding.
Never Writing Anything Down
Undocumented tests get repeated with slight variations forever. A trade journal works for tests as well as trades.
Mistakes That Only Show Up Later
Some errors stay invisible until the rule runs live. By then they are expensive.
Testing Against Your Own Recent Memory
Most traders test the pattern they watched last month. That period is already in your head, so the rule quietly encodes what you saw.
Test on a stretch you have never studied. If the rule still holds, you have learned something real.
Freezing a Result Forever
A test done once becomes a belief. Conditions move on, and the belief does not.
Re-run the same test each year with the fresh data appended. Drift shows up as a slowly falling figure rather than a sudden break.
Testing a Rule Nobody Can Follow
A rule that fires at three in the morning tests beautifully and gets skipped in practice. So does one that needs eleven conditions checked by hand.
Match the rule to the life you actually have. Otherwise the tested rule and the traded rule diverge from day one.
Confusing Robustness With Complexity
Adding filters feels like making a rule sturdier. Usually it does the opposite, because each filter removes trades and spends more sample.
Simple rules with few settings survive contact with new data more often. Complexity is a cost, and it should earn its place.
The Curve That Is Too Smooth
A suspiciously clean equity curve is the loudest warning in testing. Real strategies produce jagged paths with uncomfortable stretches.

The panel above shows the shape that should stop you. When a curve rises without meaningful pauses, look for the error rather than the edge.
Two Quick Sanity Checks
Count the realised losses and compare them against the number of trades. A rule with very few losing exits is either holding losers or reading the future.
Then check the largest single loss against the stop distance you configured. A loss much larger than the stop points at gaps, and a loss much smaller points at a stop that never triggered properly.
What Usually Causes It
Three causes explain most smooth curves. Lookahead in the signal, a martingale-style recovery layer, or a rule that never books a loss because it holds losers indefinitely.
The third is the most common and the most dangerous. An account with no realised losses is carrying them all at once.
Check the Drawdown Instead
Read the maximum drawdown and the longest losing run before the profit line. Model both against your own balance with the drawdown calculator.
If the worst stretch looks trivial, something is wrong. Real rules hurt sometimes.
A Pre-Flight Checklist
Run through the table below before you accept any result. It takes ten minutes and saves considerably more.
| Check | What good looks like | Warning sign |
|---|---|---|
| Signal timing | Signals resolve on closed bars, entry on the next | Entries at the open of the signal bar |
| Symbol selection | A fixed list chosen before testing | Symbols added after seeing results |
| Parameters tuned | Few settings, broad plateau of results | A lonely peak among poor neighbours |
| Cost model | Pessimistic spread, commission and swap | Default fixed spread and no commission |
| Trade count | Hundreds of closed trades, span published | A few dozen trades over many years |
| Data quality | Zero mismatched charts errors | Errors present and unexplained |
| Equity shape | Jagged path with a real drawdown | A smooth rise without any losing stretch |
How to Fix a Test You Have Already Run
Most readers arrive here with a result already in hand. You do not have to throw it away.
Re-Run, Do Not Re-Tune
Correct the signal timing, set a pessimistic cost and run the identical settings again. Resist the urge to adjust anything else while you are in there.
The new figure is the honest one. Whatever it says, that is now your starting point.
Split What Remains
Divide the history in two, then check whether both halves agree. Large disagreement between halves is a warning that survives any amount of polishing.
Rolling that split forward repeatedly gives a stronger check. It costs sample, and it buys credibility.
Then Go Forward
A corrected backtest earns one thing: permission to run a forward test. Demo prices expose session and symbol errors, and small live size exposes the rest.
Keep both logs side by side. Where they disagree, the live log wins every time.
What a Clean Backtest Still Cannot Do
Fix every mistake on this page and one limit remains. The test still describes the past.
It Cannot Choose Your Size
A positive result says nothing about how much to risk. Size too heavily and a normal losing run ends the account before the average ever arrives.
It Cannot Predict
Conditions change without notice, and a rule keeps trading through the change. Nothing in the report speaks to next quarter.
It Cannot Measure You
The report assumes perfect discipline. Your own record is the only place that assumption gets tested.
It Can Narrow the Field
A careful test rejects most ideas quickly, and that is its real value. Browse the indicator library for raw material, then let honest testing do the filtering.
FAQ
What is the most common backtesting mistake?
Optimising until the curve looks good, then presenting that curve as evidence. It feels like careful work, and it produces a result that describes the sample rather than the market. The correction is simple and unpopular: fix the settings before testing, run once, and accept the answer.
How do I know if my test has lookahead bias?
Step through the test bar by bar and watch when each trade appears relative to its signal. Then compare a few tested entries against a live chart from the same period. Anything that enters on the bar that generated the signal, or any indicator that redraws its history, is the culprit.
Does a high modelling quality percentage mean the test is accurate?
It means the tick detail inside each bar was modelled finely, which is a different question from whether the result is meaningful. Around ninety percent is the practical ceiling with MT4’s own minute history on every tick, and higher figures come from imported real tick data. Detail per trade and number of trades are separate gates, and you need both.
Why do results look worse on live data than in testing?
Because the simulation leaves things out. Real spread widens, fills slip, orders occasionally get rejected, and a human sometimes skips the trade. Add a pessimistic cost model and a forward test on demo prices, and the gap usually shrinks to something you can live with.
Can a backtest ever prove a strategy works?
No, and that framing causes much of the trouble. A test can reject a rule cheaply, and it can fail to reject one, which is a far weaker statement than proof. Treat a good result as permission to run a careful forward test, never as a conclusion. Results are not guaranteed; past performance is not indicative of future results.
External references
- For background on this concept, see Look-Ahead Bias at Investopedia.
- For broader market context, see Selection Bias on Wikipedia.

About the author
Written by Dominic Walsh, a Forex trader and MT4/MT5 indicator, Expert Advisor and script developer. Every tool on forexmt4systems.com is tested on live charts before release and ships with ready-to-use compiled MT4 (.ex4) and MT5 (.ex5) files. Learn more about the trader and developer behind this site.
How we build, test and correct every tool: Editorial & Testing Policy. Trading carries risk; see the disclaimer.