
Most traders size each trade with care, then forget to add the trades together. So what is portfolio heat, and why does it decide whether a rough day dents your account or guts it? In short, portfolio heat is the total risk riding on all your open positions at once.
This guide explains what is portfolio heat in plain steps, then shows how to cap it. So by the end, you will add up your open risk in seconds and know when your book is carrying too much.
What Is Portfolio Heat in Plain Terms
Portfolio heat is the sum of the risk on every trade you have open. Each position risks some amount if its stop is hit. Add those amounts together, and you have your heat.
Picture it as one number that answers a blunt question. If every open trade lost at its stop today, how much of the account would go? So heat measures your worst plausible loss across the whole book, not one trade at a time.
Traders usually express heat as a percent of equity. A book risking three hundred dollars on a five thousand dollar account carries six percent heat. So the figure scales with your account and stays easy to read.
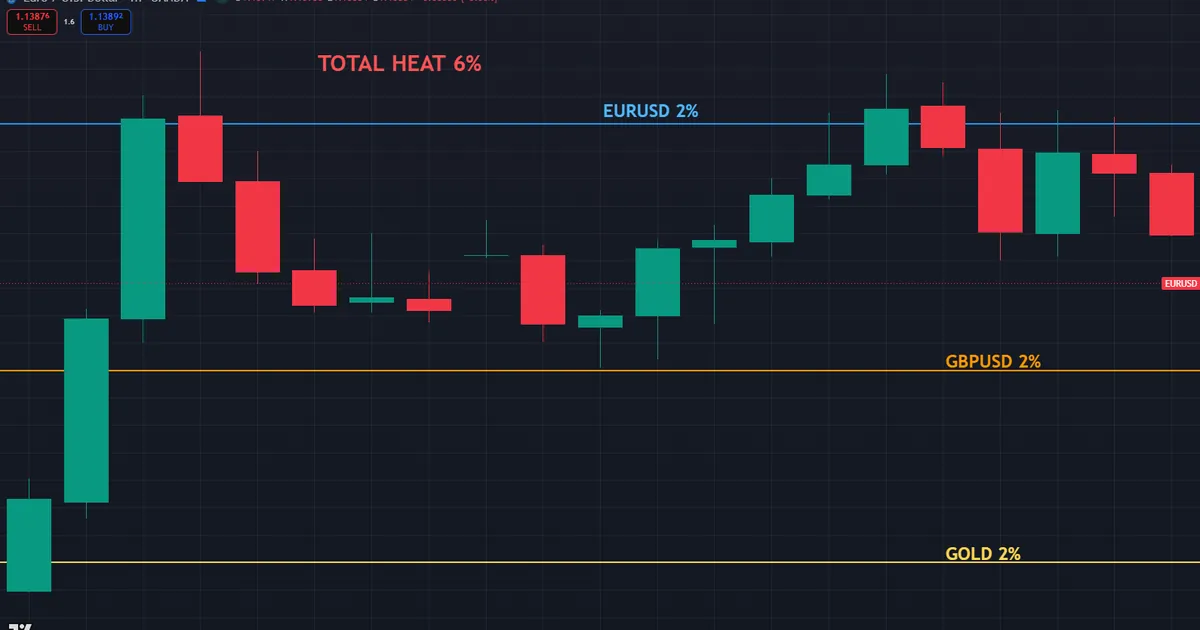
Notice why the single-trade view falls short. One trade at two percent feels safe, yet five such trades stack to ten percent. Our free portfolio heat calculator adds every open position for you and returns the total in one glance.
Why One Trade at a Time Misleads
Sizing each trade alone is a good start, yet it hides the pile. You might risk a tidy one percent on every entry. So each ticket looks harmless on its own.
Then you open six of them during a busy morning. Now six percent of the account sits at risk together. So the trades that felt small have quietly built a large, shared exposure.
Heat Is About the Whole Book
Think of heat as the temperature of your entire account. A single warm trade is fine. Many warm trades at once can overheat the balance.
So the goal is not to avoid risk on any one trade. The goal is to keep the sum within a level you can survive. Because losses can arrive together, the total is what threatens the account.
How to Measure Portfolio Heat
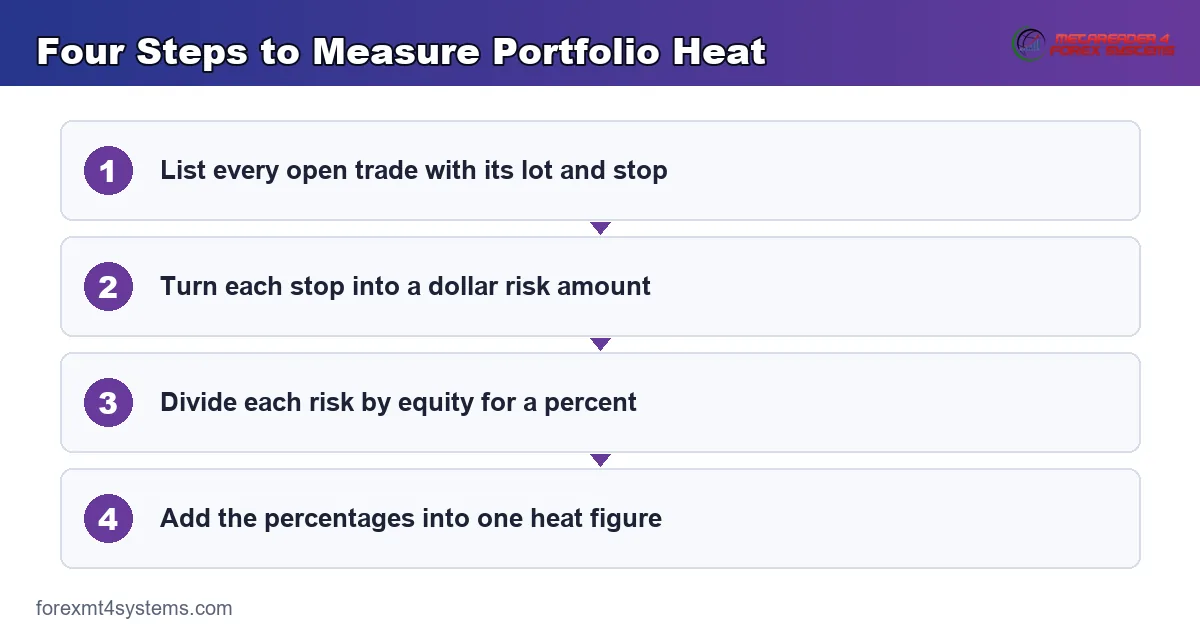
Measuring heat takes four simple steps, and the math stays light. You work out each trade’s risk, then add them up. The numbered list below sets the routine in order.
- List every open trade. Note the pair, the lot size, and the stop distance in pips for each one.
- Turn each stop into a dollar risk. Multiply the stop distance by the pip value and the lot size for that trade.
- Convert each risk to a percent. Divide the dollar risk by your account equity, so every trade reads as a share of the balance.
- Add the percentages together. The sum is your portfolio heat, the total you stand to lose if every stop fills.
So the process rewards a tidy trade log. With the stops and sizes written down, the sum takes moments. Because the number updates each time you open or close a trade, glance at it before every new entry.
One habit keeps the math honest. Always use the real stop, not a hopeful one. Because a mental stop can drift, only a resting order gives a heat figure you can trust.
A Quick Worked Total
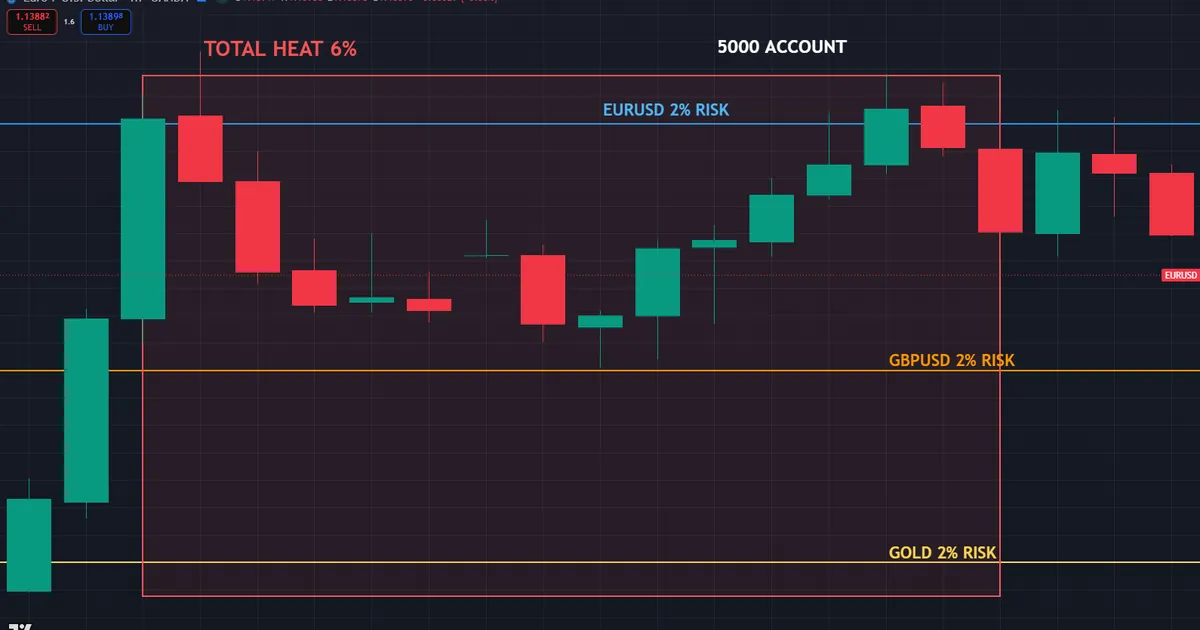
Numbers make the idea click, so add a simple book. Say you hold five thousand dollars and risk two percent per trade. So each trade puts one hundred dollars at stake.
Open three such trades, and the risk sums to three hundred dollars. That is six percent of the account, your portfolio heat for the session. So three modest trades reach a firm but sensible ceiling.
Now add a fourth at the same size. The heat climbs to eight percent, past many traders’ comfort line. So the fourth ticket, harmless on its own, tips the whole book over the edge.
Reading Heat as a Live Dashboard
Treat your heat figure like a fuel gauge for risk. It should sit somewhere on your screen, updated with every trade. So a glance tells you how much room remains before the cap.
Many traders keep a simple tally in a corner of the platform. Green means room to add, and amber means slow down. So the number guides each decision without a fresh calculation.
Because heat changes the moment a trade opens or closes, a stale figure misleads. So refresh it in real time, not once a day. That habit turns heat from a report into a working tool.
Correlation, the Hidden Multiplier
Raw heat assumes each trade moves on its own, yet forex rarely obliges. Many pairs share a currency, so they drift together. So the true risk can run higher than the simple sum suggests.
Take three long trades in EURUSD, GBPUSD, and AUDUSD. All three are shorts against the dollar in disguise. So a strong dollar day hits all three at once, and your stops may fill together.
Because the losses land as a block, correlated heat behaves like one large trade. So six percent spread over correlated pairs can sting like a single six percent bet. Our position size calculator helps you trim each leg so the cluster stays within reach.
Spotting Correlated Positions
Correlation hides behind familiar pairs, so learn to see it. Any two pairs that share a currency tend to move in step. So EURUSD and GBPUSD often rise and fall together.
Gold and the dollar tell a similar story from the other side. When the dollar weakens, gold often climbs. So a long gold trade beside a short dollar trade doubles the same bet.
Positive and Negative Correlation
Correlation runs in two directions, and both matter for heat. A positive pair moves the same way, so two longs rise and fall together. A negative pair moves in opposition, so a long in one offsets a long in the other.
Positive correlation stacks your risk into a bigger bet. So watch it closely, since your true exposure grows unseen. Negative correlation can soften a book, yet it also blunts your gains when both trades win.
Because the effect shifts over time, treat any correlation figure as rough. So leave a margin of safety rather than trusting a neat number. A modest buffer keeps a shifting relationship from surprising you.
Adjusting Heat for Correlation
Smart traders treat a correlated cluster as one position. First they group the trades that share a driver. Then they cap the group’s combined risk, not each leg alone.
So three correlated longs might share a single two percent budget rather than take two percent each. Because the trades rise and fall together, the group deserves one seat at the risk table. That grouping keeps a hidden bet from ballooning unseen.
Setting a Heat Cap
A heat cap is a firm ceiling on your total open risk. Many traders set it near six percent of equity. So once the open trades sum to that line, no new trade opens until one closes.
The exact figure is a personal choice, yet the logic is universal. A lower cap means gentler drawdowns and calmer nerves. A higher cap invites faster growth and sharper pain in a bad run.
So pick a cap you can hold through a losing streak without flinching. Because the cap only helps if you obey it, choose a number your nerves can honor. Then treat it as a hard rule rather than a loose wish.
Why Six Percent Is a Common Line
The six percent figure is a guideline, not a law. It comes from pairing a small per-trade risk with a sensible number of open trades. So three trades at two percent, or six at one percent, both land near it.
At that level, a full string of stopped trades costs a survivable slice. So the account bruises without breaking. Because a bruise heals and a break may not, many traders anchor near this line and rarely stray far above it.
Think of the cap as a speed limit rather than a goal. You need not drive at the limit on every road. So a book that often sits well below the ceiling simply leaves a wider margin for the unexpected.
Scaling the Cap to Your Style
Your cap should match how you trade. A scalper with many quick trades may keep the cap tight, since positions pile up fast. A swing trader with a few slow trades might allow a touch more room.
So let your trade frequency guide the ceiling. Because a busy style opens more tickets, it fills the cap sooner. That is a feature, not a flaw, since it stops a crowded book from overheating.
Room Left Under the Cap
The cap is a ceiling, not a target to fill. A book at three percent still has room for a strong new setup. So free heat is opportunity, held in reserve for a better trade.
Many traders rush to use every scrap of the cap. Instead, treat spare heat as a chance to wait for quality. Because the best setups arrive without warning, keeping room lets you seize them without breaching the ceiling.
Download the complete indicator database
Put these concepts on your charts. One email unlocks the full library of 1,380+ indicators with compiled MT4 and MT5 files, plus my TradingView scripts. No paywall, no spam, unsubscribe any time.
Get free access to my indicator database
One email unlocks 1,380+ free MT4, MT5 and TradingView indicators — the complete library. No single-tool download; you get the whole database.
Common Portfolio Heat Mistakes
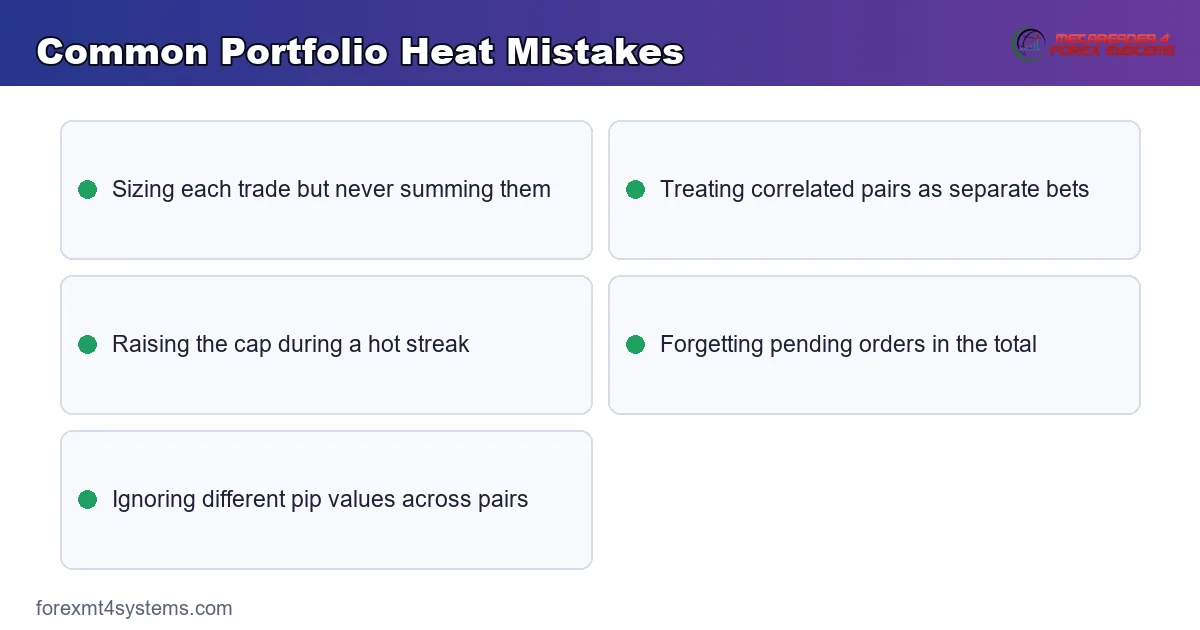
The idea is simple, yet the same errors keep books too hot. Most grow from ignoring the sum or from missing correlation. The concept graphic below sets the errors side by side, and the fixes follow beneath it.
Sizing Trades but Never Summing Them
The first slip is the most common. A trader sizes each entry with care, then never adds the open trades together. So a dozen tidy trades quietly build a reckless total. The fix is a running heat figure you check before every new ticket.
Treating Correlated Pairs as Separate
Many traders count three dollar shorts as three small bets. In truth they form one large bet on a weak dollar. So the real heat runs well above the raw sum. The fix is to group correlated trades under a single shared budget.
Raising the Cap Mid-Streak
A tempting error strikes during a hot run. Wins roll in, so the trader lifts the cap to press the advantage. Then the market turns, and the swollen book takes a heavy blow. The fix is to set the cap in calm hours and leave it fixed.
Forgetting Pending Orders
Resting orders can spring the trap unseen. A trader counts only live trades and ignores the pending ones. Then several pendings trigger at once, and the heat leaps past the cap. The fix is to count pending orders as if they were already open.
Ignoring Variable Pip Values
Not every pair risks the same amount per pip. Gold and yen crosses can carry a very different pip value. So a trade that looks small in lots may be large in dollars. The fix is to size from the true dollar risk, not the lot number alone.
Portfolio Heat Quick-Reference
Keep this short list beside your platform while the habit forms. A few seconds of checking here can spare a costly lesson later. So read each line before you commit a new trade, and glance at it until the math feels natural.
- Portfolio heat equals the sum of risk on every open trade.
- Express each trade’s risk as a percent of account equity.
- Add the percentages to get one total heat figure.
- A common heat cap sits near six percent of equity.
- Group correlated pairs and cap them as one position.
- Count pending orders toward heat before they trigger.
- Use the real stop distance, never a hopeful mental one.
Edge Cases That Catch Traders Out
Study the sharp corners as hard as the smooth path, because they do the real damage. Here is the classic one. A trader opens four dollar shorts in calm hours, each a tidy two percent.
Then a strong jobs report lifts the dollar across the board. All four stops fill within minutes, so the book loses eight percent at once. The chart below marks that case, where several correlated trades push TOTAL HEAT well past the cap.
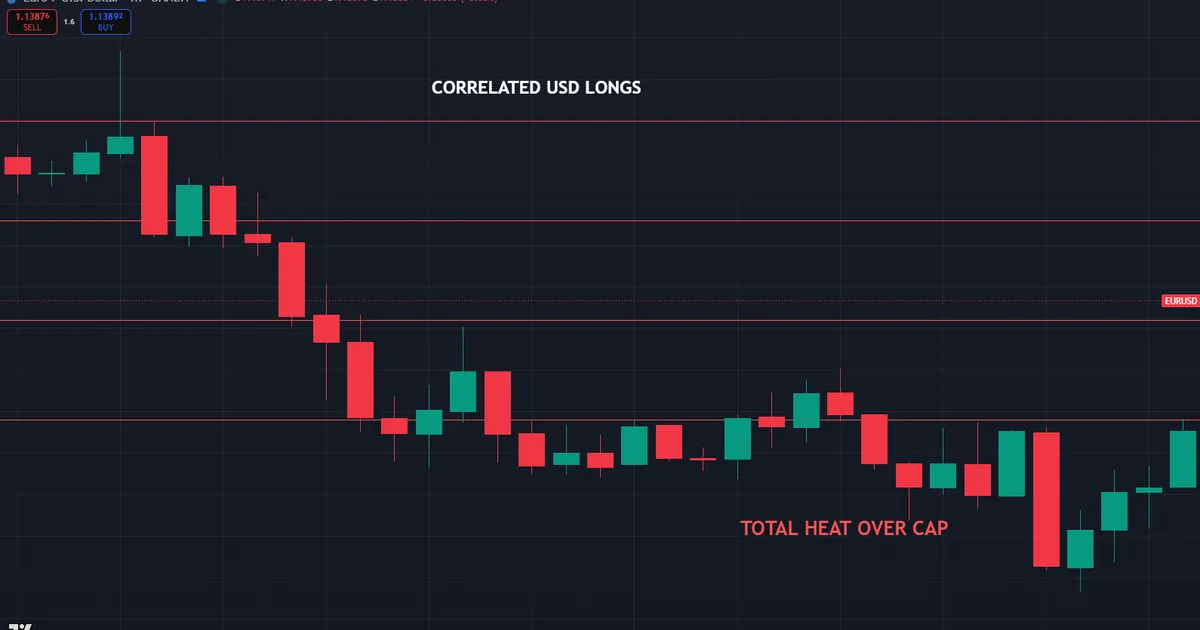
So what went wrong? The trader summed four bets that were really one. Because the pairs shared a driver, they lost together rather than in turn. Our guide to risk of ruin shows how a cluster like this lifts the odds of a deep, lasting drawdown.
Heat During Fast News
Respect the calendar when your book runs warm. Around a central-bank decision, correlated pairs can lurch together in seconds. So a heat level that felt fine in quiet hours can bite hard at the release.
Trim the book before scheduled news, then. Close a leg or two so the shared exposure drops. Because these bursts pass quickly, a lighter book usually carries you through without drama.
Heat After a Losing Streak
A run of losses shrinks equity, which quietly lifts your heat percent. So the same dollar risk now claims a bigger share of a smaller account. Many traders miss this and keep sizing as before.
Recompute heat against current equity, then. Because the account has shrunk, the old lot sizes now run hotter than the cap allows. Trimming size as equity falls keeps the heat steady through a rough patch.
Heat and Scaling Into a Trade
Adding to a winner feels safe, yet it raises heat all the same. Each new tranche puts fresh risk on the book. So a single idea can swell past its fair share of the cap.
Count every add-on as new heat, then. Because the position grows with each tranche, so does the loss if the trade turns. Cap the whole scaled trade as one line, and the book stays honest.
Heat Across Several Accounts
Some traders spread trades over more than one account. So the heat on each looks tame in isolation. Yet the same money backs them all, so the real risk is the sum across every account.
Add the accounts together before you judge the load. Because one bad day can hit all of them, the combined heat is the figure that matters. So track a master total, not a set of tidy but misleading parts.
Prop-firm traders meet this trap often. They run a personal account beside a funded one and count each cap alone. Yet a shared strategy ties the two together, so a wrong call can bruise both at once. So a single master heat figure keeps the true exposure in view.
Heat and Steady Account Growth
A controlled heat level does more than prevent disasters. It smooths the equity curve, which helps compounding do its quiet work. So a book that never overheats grows in steadier steps.
Wild swings, by contrast, drag on long-term returns. A deep drawdown needs an outsized gain just to break even. So keeping heat in check protects the math that builds an account over time.
Because survival and growth pull in the same direction here, a firm cap serves both. So the trader who respects heat tends to last longer and compound cleaner. That patience, more than any single trade, shapes the final result.
Related Concepts to Study Next
Portfolio heat sits inside a small family of risk topics, and a few reward your next reading hour. The risk you set on a single trade comes first, and the method for turning that risk into a lot size sits right beside it. Both feed directly into the heat you carry.
For the fuller view, our guides to risk per trade and to position sizing show how each ticket earns its place in the book. It also pays to see the wider habit of control, so our note on risk management in forex ties heat into a complete plan. So master the single trade first, then let the total keep your whole account safe.
FAQ
What is portfolio heat in trading?
Portfolio heat is the total risk across all your open trades at once. You work out how much each position loses if its stop fills, then add those amounts together. The sum, often shown as a percent of equity, tells you the worst plausible loss for the whole book on a bad day.
How do I calculate portfolio heat?
List every open trade with its lot size and stop distance. Turn each stop into a dollar risk using the pip value, then divide by your account equity for a percent. Add the percentages together, and the total is your portfolio heat. A calculator does this in one step across every position.
What is a good portfolio heat cap?
Many traders set a cap near six percent of equity, though the right number is personal. A lower cap softens drawdowns and calms nerves, while a higher one invites faster growth and sharper pain. Pick a level you can hold through a losing streak, then treat it as a firm rule.
How does correlation affect portfolio heat?
Correlated pairs move together, so their losses tend to land together. Three dollar shorts act like one large bet, not three small ones. That means the true heat runs above the raw sum. The fix is to group correlated trades and cap them under a single shared budget.
Should pending orders count toward heat?
Yes. A pending order can trigger at any moment and add its risk to the book. If several fire at once, the heat can leap past your cap before you react. So count pending orders as if they were already open, and size new trades around them.
Why does heat rise after losses?
A losing streak shrinks your equity, so each fixed dollar risk claims a larger share of a smaller account. The lot sizes you set earlier now run hotter than the cap allows. Recompute heat against current equity and trim size as the balance falls. Results are not guaranteed; past performance is not indicative of future results.
External references
- For background on this concept, see Correlation at Corporate Finance Institute.
- For broader market context, see Diversification (finance) on Wikipedia.

About the author
Written by Dominic Walsh, a Forex trader and MT4/MT5 indicator, Expert Advisor and script developer. Every tool on forexmt4systems.com is tested on live charts before release and ships with ready-to-use compiled MT4 (.ex4) and MT5 (.ex5) files. Learn more about the trader and developer behind this site.
How we build, test and correct every tool: Editorial & Testing Policy. Trading carries risk; see the disclaimer.