
Learning how to use ATR for position sizing lets the market itself decide your stop and your lot. The Average True Range measures how far price typically moves, so a stop built on it flexes with real volatility instead of a fixed guess.
This guide explains how to use ATR for position sizing step by step, for a trader who wants sizes that adapt to the market. You will meet the indicator, turn its reading into a stop distance, and convert that into a volatility-adjusted lot. Worked examples on real pairs tie every step to an order ticket.
What ATR Measures
The Average True Range is an indicator that gauges how far a pair moves in an average bar. Welles Wilder built it to capture volatility, not direction. So a rising ATR means wider swings, while a falling one means calmer price.
ATR works from the true range of each bar. That range is the largest of three gaps: high to low, high to the prior close, or low to the prior close. Averaging those over a period, often fourteen bars, gives the ATR reading.
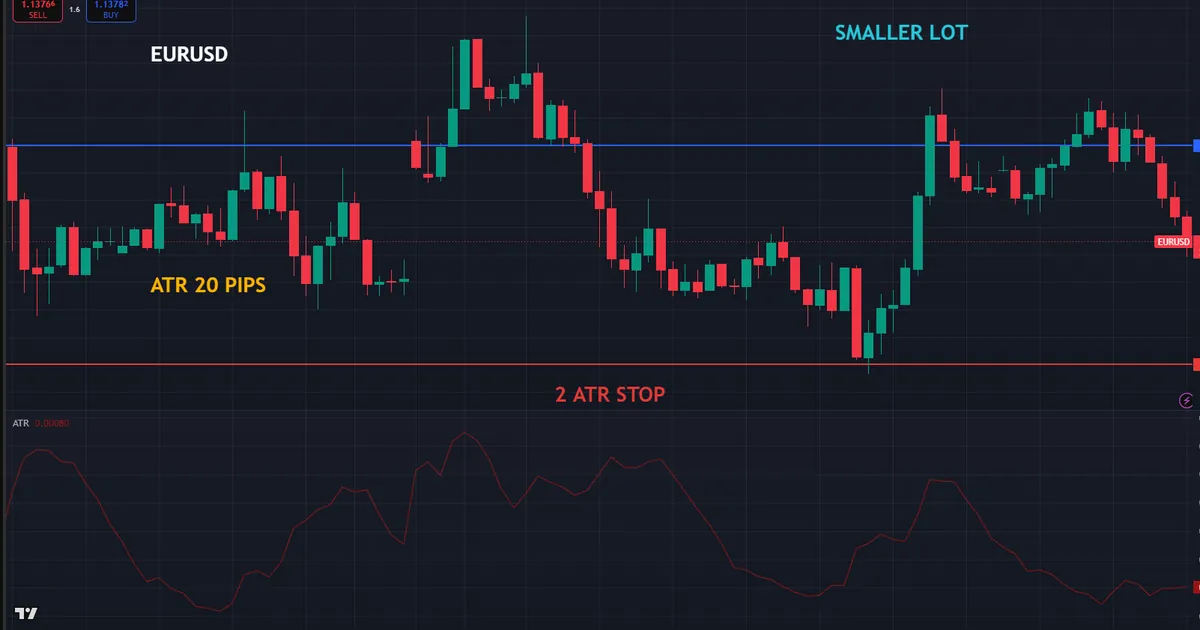
Read ATR as a distance, usually in pips once you scale it. A EURUSD ATR of twenty pips means the pair travels about twenty pips in a typical bar. So the number tells you how much room a trade needs to breathe.
Why Volatility Belongs in Sizing
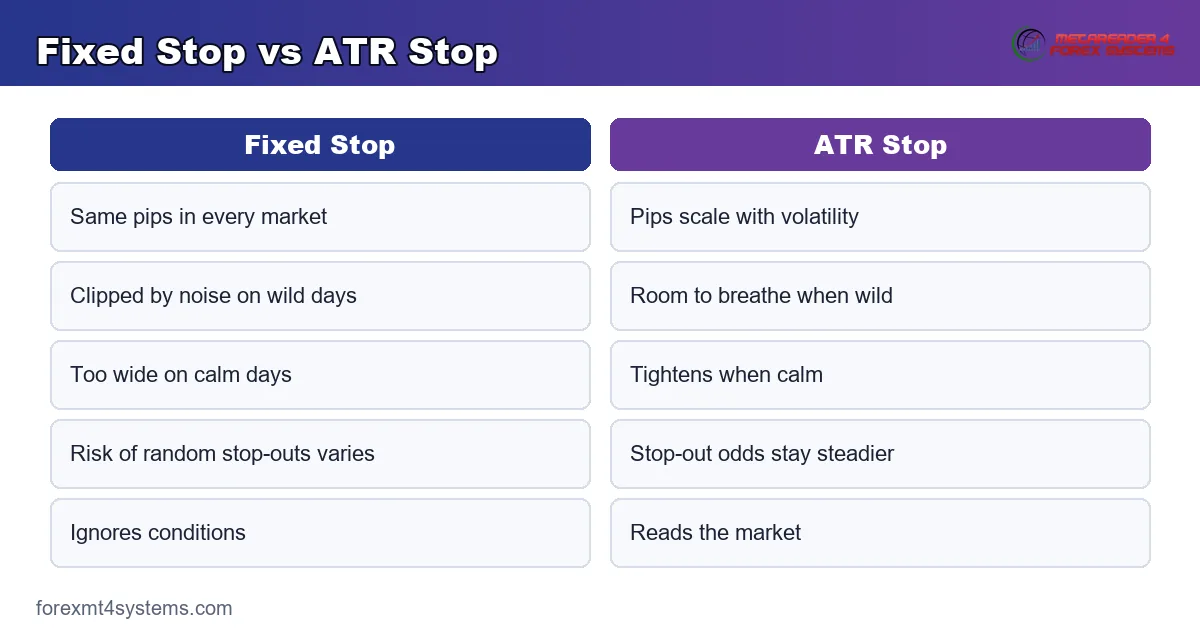
A fixed stop ignores whether the market is calm or wild. Twenty pips may be ample in a quiet session yet trivial in a fast one. So a stop that never changes gets clipped by normal noise on busy days.
ATR fixes that by scaling the stop to conditions. When volatility rises, the ATR stop widens to give the trade room. Because the stop adapts, your exits reflect the market rather than a habit.
How to Use ATR for Position Sizing, Step by Step
The method chains three familiar ideas: read the ATR, build a stop from it, then size the lot. Each step feeds the next, and the last one hands you a tradable number.
- Read the ATR in pips. Apply the Average True Range indicator and note its current value.
- Pick a multiplier. Choose how many ATRs your stop spans, often between one and a half and three.
- Build the stop distance. Multiply the ATR by the multiplier to get the stop in pips.
- Set the risk in money. Take your risk percent of the account balance.
- Divide into a lot. Spread the risk over the stop and the pip value to get the size.
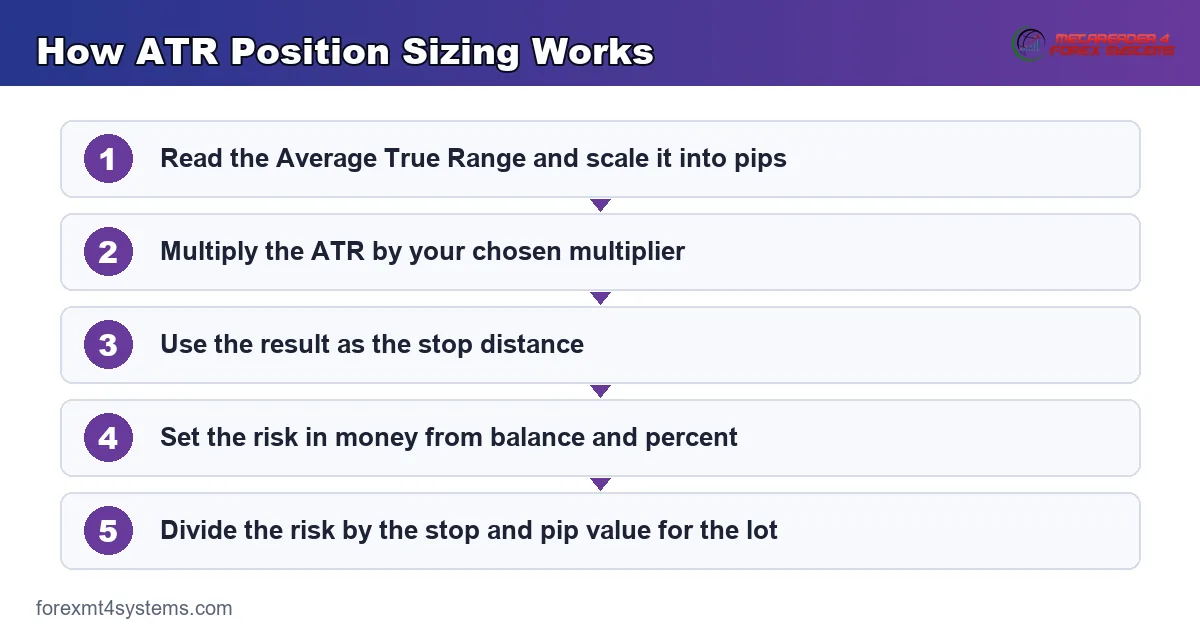
Run those five, and volatility flows straight into the lot. The ATR sets the stop, the stop spreads the risk, and the pip value converts it. So a wild market quietly shrinks the size while a calm one lets it grow.
Reading the ATR Value
Apply the indicator with a standard period, and it prints a value below the chart. Scale that value into pips for the pair you trade. So a EURUSD reading of 0.0020 is twenty pips, the distance a typical bar covers.
Note the reading at the moment you plan the trade. ATR shifts as volatility changes, so a stale value missizes the stop. Because it moves, treat the current print as the input, not yesterday’s number.
Choosing the Multiplier
The multiplier decides how much room the trade gets beyond one average bar. A tight one and a half ATR keeps stops close, while a loose three ATR gives wide berth. So the choice trades survival room against stop size.
Two ATR is a common middle ground. It sets the stop far enough to survive ordinary noise yet close enough to keep the lot meaningful. So many traders start there and adjust to their style.
A Full Worked Example
Numbers make the method concrete, so walk one through. You hold a five thousand dollar account and risk one percent on a EURUSD trade near 1.14.
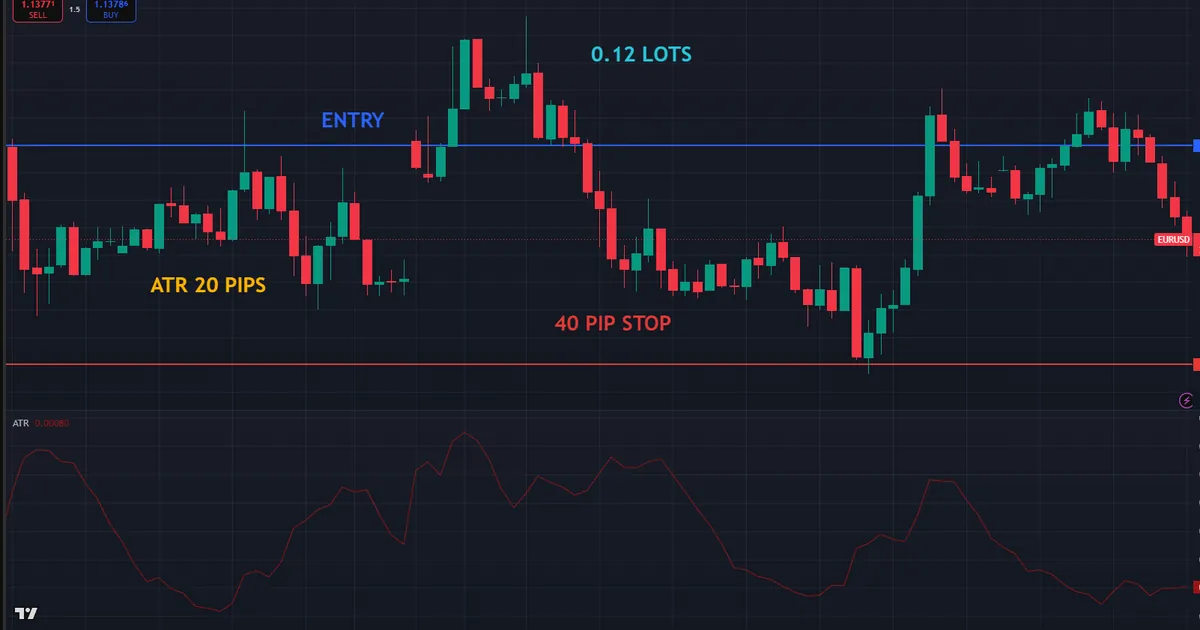
First, read the ATR. The Average True Range prints twenty pips on your timeframe. That is the distance a typical bar covers right now.
Next, apply a two ATR multiplier. Twenty pips times two gives a forty pip stop. So the trade gets two average bars of room before the stop triggers.
From Stop to Lot
Now set the risk in money. One percent of five thousand is fifty dollars, the most this trade may lose. That figure caps the whole calculation.
Finally, size the lot. Divide fifty dollars by the forty pip stop to get one dollar and twenty-five cents a pip, then divide by ten dollars a standard lot. So the size lands near 0.12 lots, and a two ATR loss costs the planned fifty dollars. Our ATR position size calculator runs this chain from the ATR reading in one entry.
Why ATR Sizing Steadies the Risk
The real gift of ATR sizing is a steadier dollar risk across conditions. A fixed stop lets volatility change how often you get clipped. An ATR stop holds the odds of a random stop-out roughly constant.
Watch what happens when volatility climbs. The ATR rises, the stop widens, and the lot shrinks to keep the same fifty dollar risk. So a stormy market automatically trades you smaller, which is exactly the instinct to protect.
A High-Volatility Example
Return to the EURUSD trade, but now the ATR reads thirty pips. A two ATR stop stretches to sixty pips instead of forty. So the same fifty dollar risk spreads over more ground.
The lot falls to match. Fifty dollars over sixty pips needs about eighty-three cents a pip, near 0.08 lots. So the size dropped from 0.12 to 0.08 purely because the market grew wilder.
A Low-Volatility Example
Now imagine a calm session with a ten pip ATR. A two ATR stop tightens to twenty pips, and the lot grows. Fifty dollars over twenty pips supports two dollars and fifty cents a pip, near 0.25 lots.
The pattern is clear across all three cases. Quiet markets earn a larger lot, and wild ones a smaller one, at a fixed risk. So ATR sizing does the adjusting that a fixed stop never could.
Download the complete indicator database
Put these concepts on your charts. One email unlocks the full library of 1,380+ indicators with compiled MT4 and MT5 files, plus my TradingView scripts. No paywall, no spam, unsubscribe any time.
Get free access to my indicator database
One email unlocks 1,380+ free MT4, MT5 and TradingView indicators — the complete library. No single-tool download; you get the whole database.
Matching ATR to Timeframe and Pair
ATR reads differently across timeframes, so the input must match your trading clock. An hourly ATR suits an hourly trade, while a daily ATR suits a swing hold. So pull the ATR from the same chart you trade.
Mixing them distorts the stop badly. A daily ATR on an intraday trade would set a stop many times too wide. Because the scales differ, one clean rule is to read ATR on the timeframe of the entry.
ATR Across Different Pairs
Each pair carries its own volatility, so ATR values vary widely. A quiet cross may print a small ATR, while gold near four thousand prints a large one. So the multiplier stays the same while the raw ATR changes per market.
This is a feature, not a flaw. ATR sizing reads each pair’s real movement and sizes accordingly. So a volatile market like gold gets a wider stop and a smaller lot without any extra thought.
Keeping the Multiplier Consistent
One steadying habit is to fix the multiplier across trades. A constant two ATR applied everywhere keeps your method comparable. So the only thing changing between trades is the ATR reading itself.
A consistent multiplier also makes your journal readable. When the rule never moves, your results reflect the setups rather than a shifting stop policy. So discipline in that one choice pays off across a whole record.
Setting the Risk Percent for ATR Trades
ATR builds the stop, yet you still choose the risk percent that sizes the lot. So the two inputs work as partners, and both deserve care. A sound stop paired with a reckless percent still overtrades the account.
Most traders anchor the percent between half a percent and two percent. So a fifty dollar loss on a five thousand dollar account fits the middle of that range. The ATR then decides how that risk spreads, while the percent decides its size.
Keeping the Percent Fixed
The percent should hold steady while the ATR does the flexing. Raising the percent on calm days undoes the very balance ATR provides. So fix the risk figure, and let volatility alone move the lot from trade to trade.
A fixed percent also keeps your results readable. When only the ATR changes, your journal reflects market conditions rather than shifting nerve. So discipline in that one field sharpens every later review.
Blending ATR With a Hard Cap
Even ATR sizing can suggest a large lot in very calm markets. A tiny ATR tightens the stop, which pushes the lot upward. So many traders add a hard cap, refusing to size beyond a set percent whatever the ATR implies.
The cap acts as a seatbelt on the method. It stops an unusually quiet reading from encouraging an oversized position. So the ATR still steers the size, but the cap keeps it inside a sane range.
ATR Sizing on a Small Account
A small balance meets the broker’s minimum lot sooner than a large one. So ATR sizing can return a size below what you can actually trade. Knowing that limit keeps your expectations honest.
On a two hundred dollar account, one percent is only two dollars of risk. A forty pip ATR stop then needs a very small pip value, often below one micro lot. So the smallest tradable size may already risk more than one percent.
Reading a Sub-Minimum Lot
When ATR sizing returns a lot below the broker floor, it is signalling a mismatch. Your risk simply cannot fit the smallest trade the broker allows at that stop. So either the balance is too small or the ATR stop is too wide for that percent.
The honest fix is patience over force. Grow the account, or trade a timeframe with a tighter ATR that fits your size. So the returned lot lands at or above the minimum without breaking the risk plan.
Choosing a Timeframe That Fits
Timeframe shapes the ATR, and the ATR shapes the stop. A daily ATR sets a wide stop that a small account cannot size, while an hourly one sits tighter. So a smaller balance often suits a lower timeframe with a smaller ATR.
This choice keeps the method usable as the account grows. Start on a timeframe whose ATR fits your size, then widen as the balance allows. So the same rule scales with you rather than locking you out early.
ATR Sizing in a Trend Versus a Range
Market character changes how the ATR reads, so the method feels different in each. A trending market often carries a steady ATR, while a choppy range can spike it. So the same rule adapts as conditions shift beneath it.
In a clean trend, ATR stays fairly consistent from bar to bar. Your stops and lots then hold a steady rhythm. Because the range is stable, ATR sizing tracks the trend without constant resizing.
Handling a Volatile Range
A ragged range can jerk the ATR around as price whips back and forth. That inflates the stop and shrinks the lot right when signals are weakest. So ATR sizing quietly trades you smaller in exactly the conditions worth avoiding.
Some traders welcome that effect as a filter. A ballooning ATR and a tiny lot hint that the market is hard to trade. So the sizing itself nudges you toward patience until the range calms.
Letting ATR Guide Expectations
Watching the ATR over time teaches the pair’s normal behavior. A reading far above its usual range warns of stormy conditions. So the indicator does more than size a trade; it sets a realistic mood for the session.
Pair that read with your own plan for a fuller picture. ATR handles the how-big question, while your strategy answers the whether-to-trade one. So the two together make a steadier routine than either alone.
Common ATR Sizing Mistakes and Fixes
The chain is short, yet a few errors recur. Most trace back to the ATR reading or the multiplier, and the graphic sums up the fixes.
Using a Stale ATR Value
ATR shifts with the market, so an old reading missizes the stop. A value from a calmer hour sets a stop too tight for now. So read the ATR fresh at the moment you plan the trade.
Picking Too Tight a Multiplier
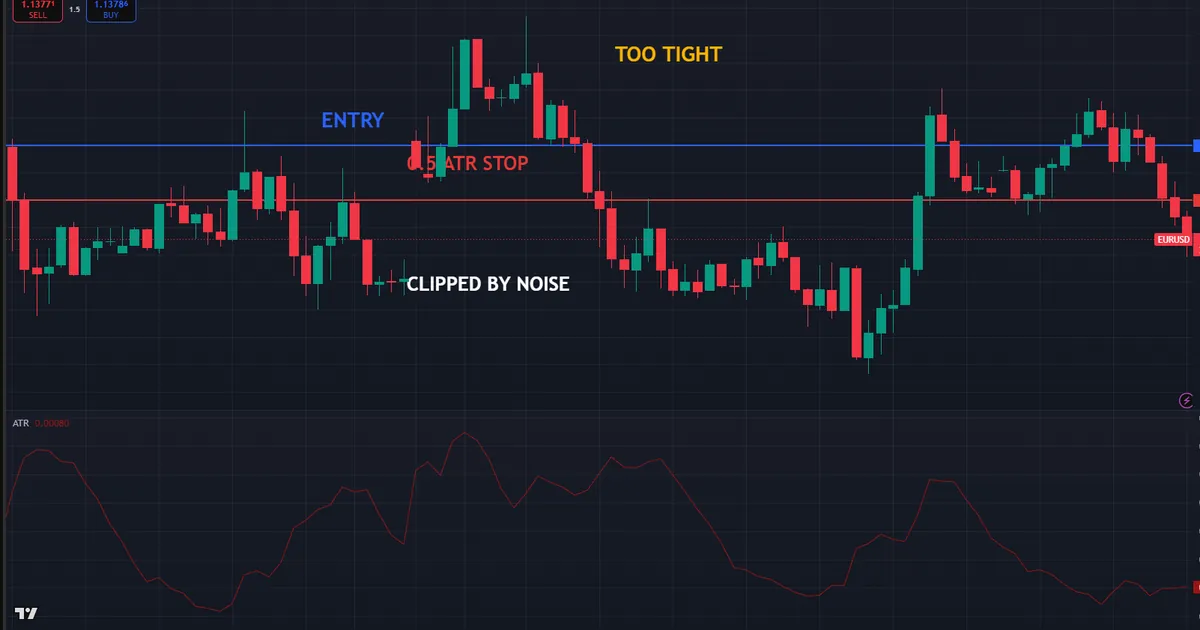
A half ATR stop sits inside normal noise and gets clipped often. That turns good setups into random losses. So keep the multiplier at one and a half ATR or more to survive ordinary swings.
Forgetting to Scale ATR Into Pips
The raw ATR value is a price figure, not a pip count. Feeding the price straight into a stop confuses the math. So scale the reading into pips first, then build the stop distance.
Mixing Timeframes
Reading ATR on one chart and trading on another warps the stop. A daily ATR on a five minute trade balloons the size. So pull the ATR from the same timeframe you enter on.
Ignoring the Broker Lot Step
ATR sizing can return an odd lot like 0.083. Your broker may only trade in 0.01 steps. So round the result down to the nearest allowed step, and the risk stays inside the plan.
ATR Position Sizing Quick Reference
Keep this short list beside the chart. Run through it before you size any ATR-based trade.
- Apply the Average True Range and scale the reading into pips.
- Pick a multiplier, often between one and a half and three.
- Multiply ATR by the multiplier for the stop distance.
- Set the risk in money as balance times risk percent.
- Divide the risk by the stop and the pip value for the lot.
- Round the lot down to the broker’s allowed step.
Pitfalls and Edge Cases
A few situations bend the clean method, so keep them in view. A stop set at half the ATR, shown earlier, gets caught by ordinary noise again and again.
News Spikes Distort ATR
A single violent bar can jerk the ATR upward for a while. Sizing on that inflated reading sets a needlessly wide stop and a tiny lot. So wait for the spike to settle, or read ATR from before the shock.
Very Quiet Markets Shrink the Stop
A tiny ATR can set a stop so tight that spread alone threatens it. Then the trade risks a stop-out before it can move. So add a small floor to the stop when the ATR reads unusually low.
That floor keeps a calm reading from over-tightening the exit. A stop must clear the spread and a little noise to be workable. So blend the ATR stop with a sensible minimum, and the trade gets room even in quiet conditions.
ATR Lags Sudden Regime Shifts
ATR is an average, so it reacts slowly when volatility jumps. A market that turns wild in minutes may still show a calm reading. So watch recent bars directly when conditions change fast, rather than trusting a lagging average alone.
ATR Ignores Direction Entirely
ATR measures range, not trend, so it never tells you which way to trade. It sizes the stop but cannot confirm the setup. So pair ATR sizing with a separate method that decides direction.
This split of duties is a strength once you accept it. Let your strategy find the trade and its direction, then let ATR size the risk around it. So each tool does the job it is built for, and neither strays into the other’s lane.
Related Concepts to Study Next
ATR sizing links volatility to your lot, and a few nearby ideas complete the picture. The stop distance it builds deserves its own study, the sizing math underneath carries the number, and the indicator itself rewards a closer look.
Start with our guide on ATR stop loss distance for the stop half of the method. Then read position sizing for the math the ATR feeds, and set the risk input with how much to risk per trade. To understand the indicator, see what ATR is in trading, and size any trade with our position size calculator.
FAQ
How do I use ATR for position sizing?
Read the Average True Range in pips, then multiply it by your chosen multiplier for a stop distance. Take your risk percent of the balance as the money at stake. Divide that risk by the stop and the pip value to get the lot.
What ATR multiplier should I use for stops?
Most traders set the stop between one and a half and three times the ATR. Two ATR is a common middle ground that survives ordinary noise. A tighter multiplier gets clipped more often, so keep it at one and a half or more.
Why does a higher ATR give a smaller lot?
A higher ATR widens the stop, which spreads the same risk over more pips. Spreading the fixed risk further means each pip carries less, so the lot shrinks. That is how ATR sizing trades you smaller when markets turn wild.
Which timeframe should I read ATR from?
Read ATR from the same timeframe you enter on, so the scale matches the trade. A daily ATR on an intraday trade sets a stop far too wide. Keeping the ATR and the entry on one chart keeps the stop sensible.
Does ATR tell me when to enter a trade?
No, ATR measures range and volatility, not direction. It sizes the stop and the lot but never confirms a setup. So pair ATR sizing with a separate method that decides when and where to trade.
Can I size every pair with the same ATR rule?
Yes, the same multiplier works across pairs while the raw ATR changes per market. A volatile pair prints a larger ATR and earns a wider stop and smaller lot. Size every trade with care, and manage each position closely. Results are not guaranteed; past performance is not indicative of future results.
External references
- For background on this concept, see Average Absolute Deviation on Wikipedia.
- For broader market context, see Contract Size at Investopedia.

About the author
Written by Dominic Walsh, a Forex trader and MT4/MT5 indicator, Expert Advisor and script developer. Every tool on forexmt4systems.com is tested on live charts before release and ships with ready-to-use compiled MT4 (.ex4) and MT5 (.ex5) files. Learn more about the trader and developer behind this site.
How we build, test and correct every tool: Editorial & Testing Policy. Trading carries risk; see the disclaimer.