
Understanding what is ATR in trading gives you a simple number for one hard question: how much does this market normally move? The Average True Range measures that daily travel in pips, and it turns vague ideas about volatility into a figure you can size a trade around.
This guide answers what is ATR in trading and then puts it to work. So by the end, you will read the ATR line, place a stop that respects real volatility, and size a position so each loss stays controlled.
What Is ATR in Trading?
The Average True Range is a volatility indicator built by J. Welles Wilder in 1978. He introduced it in his book on technical trading systems, alongside the RSI and the Parabolic SAR. So it comes from the same toolkit many traders still lean on today.
ATR answers one question and one only. How far does price travel in an average bar? A high reading means wide, fast candles and a nervous market. A low reading means tight, slow candles and a calm one.
One point matters above all others. ATR is not directional. It never tells you whether price will rise or fall, only how far it tends to move. So a rising ATR during a sell-off and a rising ATR during a rally look the same. The tool measures energy, not direction.
Look at a concrete case. The chart shows EURUSD on the daily timeframe with a 14-period ATR plotted below price. As a tight range gives way to a sharp directional expansion, the ATR line climbs sharply off its earlier lows and keeps rising bar by bar. That steady jump is volatility waking up.

Now trace the reading from left to right. First the ATR sits low while price coils in a quiet range. Then a strong move breaks out and the ATR line rises with it. Because the candles grew, the average travel grew too. So the ATR confirmed the shift in pace without ever hinting at the direction.
Why does this matter for real trades? Volatility sets the correct distance for a stop and the correct size for a position. So a trader who reads ATR places stops that survive normal noise, while a trader who ignores it gets stopped out by ordinary wiggles.
How ATR Is Calculated
The math is small, so learn it once and reuse it forever. Two steps turn raw candles into the ATR line.
- True range of each bar. Take the largest of three values: the current high minus the current low, the high minus the previous close, or the previous close minus the current low.
- Why three values. Using the previous close captures gaps, so an overnight jump still counts as real range rather than vanishing.
- The average. Smooth the true range over 14 periods with Wilder’s method, which weights the running average rather than dropping old bars sharply.
- The result. The line reads in the same units as price, so a forex ATR is quoted in pips you can act on directly.
- The update. Each new bar nudges the average up or down, so the line breathes with the market in real time.
So the true range is just the honest full travel of a bar, gaps included. The concept graphic below walks through the three measurements and how the largest one wins.

One detail helps here. Wilder’s smoothing makes the ATR steadier than a plain average would be. Because old readings fade gradually, a single wild candle lifts the line without spiking it, and the number stays useful rather than jumpy.
Notice why gaps matter so much. In forex, weekends and news can leave a hole between one close and the next open. Without the previous-close comparison, that hole would simply disappear from the range. So the true range keeps it, and your risk read stays honest across the gap.
Reading the ATR Value in Pips
The reading is an absolute number, not a percentage. An ATR of 80 on EURUSD means the pair travels about 80 pips in an average daily bar. So the figure is only comparable within the same instrument and timeframe.
Watch the trend of the line more than any single value. A rising ATR warns that ranges are widening, which argues for wider stops and smaller size. Meanwhile a falling ATR shows the market calming, which allows tighter stops and steadier setups. So the direction of the line guides your risk long before any entry signal appears.
Build a feel for each pair over time. Majors like EURUSD often run calmer than pairs carrying more risk, such as GBPJPY. Because every symbol has its own normal range, a reading that looks large on one can be routine on another. So keep a rough sense of each pair’s typical ATR, and judge today’s value against that baseline rather than a blank number.
Using ATR for Stop Placement
This is where ATR earns its keep. A stop needs to sit beyond normal noise, and ATR measures exactly that noise.
The rule is simple. Place your stop a multiple of ATR away from entry, often 1.5 or 2 times the current reading. So if ATR is 20 pips, a two-times stop sits 40 pips from entry. Because that distance reflects real volatility, ordinary swings will not tag it.
The multiple depends on your style. A scalper might use one times ATR for a tight leash, while a swing trader might use three times to ride out deeper pullbacks. So pick the multiple that matches your holding time, then keep it consistent across trades.
Also let ATR trail a winner. A common trailing method, the chandelier exit, sets the stop at the highest high since entry minus three times ATR. As price climbs, the stop climbs with it, yet it always leaves room for normal volatility. So the trade stays in until a genuine reversal, not a routine dip.
ATR Stops Versus Fixed Stops
Compare the two approaches directly. A fixed stop uses the same pip distance on every trade, no matter the market. An ATR stop scales that distance to current volatility instead. So the fixed stop feels simple, yet it sits too tight on a wild pair and too wide on a calm one.
The ATR version fixes both problems at once. Because the distance tracks the real range, your stop lands in a sensible spot on any symbol or session. So a single rule, a set multiple of ATR, adapts to conditions without any guesswork. That adaptability is why so many systematic traders build their risk around it.
Using ATR for Position Sizing
Stop distance and position size are two halves of one decision. ATR sets the first, and the first sets the second.
Work in the right order. First fix the cash you will risk, usually a small percent of the account, such as one percent. Then read the ATR and set your stop distance from it. Finally divide the risk by the stop distance to find the position size. Because the stop already respects volatility, the size adjusts automatically to each market.
Notice the effect. A calm pair with a small ATR allows a larger position for the same risk, while a wild pair with a large ATR demands a smaller one. So ATR sizing keeps your risk steady even as volatility swings. Our free position size calculator runs this arithmetic in seconds, and our forex volatility calculator reads the current ATR-style range for you.
This is the habit that protects an account. Because size flexes with volatility, a quiet week and a chaotic week both cost the same when a stop is hit. So your equity curve smooths out, and no single trade can do outsized damage. Truly, consistent risk beats clever entries over a long run.
Settings, Timeframes, and Pairing
The default 14-period ATR suits most charts, and I would start there before changing anything. Still, the length can flex once you know why you are moving it.
A shorter length, such as 7, reacts faster to fresh volatility and suits intraday work. A longer length, such as 20 or 50, smooths the reading and suits swing and position trades. So shorten it for speed and lengthen it for calm, changing one variable at a time.
Pair ATR with a directional tool, since ATR alone never picks a side. A trend read or a moving average names the direction, and our guide to SMA vs EMA covers that choice. Then a trailing tool can manage the exit, and our guide to the parabolic SAR shows a natural partner for a volatility stop.
Also respect the clock. Volatility clusters inside the London window and the New York morning, roughly 2:00 to 5:00 a.m. and 8:00 to 11:00 a.m. New York time. Because ranges widen there, an ATR read taken in quiet Asian hours will understate the risk once London opens. So refresh the reading as the active session begins.
Matching ATR to Your Timeframe
Read the ATR on the same chart you trade. A daily ATR sizes a swing trade, while a five-minute ATR sizes a scalp. Because the average travel differs hugely between those windows, mixing them wrecks your risk math. So always pull the reading from your working timeframe, not a larger one.
Then let the number scale your whole plan. A wider ATR means wider stops, wider targets, and smaller size, all at once. Because every part of the trade flexes together, the reward-to-risk ratio stays intact even as volatility changes. So the tool keeps your plan consistent across calm and stormy markets alike.
Worked Example: Sizing a EURUSD Trade
Picture a long setup on EURUSD forming on the four-hour chart after a pullback. The 14-period ATR reads about 16 pips, so the market is moving at a moderate pace. A trend tool already points up, which gives the direction ATR cannot.
Now build the risk plan. A two-times ATR stop sits about 32 pips below entry, comfortably beyond the recent noise. The chart below marks the entry, the ATR reading, and the volatility-based stop beneath it.

Then the size falls out of the numbers. With the account risk fixed at one percent and the stop set near 32 pips, the position size is simply the risk divided by that distance. Because the stop respects real volatility, a normal dip will not trigger it, yet the loss stays capped if the idea fails.
The follow-through rewarded the structure. Price pulled back once, held above the wide stop, and then pushed to target as the trend resumed. So the ATR stop absorbed the noise that a tight stop would have caught. That cushion is the whole point of sizing around volatility rather than a fixed pip count.
Contrast the fixed-stop version to see the gain. A trader using a flat 20-pip stop on this same setup would have been tagged by the routine pullback, then watched the trade run without them. Because the ATR stop gave the move room to breathe, the position survived the noise and reached its goal. So the volatility read did not just size the trade; it kept the trader in it.
Download the complete indicator database
Put these concepts on your charts. One email unlocks the full library of 1,380+ indicators with compiled MT4 and MT5 files, plus my TradingView scripts. No paywall, no spam, unsubscribe any time.
Get free access to my indicator database
One email unlocks 1,380+ free MT4, MT5 and TradingView indicators — the complete library. No single-tool download; you get the whole database.
Common Mistakes and How to Fix Them
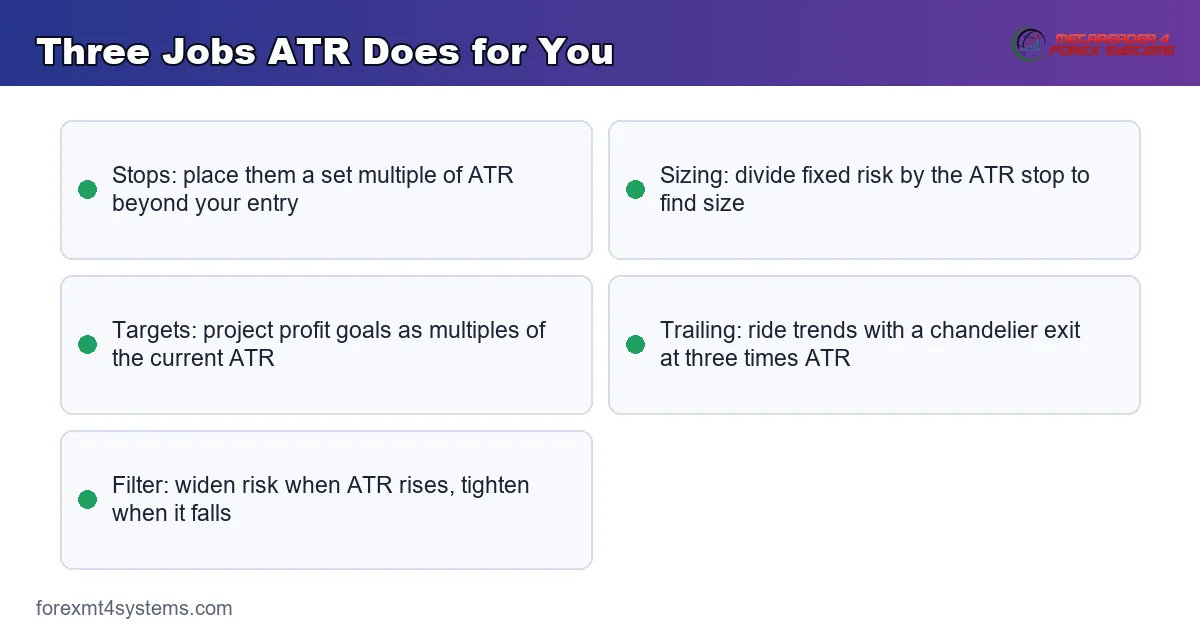
The tool is simple, yet the same errors repeat on every timeframe. Most trace back to asking ATR for something it cannot give, and the fixes follow beneath the graphic.
Reading ATR as a Direction Signal
A rising ATR shows bigger moves, not a coming rally or sell-off. Traders who buy on a high reading mistake energy for direction. So always pair ATR with a separate trend or structure read before you pick a side.
Using a Fixed Pip Stop Everywhere
A 20-pip stop that fits a quiet pair gets shredded on a wild one. Fixed distances ignore how volatility shifts between markets and sessions. Instead, set every stop as a multiple of the current ATR so it scales with conditions.
Comparing ATR Across Different Pairs
An ATR of 90 on one pair and 30 on another says nothing about which is riskier in percent terms. The number is absolute, tied to each instrument’s price. So compare a pair only with its own history, never against a different symbol.
Ignoring the Session and the News
A calm ATR before a major release badly understates the coming risk. Volatility can triple in a single candle when data hits. So widen stops or stand aside around scheduled news, whatever the current reading says.
Forgetting to Refresh the Reading
ATR changes every bar, yet many traders read it once and forget it. A stale value leads to stops that no longer fit. Truly, glance at the live reading right before each entry, not an hour earlier.
Pre-Trade ATR Checklist
Run this short list before every entry. A few seconds here saves hours of regret later. So keep it in view, tick each item honestly, and let a missing check talk you out of a marginal trade.
- Direction confirmed by a separate trend or structure tool.
- Current ATR reading refreshed on your working timeframe.
- Stop set as a consistent multiple of that ATR.
- Risk fixed as a small percent of the account.
- Position size calculated from the risk and the stop distance.
- An active session, London or New York, open now.
- No major news release due inside your trade window.
When ATR Misleads
Study the failure case as hard as the winner. Here is a common one. A trader sees a very low ATR on GBPUSD before a central bank decision and sets a tight stop to match the calm. Every reading says the market is sleepy.
Then the release hits. Price gaps violently, the candle stretches far beyond the tiny stop, and the position closes at a much worse level than planned. The chart below shows that news spike, with the low pre-event ATR and the gap that jumped the stop.

So what went wrong? ATR measures past volatility, not future shocks. A quiet reading cannot foresee a scheduled event that changes everything in one candle. Hence the rule that limits the damage: widen stops or step aside around known news, no matter how calm the ATR looks. Volatility that has not happened yet never shows up in the average.
Then respect the gap risk that ATR cannot price. Weekends, holidays, and major data all carry jump risk that a smooth line will miss. Because a gap can leap a stop entirely, size down before such events so a single jump stays survivable. A wider band tool can help you see the stretch, and our guide to Bollinger Bands pairs volatility with visible zones.
Choppy Ranges Inflate the Picture
Be careful in wide, directionless chop. There the ATR can read high while price goes nowhere, since big candles in both directions still count as range. So a high reading is not always a trend worth trading. Instead, confirm a clear direction first, and treat a high ATR inside a box as a warning to size down rather than a green light.
Lagging Volatility Cuts Both Ways
Be honest about the built-in delay. ATR reacts to volatility after it appears, not before. So the line is often low right as a big move begins and high right as it ends. Treat a fresh spike as a warning to widen risk, and treat a long calm as a reason to stay alert rather than complacent.
Related Concepts to Study Next
ATR connects to a web of sibling tools, and a few ideas deserve your next reading hour. A volatility stop still needs a direction, which is where a trailing tool like the parabolic SAR earns its place beside it. The choice of trend line also shapes every entry, so weigh a fast average against a slow one before you commit. Both partners appear in the pairing section above, ready to name the side that ATR never will.
For hands-free charting, the volatility indicators archive plots ATR and its cousins automatically, while the bands and channels indicators archive frames the same volatility as visible zones. Tools speed the work, yet the logic above still carries the trade. So master the volatility read first on your own, and then let any indicator on the chart simply plot the range that you already know exactly how to read and use.
FAQ
What does ATR measure in trading?
ATR measures volatility, the average distance price travels in a bar, quoted in the same units as price. A high reading means wide, fast candles, and a low reading means tight, slow ones. It says nothing about direction.
What is a good ATR setting?
The 14-period ATR that Wilder designed suits most charts and timeframes. Shorten it to around 7 for faster intraday work, or lengthen it to 20 or 50 for calmer swing reads. Change one variable at a time and test it.
How do I use ATR for stop loss?
Place your stop a multiple of ATR away from entry, often 1.5 or 2 times the current reading. That distance sits beyond normal noise, so routine swings will not tag it. Match the multiple to your holding time and keep it consistent.
Can ATR tell me which way price will move?
No, ATR is not directional. It measures how far price travels, not whether it rises or falls. So pair it with a trend or structure tool that names the side before you enter any trade.
How does ATR help with position sizing?
ATR sets a volatility-based stop, and your position size then follows from the risk divided by that stop. A wild pair gets a smaller size and a calm pair a larger one for the same risk. So your loss per trade stays steady across markets.
Is ATR reliable during news events?
ATR reads past volatility, so it cannot foresee a news shock that gaps price in one candle. Widen stops or stand aside around scheduled releases. Manage risk on every trade. Results are not guaranteed; past performance is not indicative of future results.
External references
- For background on this concept, see Average True Range at Investopedia.
- For broader market context, see Average True Range at BabyPips Forexpedia.

About the author
Written by Dominic Walsh, a Forex trader and MT4/MT5 indicator, Expert Advisor and script developer. Every tool on forexmt4systems.com is tested on live charts before release and ships with ready-to-use compiled MT4 (.ex4) and MT5 (.ex5) files. Learn more about the trader and developer behind this site.
How we build, test and correct every tool: Editorial & Testing Policy. Trading carries risk; see the disclaimer.