
Price gets all the attention, yet volume often moves first, and that is the whole reason to have the OBV indicator explained clearly. On Balance Volume folds every bar’s volume into one running line, so you can see whether buying or selling pressure is really building beneath a move.
This guide gets the OBV indicator explained from the first calculation to the live chart. So by the end, you will know how the line is built, how it confirms a trend, and how a quiet divergence in it can warn you before price finally turns.
OBV Indicator Explained: The Basics
On Balance Volume is a running total of volume that rises or falls with each closing price. Joe Granville introduced it in his 1963 book, Granville’s New Key to Stock Market Profits, and the idea behind it still holds today.
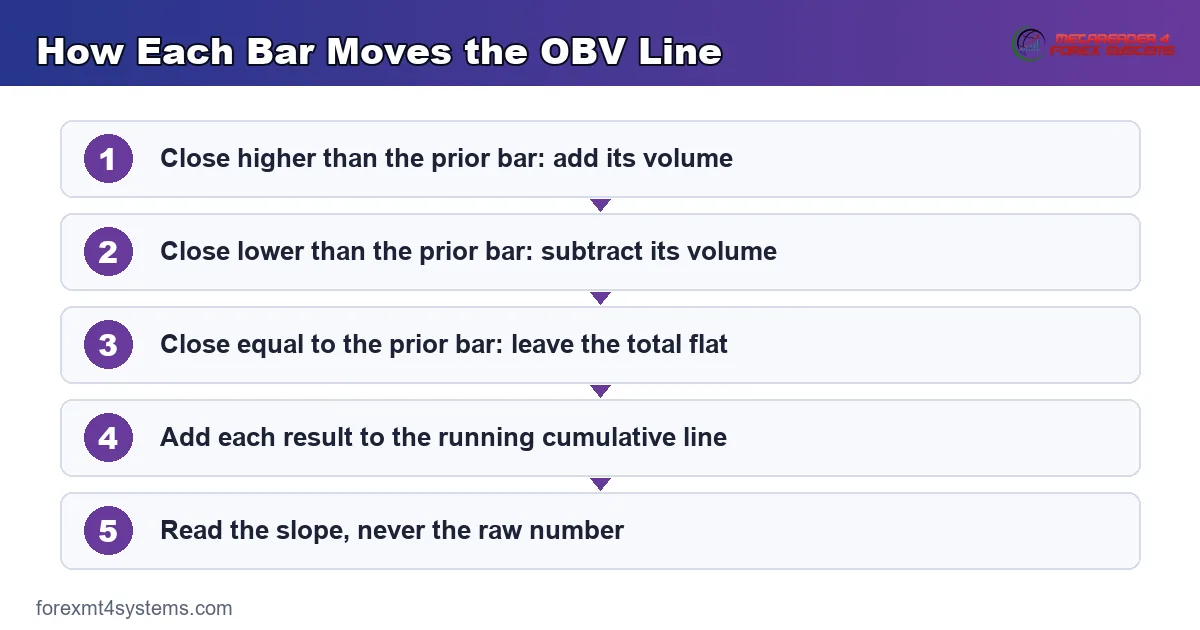
The logic is simple. When a bar closes higher than the one before, its volume is added to the total, because buyers were in control. When a bar closes lower, its volume is subtracted, because sellers led. So the line climbs on up days and slips on down days.
Granville built the tool around one belief, that volume precedes price. A rising OBV shows buying pressure gathering, which can lift price soon after. Meanwhile a falling OBV shows selling pressure building, which can weigh price down. So the line acts as an early read on the crowd behind a move.
One point saves a lot of confusion. The actual number on the OBV line means nothing on its own, because it depends on where the count started. So you never read the value itself. Instead, you read its direction and its slope, which is where all the useful information lives.
Look at a concrete case. The chart shows EURUSD on the daily timeframe near 1.14, with the On Balance Volume study plotted in a pane below price. As the pair grinds higher, the OBV line climbs alongside it, confirming that volume backs the move.
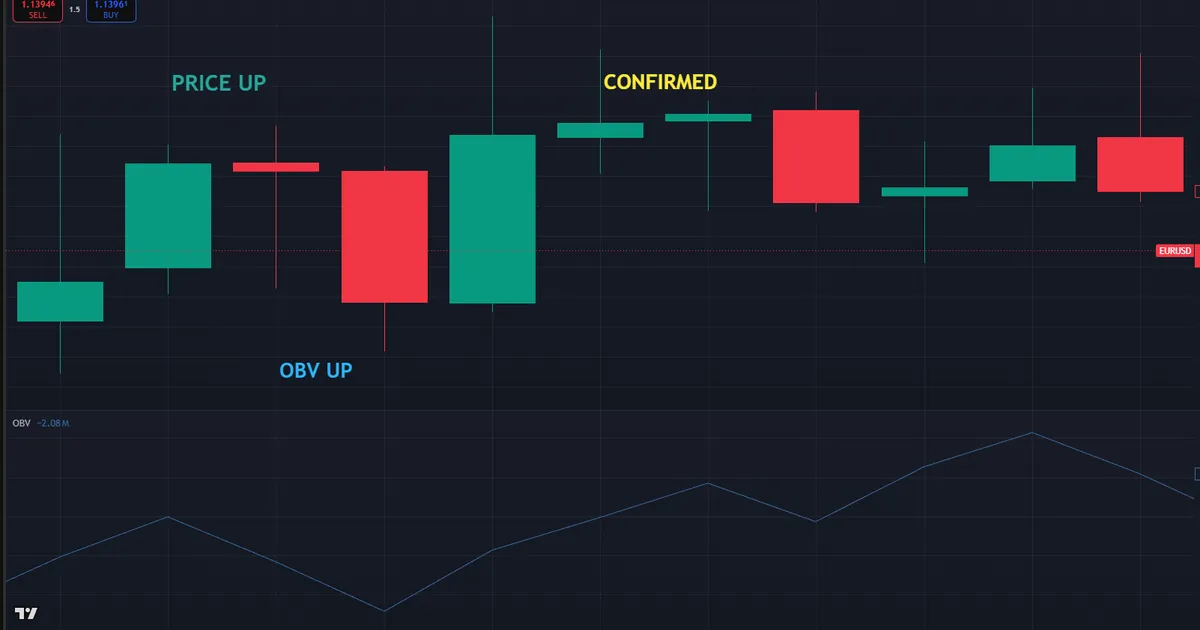
Now trace what that agreement means. Because price and OBV rise together, the buying is broad rather than thin, so the trend rests on real participation. If the line had drifted sideways instead, the same rally would look far more fragile. So the OBV read adds a layer of conviction that price alone cannot give.
OBV Versus Raw Volume Bars
Plain volume bars and OBV answer different questions. A volume histogram shows how much traded on each bar, yet it says nothing about direction on its own. So a tall bar could mark heavy buying or heavy selling, and you cannot tell which from the height alone.
OBV fixes that gap by folding direction into the count. Because it adds volume on up closes and subtracts it on down ones, the line reveals whether the heavy bars were mostly buying or mostly selling. So a single rising line does the work of scanning every volume bar by hand. That summary is exactly why many traders keep OBV on the chart instead of raw bars.
How On Balance Volume Is Built
The formula follows three fixed cases, and knowing them stops you from misreading the line. Each closing price decides how that bar’s volume changes the total.
- A higher close. When the close beats the prior close, the full volume of the bar is added to the running total. So an up day always lifts the line.
- A lower close. When the close sits below the prior close, the full volume of the bar is subtracted. So a down day always drops the line.
- An equal close. When the close matches the prior close exactly, the total stays flat. So a truly unchanged bar leaves the line where it was.
- The running total. Each result adds to or subtracts from the prior figure, so the line is cumulative and stretches back to wherever the count began.
- The slope. Because the raw number is arbitrary, only the rise or fall of the line carries meaning for a trader.
So the tool weighs direction by volume, one bar at a time. The concept graphic below walks through a few bars and shows how each close nudges the line up or down.
One caveat matters in forex especially. Spot currencies have no central exchange, so most platforms feed OBV with tick volume, which counts price changes rather than traded contracts. Tick volume tracks real volume closely on liquid pairs, yet it is a proxy, not the true figure. So read forex OBV as a strong estimate of activity rather than an exact contract count.
Why the Slope Is Everything
The direction of the line does all the work. A rising OBV says each up day carries more volume than the down days between, so buyers dominate. A falling OBV says the opposite, with sellers pushing harder on the down bars.
Think about steepness too. A sharply rising line shows pressure building fast, while a gently sloping one shows a slow, steady bid. Because the angle reflects how lopsided the volume is, a steep OBV move often marks a strong, committed trend rather than a hesitant one. So both the direction and the pitch of the line feed your read.
Compare the slope against price for a fuller picture. When price rises gently but OBV shoots up, volume is running ahead of price, which often precedes a stronger push. Meanwhile a price that climbs while OBV crawls hints the move lacks fuel. So the relationship between the two slopes, not either one alone, tells the richer story about who is really driving the market.
How the OBV Indicator Fits a Workflow
OBV earns its place as a confirmation tool, not a standalone signal. Most traders lay it beneath price and ask one question, whether volume agrees with the move they see.
Start with trend confirmation. When price makes a higher high and OBV makes a higher high too, the two agree and the uptrend looks well supported. So a rising line beneath a rising market is a green light to trust the trend. The volume indicators archive plots several tools that ask the same question in different ways.
Then watch for the warning, which is divergence. If price pushes to a new high while OBV fails to follow, the buying behind the move is fading even as price climbs. Because volume is thinning, that new high may not hold. Our guide to what is divergence in trading covers the pattern across many tools.
Now use OBV to gauge breakouts. A break of resistance on a sharp jump in the OBV line carries more weight than one on a flat line, since volume confirms real demand. Meanwhile a breakout with no lift in OBV often fails, because nobody committed to the move. So the line helps you separate a genuine break from a hollow one.
Reading OBV Divergence
Divergence is where OBV shines, so it deserves a closer look. A bearish divergence forms when price sets a higher high but OBV sets a lower high, hinting the rally is running on fumes. A bullish divergence forms when price sets a lower low but OBV sets a higher low, hinting selling is drying up.
Treat divergence as a warning, not a trigger. Because volume can lead price by many bars, an early entry on divergence alone often sits in a losing spot for a while. So wait for price to confirm with a break or a reversal pattern, then act. Our guides to how to trade divergence and hidden divergence work through the timing in detail.
Pairing OBV With Other Tools
OBV works best beside a tool that reads a different thing. Price and volume answer separate questions, so an OBV line pairs naturally with a trend or momentum read rather than another volume tool. That combination avoids stacking two views of the same data.
Keep the toolkit lean. A single trend filter plus OBV covers direction and participation without clutter, so you see confirmation at a glance. Because each tool has a clear job, the chart stays readable. The momentum indicators archive offers partners that time entries once OBV confirms the pressure behind a move.
Worked Example: OBV Confirming a EURUSD Trend
Picture EURUSD trending up on the daily chart, climbing from 1.11 toward 1.14 over several weeks. The move looks healthy on price alone, yet you want proof that volume backs it before committing. Many traders keep OBV on the chart for exactly this reason, using it as a quiet second opinion on every trend they weigh.
Now add the OBV line beneath price. As price carves higher highs, the OBV line carves higher highs right alongside, so buying pressure is rising with the market. Because the two agree, the trend rests on broad participation. The chart below marks that lockstep climb and the point where a pullback offers an entry.
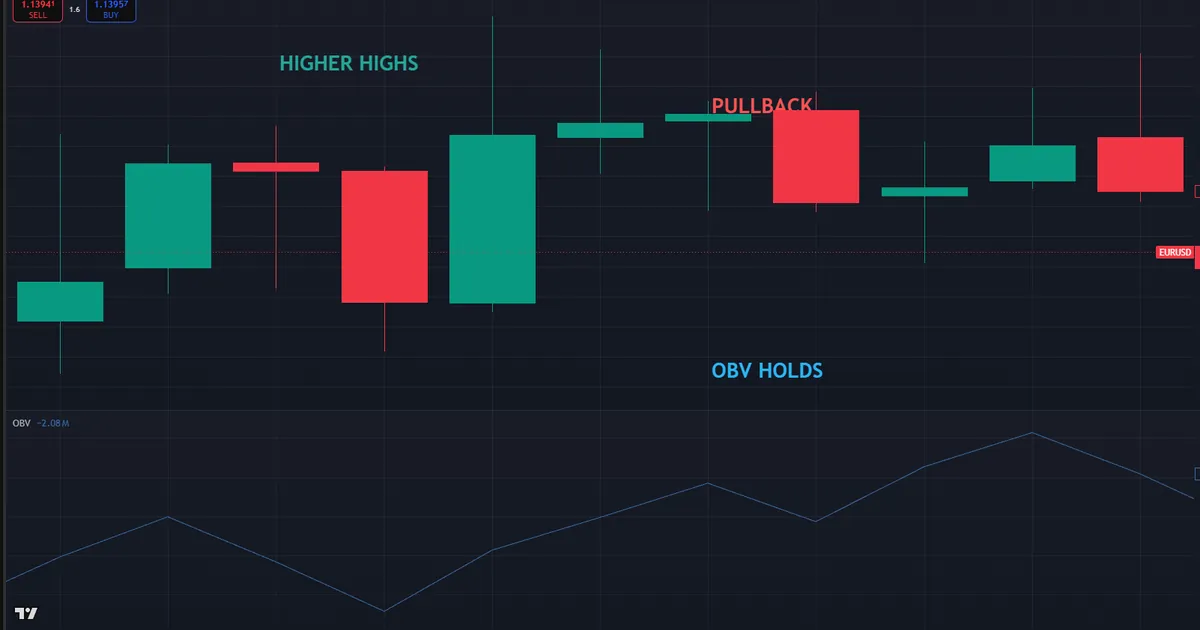
Then time the entry on a pullback that OBV supports. Price eases back toward 1.13 while the OBV line holds firm rather than collapsing, which says sellers never took real control. So the dip is a pause, not a reversal, and it offers a low-risk long. Our free trade journal helps you record how these OBV-backed entries actually perform for you.
Managing the Trade
Let the OBV line help guide the trade after entry. While price rises and the line rises with it, the trend stays healthy and the position runs. So the two moving up together is your signal to stay patient.
Watch for the line to stall, though. If price keeps climbing but OBV flattens or turns down, the buying is fading beneath the surface. Meanwhile a fresh divergence like that is an early hint to tighten a stop or trim size. So the line warns you before price itself rolls over.
Compare a trader who watched price alone. That trader would have ridden the same trend, yet missed the early warning that thinning volume gave. Because the OBV read flagged the fade first, this trader had time to protect gains. So the volume line, not the price action, delivered the crucial heads-up.
Reading the Confluence
Notice how the pieces agreed before the entry. Price held a clean uptrend, the OBV line rose in step, and the pullback never broke the volume read. Because several signals pointed the same way, the long rested on more than a single chart pattern.
So treat that agreement as the real edge here. Price alone can trap you, yet price backed by rising volume raises the odds the move continues. When the trend and the OBV line agree, the setup is worth taking. Meanwhile a rally that price loves but OBV ignores is the kind to treat with far more caution.
Download the complete indicator database
Put these concepts on your charts. One email unlocks the full library of 1,380+ indicators with compiled MT4 and MT5 files, plus my TradingView scripts. No paywall, no spam, unsubscribe any time.
Get free access to my indicator database
One email unlocks 1,380+ free MT4, MT5 and TradingView indicators — the complete library. No single-tool download; you get the whole database.
Common OBV Indicator Mistakes
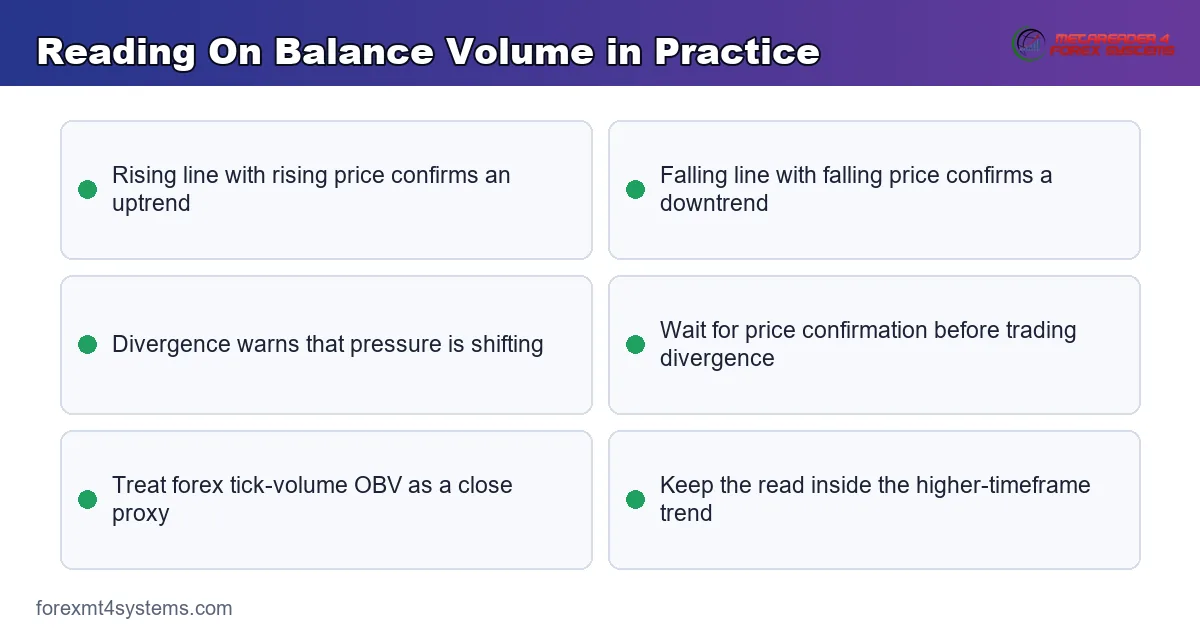
The tool is simple, yet the same errors repeat across every market. Most come from reading the line the wrong way or trusting it alone, and the fixes follow beneath the graphic.
Reading the Absolute Value
The classic slip is treating the OBV number as meaningful. Because the count starts at an arbitrary point, the figure itself says nothing. So ignore the value entirely, and read only the direction and slope of the line.
Trading Divergence Too Early
Divergence warns of a fading trend, yet it is not an instant signal. Volume can lead price for many bars, so an early entry often sits underwater first. Instead, wait for price to confirm with a break or a reversal pattern before you act on the divergence.
Ignoring the Tick-Volume Caveat
Forex OBV usually runs on tick volume, not true traded volume. Traders who forget this can over-trust the line on thin or illiquid pairs. So treat forex OBV as a close proxy, and lean on it hardest where liquidity is deep, such as the major pairs.
Using OBV Alone
OBV confirms a move, but it does not time entries on its own. Relying on the line by itself leads to vague, mistimed trades. So pair it with price structure or a momentum tool, and let OBV play its real role as a confirmation layer. A line that agrees with a signal you already trust is worth far more than a line asked to generate signals entirely on its own without any support.
Forgetting the Bigger Picture
A rising OBV inside a larger downtrend is still a counter-trend read. Focusing on the line while ignoring the dominant trend leads to fighting the flow. So place the OBV read inside the higher-timeframe context, and let the larger trend keep it honest. A rising line only earns full trust when the dominant trend already agrees with the direction you want to trade.
OBV Indicator Checklist
Run this short list before every entry that leans on the OBV line. A few seconds here saves hours of regret later. So keep it in view, tick each item honestly, and let a missing check talk you out of a marginal trade.
- OBV direction read from the slope, never from the raw value.
- Line agreeing with price for a confirmed trend.
- Any divergence noted and treated as a warning, not a trigger.
- Price confirmation, such as a break, present before acting on divergence.
- Tick-volume caveat respected, with heavier trust on liquid pairs.
- OBV paired with structure or a second tool, not used alone.
- Higher-timeframe trend checked so the read stays in context.
When On Balance Volume Fails
Study the failure case as hard as the winner. Here is a common one. A trader spots a bullish OBV divergence on XAUUSD near 4100, with price at a lower low while the line holds a higher low, and buys at once, certain the bottom is in.
Then the market keeps falling. Price ignores the divergence and grinds lower for days, and the early entry bleeds while the trader waits for a turn that comes far too late. The chart below shows that gap, with a hopeful OBV divergence sitting above a price that simply refused to cooperate.
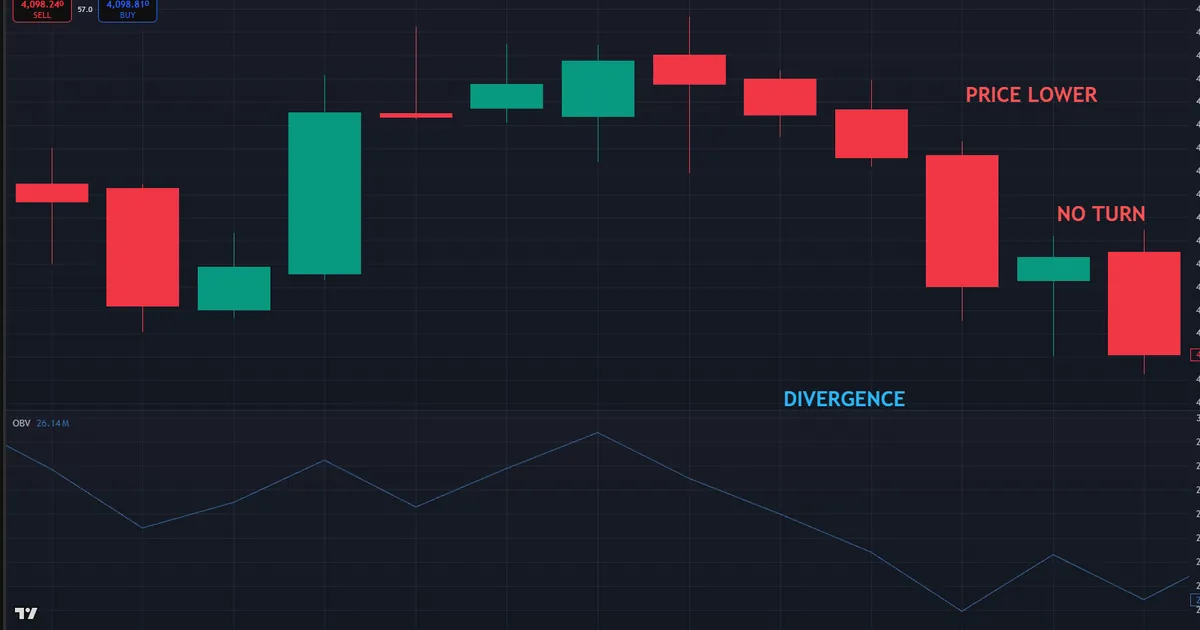
So what went wrong? Divergence is a warning that pressure is shifting, not a promise that price turns now. Volume can lead by many bars, and sometimes the shift never plays out at all. Hence the guard that saves an account, which is to demand price confirmation before acting. A divergence with no reversal behind it is a hint, and a hint is not an entry.
OBV Lags in Choppy Volume
Respect how noisy the line gets in a range. When price chops sideways, closes flip above and below the prior bar at random, so the OBV line jerks up and down with no clear slope. So in a rangebound market, the tool offers little edge, and a flat, jagged line is a signal to wait for a trend rather than force a read.
Keep a Trade Log
Be systematic about which OBV reads actually help you. Because your pairs and timing are unique, a written record beats memory every time. So note each OBV signal and its outcome in a journal, then let the data reveal whether confirmation or divergence serves you better over the months. A short monthly review keeps those rules current and honest rather than left to fading memory.
Related Concepts to Study Next
The OBV indicator connects to a web of volume and momentum tools, and a few ideas deserve your next reading hour. Divergence is the heart of the OBV read, so the general pattern of price and an indicator disagreeing is worth a careful study. The timing of those divergences also decides everything, which is where a dedicated trading routine earns its place beside the line. Both partners sharpen the read that a lone volume line gives you.
For broader context, our guide to RSI divergence explained shows the same disagreement through a momentum lens instead of a volume one. The related pattern in bullish vs bearish divergence sorts the signals by direction, which pairs neatly with the OBV read above. So master the OBV read first on your own, and then let any tool on the chart simply confirm the pressure you already see building.
FAQ
What is the OBV indicator?
On Balance Volume is a running total of volume that rises on higher closes and falls on lower closes. Joe Granville introduced it in 1963 to track buying and selling pressure. The line confirms trends and flags divergences, since it reflects the volume behind a price move rather than the price itself.
How is OBV calculated?
Each bar’s volume is added to the total on a higher close, subtracted on a lower close, and left unchanged on an equal close. The result is a cumulative line that stretches back to wherever the count started. Only its direction and slope matter, not the raw number.
What does OBV divergence mean?
Divergence occurs when price and OBV disagree. A higher price high with a lower OBV high warns that buying is fading, while a lower price low with a higher OBV low hints selling is drying up. It is a warning of a possible turn, not an instant entry signal.
Does OBV work in forex?
Yes, though forex OBV usually runs on tick volume rather than true traded volume, since spot currencies have no central exchange. Tick volume tracks real activity closely on liquid major pairs. So the tool works well there, but read it as a strong proxy rather than an exact count.
Should I read the OBV number itself?
No, the absolute OBV value is meaningless because the count begins at an arbitrary point. Two charts can show wildly different numbers for the same behavior. Read only the direction and steepness of the line, which is where all the useful information sits.
Can OBV predict reversals?
OBV can hint that pressure is shifting through divergence, but it does not predict the exact turn. Volume often leads price by many bars, and some divergences never resolve. So wait for price confirmation, pair it with other tools, and manage risk on every trade. Results are not guaranteed; past performance is not indicative of future results.
External references
- For background on this concept, see On-Balance Volume (OBV) at Corporate Finance Institute.
- For broader market context, see Joseph Granville on Wikipedia.

About the author
Written by Dominic Walsh, a Forex trader and MT4/MT5 indicator, Expert Advisor and script developer. Every tool on forexmt4systems.com is tested on live charts before release and ships with ready-to-use compiled MT4 (.ex4) and MT5 (.ex5) files. Learn more about the trader and developer behind this site.
How we build, test and correct every tool: Editorial & Testing Policy. Trading carries risk; see the disclaimer.