
Hidden divergence is the quiet cousin of the classic reversal signal, and it points the other way. Where regular divergence warns of a turn, hidden divergence flags a trend that is likely to keep going after a pause.
This guide unpacks hidden divergence from the ground up, using the RSI as the reading tool. So by the end, you will name the bullish and bearish forms, trade them with the trend, and place a stop that fits a continuation setup.
What Hidden Divergence Is
Hidden divergence is a mismatch between price and an oscillator during a pullback. The trend pauses, price makes a shallow counter-move, yet the oscillator overshoots in the other direction. So the momentum tool hints that the main trend still has fuel.
The key word is continuation. Regular divergence appears at the end of a trend and warns of a reversal. Hidden divergence appears inside a trend, on a pullback, and argues that the trend will resume. So the two look similar on the chart but carry opposite meanings.
There are two forms, one for each trend direction. Bullish hidden divergence shows up in an uptrend, when price holds a higher low but the RSI prints a lower low. Bearish hidden divergence shows up in a downtrend, when price makes a lower high but the RSI prints a higher high.
Look at a live case. The chart shows USDJPY on the four-hour timeframe in a clear uptrend, with a 14-period RSI below price. During a pullback, price forms a higher low near 162, yet the RSI dips to a lower low. So a hidden bullish divergence now sits inside the trend.
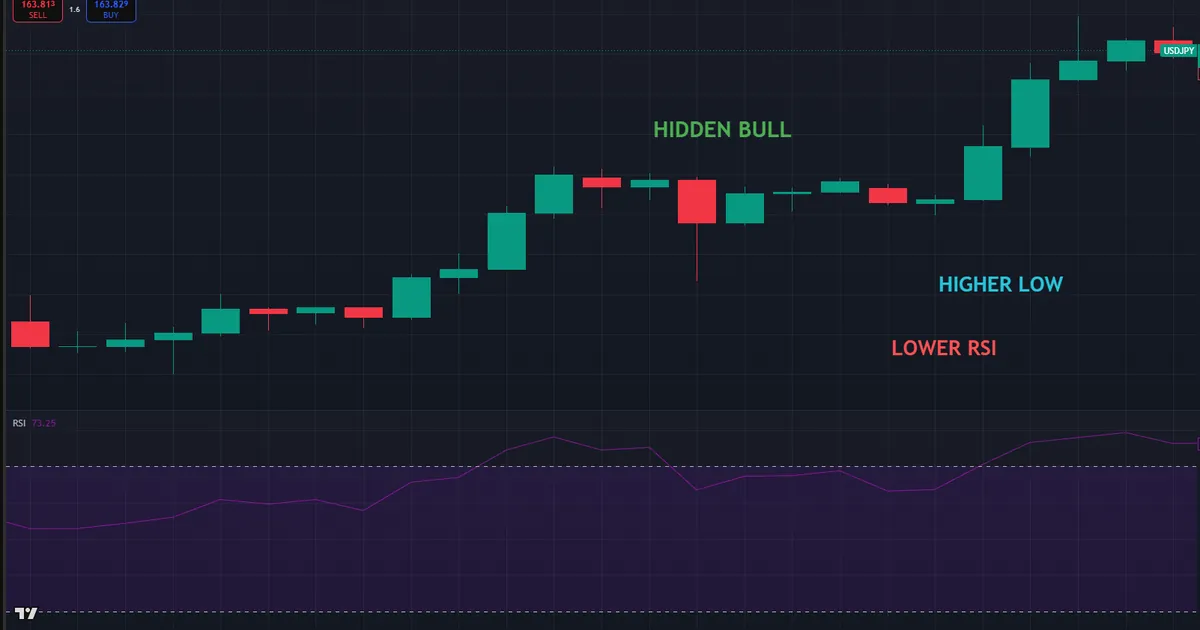
Now trace the two swings. Draw a line across the two price lows, then draw a line across the matching RSI lows. Because the price line rises while the RSI line falls, the two disagree. So the dip looks deeper in momentum than in price, which often precedes a fresh push higher. In a strong uptrend, that gap between a shallow price dip and a sharp momentum drop is exactly what you want to see before a continuation.
How Hidden Divergence Forms
The mechanics follow a simple sequence. So learn the steps once, then read any hidden signal at a glance.
- Name the trend. Confirm a clear uptrend or downtrend first, since hidden divergence only makes sense inside one.
- Wait for a pullback. Let price pause against the trend and form a counter-move swing.
- Mark the price swing. In an uptrend, note the higher low; in a downtrend, note the lower high.
- Mark the oscillator swing. Compare the matching RSI low or high against the price swing.
- Read the mismatch. When the oscillator overshoots the price swing, hidden divergence exists and favours continuation.
So hidden divergence is a picture of momentum running ahead of a shallow pullback. The concept graphic below sets it beside regular divergence, so the opposite logic stands out clearly.

One idea makes the whole pattern click. In a healthy trend, a pullback shakes out weak hands while the strong hands hold. Because the oscillator swings hard on that shakeout, its overshoot marks the fear, not a real change of direction. So the trend often resumes once the pullback ends.
Think about who is selling into an uptrend pullback. Short-term traders take profits, and nervous buyers bail out near the dip. Because that rush shows up as a sharp momentum drop, the RSI can undercut its last low even as price holds higher. So the deeper RSI swing reflects emotion, while the shallower price swing reflects the real trend.
Bearish Hidden Divergence in a Downtrend
The bearish form simply mirrors the bullish one. Price bounces to a lower high inside a downtrend, yet the RSI pushes to a higher high on that bounce. So momentum looks stronger than the weak price rally suggests.
Read it the same way, in reverse. The higher RSI high against a lower price high says the bounce is hollow. Because sellers still control the larger move, the downtrend often resumes after the pause. So a bearish hidden signal is a cue to look for shorts in the trend direction.
Why the RSI Suits Hidden Divergence
The RSI is a single line, so its swings are easy to compare against price. A lower RSI low or a higher RSI high jumps off the pane at a glance. So many traders reach for the RSI first when hunting hidden signals. A period of 14 keeps the swings readable without drowning them in noise.
Still, the tool only measures momentum. It never names the trend on its own, and it cannot force a continuation. So pair the RSI with a clear trend read, then treat the hidden signal as one clue among several.
Trading Hidden Divergence in a Workflow
Hidden divergence shines as a pullback-entry tool inside a trend. So build it into a plan that starts with the trend and ends with a managed exit.
Begin with the trend read. A moving average or a simple structure check tells you which way the market leans. Because hidden divergence only works with the trend, that first step decides whether you hunt longs or shorts. Our guide to the oscillator indicators archive shows the tools that plot these swings.
Then wait for the pullback and the signal together. The trend must pause, and the RSI must overshoot the shallow price swing. So both pieces have to line up before a hidden setup even exists. A tidy trend with a clean pullback gives the best reads.
Resist the urge to force the pattern. On a quiet day, no clean hidden signal may appear at all, and that is fine. Because a forced trade in the wrong conditions costs more than a missed one, patience pays here. So let the market come to you, then act only when the trend and the pullback both cooperate.
Settings and Timeframes
Start with the standard 14-period RSI, since it suits most charts. I would keep that default until you have a clear reason to change it. A shorter length reacts faster but fires more noise, while a longer one smooths the swings.
Higher timeframes give stronger hidden signals. A pullback on the four-hour or daily chart reflects a bigger crowd than one on the one-minute chart. Because larger swings carry more weight, their hidden divergences resume trends more reliably. So treat a daily hidden signal with real respect.
Pairing Hidden Divergence With Structure
Structure turns a good signal into a strong one. A bullish hidden divergence that forms on old support ranks far above one in open space. So blend the momentum read with prior divergence techniques and key levels.
Direction matters most of all. A hidden signal that agrees with the higher-timeframe trend earns your trust, while one that fights it does not. So compare hidden and regular signals through a study of bullish versus bearish divergence, then act only with the dominant trend.
Grading a Hidden Divergence Setup
Not every hidden signal deserves a trade. So grade each one before you risk money, and let the weak setups drift past untouched.
Start with trend quality. A strong, orderly trend gives hidden divergence the backdrop it needs, while a weak, choppy one does not. Because continuation depends on a living trend, a clean move ranks far above a ragged one. So judge the trend before you even glance at the RSI.
Then weigh the pullback. A shallow, controlled pullback fits the continuation story, since it looks like profit-taking rather than a real reversal. Because a deep, violent pullback hints at a genuine shift, it lowers the grade. So a tidy dip earns more trust than a sharp collapse.
Strong Setups Versus Weak Ones
A strong hidden setup stacks several clues at once. It sits inside a clean trend, forms on old support or resistance, and comes with a confirming candle. So structure, momentum, and price action all agree on the same continuation.
A weak hidden setup leans on the mismatch alone. It appears in choppy price, sits far from any level, and lacks a confirming candle. Because nothing supports it, that signal fails more often. So treat a lone hidden mismatch as a note to watch, not a reason to trade.
Adding a Location Filter
Location sharpens the read further. A bullish hidden divergence that forms right on a prior support shelf carries real weight. Because price already has a reason to hold there, the momentum overshoot gains support from structure. So favour hidden signals that land on levels you already respect.
Round numbers help in the same way. A pullback that stalls near a big figure, then prints a hidden signal, blends two reasons to hold. So stack a level under the signal whenever you can, then let the confluence lift your confidence and your size. When no level sits nearby, trim the size and treat the read with a little more caution.
Worked Example: USDJPY Continuation Long
Picture USDJPY trending up on the four-hour chart above 162. The trend is clean, then price eases into a pullback. Its low sits higher than the last swing low, yet the RSI dips to a lower low on that dip.
Now wait for the chart to agree. Price holds the higher low, then prints a bullish candle with a firm close. So the hidden bullish divergence gains support from real price action. The chart below marks the continuation entry and the stop.
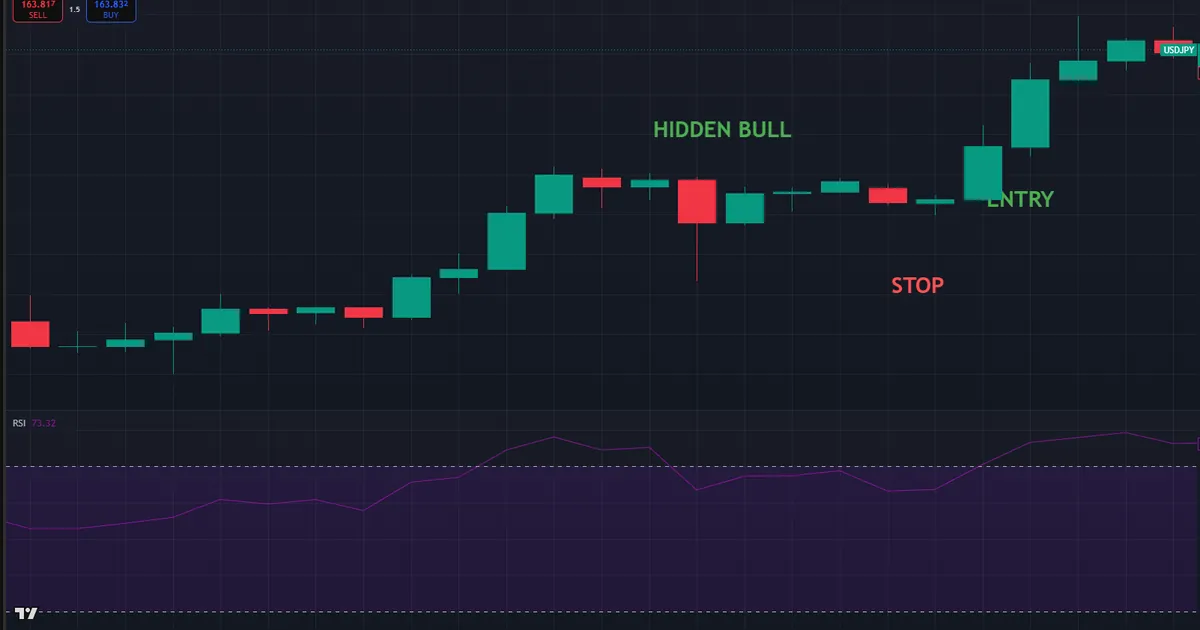
Then set the risk with care. The entry sits just above the confirming candle, and the stop tucks below the pullback low near 161.5. Because a break of that higher low would kill the continuation case, that spot is the honest place for a stop. A close below the pullback low, not just a wick, would confirm the setup has failed. Our free position size calculator turns the stop distance into a size in seconds.
The follow-through rewarded the read. Price resumed the uptrend, cleared the prior swing high, and pushed toward the next resistance. So the hidden signal caught a pullback entry inside a move that was far from over. That is the whole appeal of trading continuation rather than reversal.
Contrast a reversal read on the same chart. A trader who saw the lower RSI low and shorted, expecting a top, would have fought the trend head-on. Because that read ignored the higher price low, it inverted the real message. The higher low was the whole tell, and skipping it flipped a buy into a doomed sell. So naming the pattern correctly was the difference between a clean trade and a painful one.
Managing the USDJPY Trade
Handle the trade in stages once it moves. As price clears the old swing high, lift the stop toward breakeven so the position can no longer hurt. Because the trend has resumed, that shift protects the account while the move runs.
Then let the trend guide the exit. A continuation trade rides the existing move, so the next major resistance makes a sensible target. Because the reward beat the risk from the start, the trade fit a clear plan. So one hidden signal timed the entry, set the stop, and framed the exit in a single read.
Download the complete indicator database
Put these concepts on your charts. One email unlocks the full library of 1,380+ indicators with compiled MT4 and MT5 files, plus my TradingView scripts. No paywall, no spam, unsubscribe any time.
Get free access to my indicator database
One email unlocks 1,380+ free MT4, MT5 and TradingView indicators — the complete library. No single-tool download; you get the whole database.
Common Mistakes and How to Fix Them
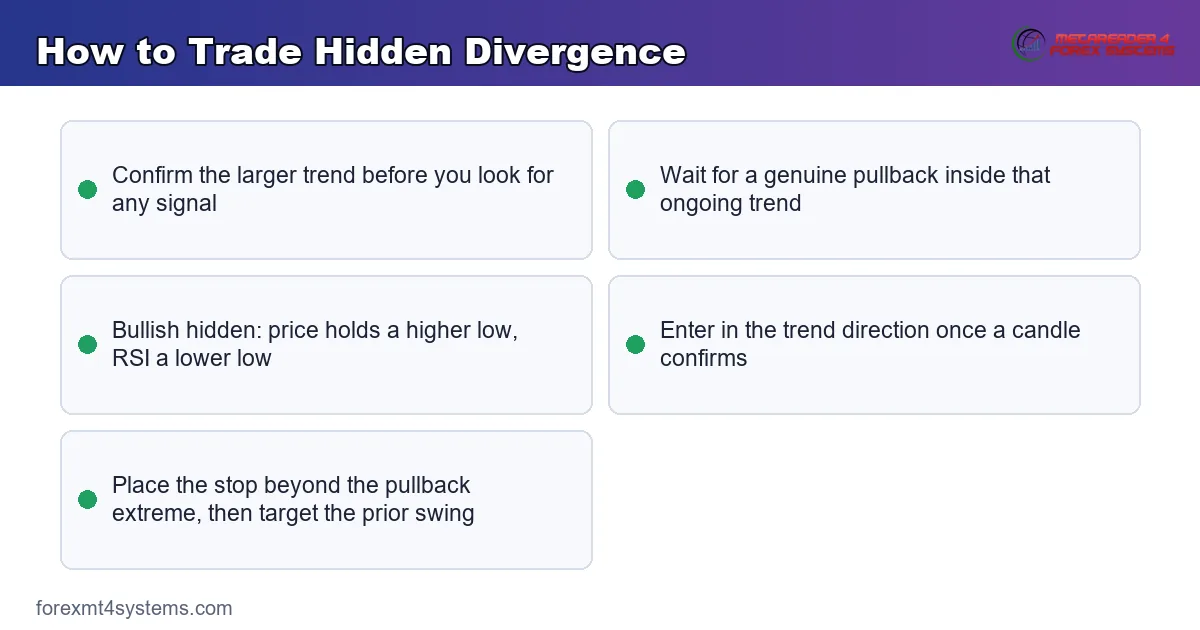
Hidden divergence trips traders who confuse it with the regular kind. Most errors trace back to mixing up the swings or the direction, and the fixes follow beneath the graphic. So read each one, then check your own habits against it honestly.
Confusing Hidden With Regular Divergence
The two patterns share tools but carry opposite meanings. Trading a hidden signal as a reversal points you the wrong way. So name the type first: hidden means continuation, regular means reversal, and the price swing tells them apart.
Trading Hidden Divergence Against the Trend
Hidden divergence only works with the trend, never against it. A trader who fades the move misses the whole point of the signal. So confirm the trend direction first, then take hidden longs only in uptrends and hidden shorts only in downtrends.
Skipping the Confirmation Candle
A raw mismatch can sit for many bars before price resumes. Acting on it alone puts you in front of a pullback that may run deeper. Instead, wait for a candle or a small structure break to confirm the trend is resuming.
Misreading the Swing Points
Hidden signals hang off the pullback swings, not the trend extremes. Comparing the wrong points gives a false read. So mark the pullback low or high with care, then compare only those swings against the RSI.
Placing the Stop Too Tight
A stop a pip beyond the pullback swing gets tagged by normal noise. Continuation moves rarely start in a perfectly clean line. So give the stop room past the pullback extreme, so an ordinary wiggle cannot end the trade before the trend resumes.
Pre-Trade Hidden Divergence Checklist
Run this short list before every hidden divergence trade. A few seconds here saves a mistimed entry later. So keep it in view, and let a missing check talk you out of a marginal setup.
- A clear trend confirmed on the higher timeframe.
- A genuine pullback against that trend in progress.
- The correct swing marked: higher low in an uptrend, lower high in a downtrend.
- An RSI that overshoots the shallow price swing.
- A confirmation candle showing the trend resuming.
- A stop set beyond the pullback extreme.
- A target at the prior swing or the next key level.
When Hidden Divergence Fails
Study the failure as hard as the winner. Here is a common one. A trader spots a clean hidden bullish divergence on EURUSD near 1.14 and buys, sure the uptrend will resume. The RSI has clearly made a lower low against a higher price low.
Then the trend rolls over instead. Price breaks the higher low, slides through support, and the uptrend gives way to a new decline. The chart below shows the hidden signal that failed, with price breaking the swing that defined it.

So what went wrong? Hidden divergence assumes the trend continues, yet no trend lasts forever. When price breaks the pullback swing, the continuation case is gone, and the trend may be turning. Hence the stop below the higher low, which closed the trade before the deeper drop did real harm.
Notice the warning that came before the break. The pullback ran deeper than a normal dip, and price barely held its higher low. Because the counter-move looked more like a reversal than profit-taking, the setup was weaker than it seemed. So a careful grade would have trimmed the size or skipped the trade before the break ever arrived.
Hidden Signals Need a Living Trend
Notice where the tool depends on context. Hidden divergence only helps while a trend is genuinely intact. In a choppy, trendless market, the same mismatch fires again and again with no follow-through. So skip hidden signals when no clear trend exists, and hunt them only inside strong, orderly moves. A quick trend check before every setup keeps you out of the chop where these signals mislead.
The Break Level Defines the Idea
Be honest about what invalidates the setup. The pullback swing is the line in the sand for a hidden trade. Because a break of that swing removes the whole premise, the stop belongs just beyond it. So define the failure level before you enter, then let price prove the continuation right or wrong.
Related Concepts to Study Next
Hidden divergence sits inside a wider family of momentum ideas, and a few deserve your next reading hour. The reversal version uses the same tools with opposite logic, so a firm grasp of what divergence is keeps the two straight in your mind. The full entry routine also matters, which the pairing section above ties back to a practical trading plan.
For hands-free charting, the momentum indicators archive plots the RSI and its cousins automatically, so the swings appear without any manual drawing. Tools speed the scan, yet the logic above still carries the trade. So master the pullback read first, then let any indicator on the chart simply plot the momentum you already know exactly how to judge and trade with the trend behind you.
FAQ
What is hidden divergence in simple terms?
Hidden divergence is a momentum signal that points to trend continuation. It forms on a pullback, when price makes a shallow counter-swing but the oscillator overshoots. So it argues that the main trend still has strength and is likely to resume.
What is the difference between hidden and regular divergence?
Regular divergence warns of a reversal at the end of a trend. Hidden divergence signals continuation on a pullback inside a trend. They use the same tools but carry opposite meanings, so the price swing is what tells them apart.
How do you trade hidden bullish divergence?
Confirm an uptrend, then wait for a pullback where price holds a higher low but the RSI makes a lower low. Enter long once a candle confirms the trend resuming. Place the stop below the pullback low and target the prior swing.
Which indicator is best for hidden divergence?
The RSI is a popular choice because its single line makes the swings easy to compare. The MACD also works and adds a histogram view. Pick one oscillator, learn it well, and pair it with a clear trend read.
Is hidden divergence reliable?
Hidden divergence works best inside a strong, orderly trend and struggles in choppy markets. It is a useful continuation clue, not a certainty. Always add a confirmation candle and a stop before you treat the signal as tradable.
Where do you place a stop on a hidden divergence trade?
Place the stop just beyond the pullback swing that defined the signal. A break of the higher low, or the lower high, means the continuation case has failed. Keep the stop first and the size small. Results are not guaranteed; past performance is not indicative of future results.
External references
- For background on this concept, see Momentum at BabyPips.
- For broader market context, see Rate of Change (ROC) at Corporate Finance Institute.

About the author
Written by Dominic Walsh, a Forex trader and MT4/MT5 indicator, Expert Advisor and script developer. Every tool on forexmt4systems.com is tested on live charts before release and ships with ready-to-use compiled MT4 (.ex4) and MT5 (.ex5) files. Learn more about the trader and developer behind this site.
How we build, test and correct every tool: Editorial & Testing Policy. Trading carries risk; see the disclaimer.