
Knowing how to trade divergence gives you an early read on a tiring trend. Divergence appears when price and a momentum indicator disagree, so the tool hints at a turn before the candles make it obvious.
This guide shows how to trade divergence with the RSI and the MACD, step by step. So by the end, you will spot the signal, wait for the right confirmation, and place a stop that respects the risk.
How to Trade Divergence Step by Step
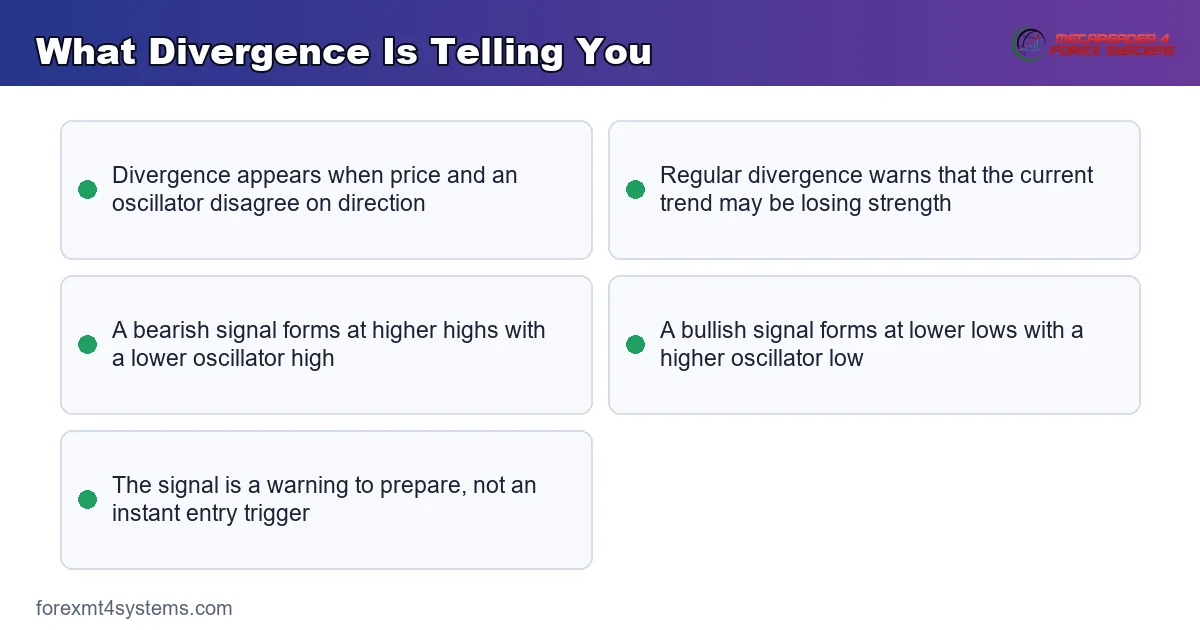
Divergence is a mismatch between price and an oscillator. Price pushes to a new extreme, yet the indicator refuses to follow. So the momentum behind the move is fading, even while price still looks strong.
There are two regular types, and they mirror each other. A bearish divergence forms at a top, where price makes a higher high but the oscillator makes a lower high. A bullish divergence forms at a bottom, where price makes a lower low but the oscillator makes a higher low.
Regular divergence is a reversal warning. It says the current trend is running low on fuel, so a pause or a turn may be near. Still, a warning is not a trigger, and the signal alone never justifies a trade.
Look at a live case. The chart shows EURUSD on the four-hour timeframe with a 14-period RSI below price. Price prints a higher high near 1.148, yet the RSI prints a clearly lower high. So a regular bearish divergence now hangs over the top.
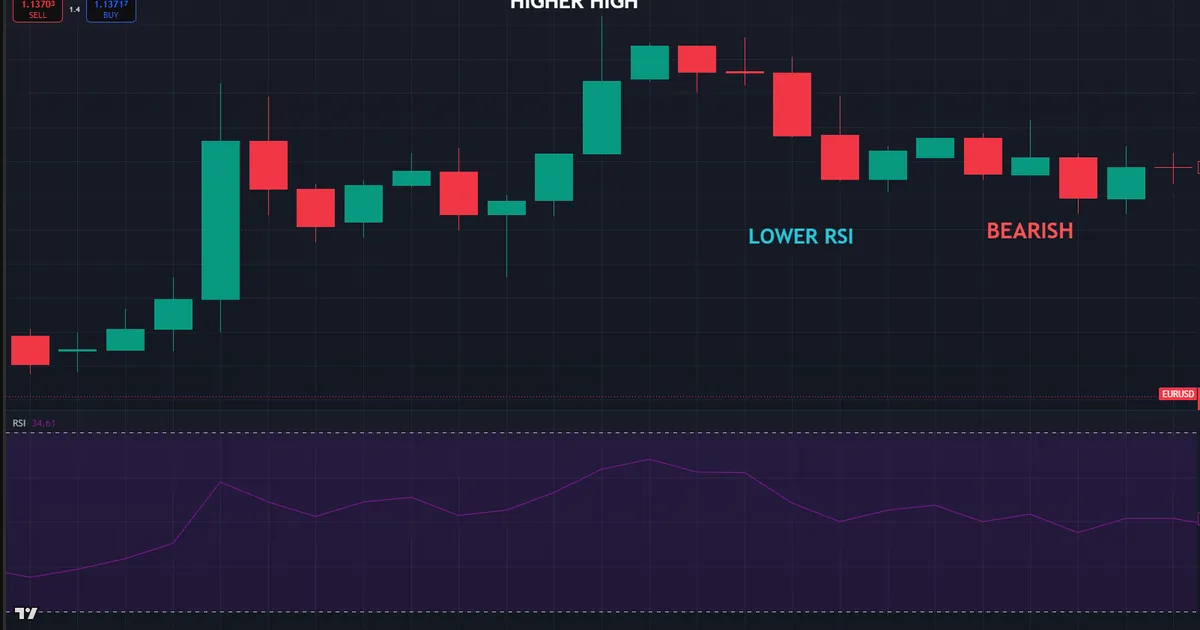
Now trace the two swings that matter. Draw a line across the two price highs, then draw a line across the matching RSI highs. Because the price line rises while the RSI line falls, the two disagree. So the buyers who drove the rally are quietly losing their grip.
How Divergence Forms on the Chart
The mechanics are simple once you break them into steps. So learn the sequence, then read any divergence at a glance.
- Find two swings. Locate two clear highs for a top, or two clear lows for a bottom, on the price chart.
- Mark the price line. Connect the two price extremes so the direction of the swing is obvious.
- Mark the oscillator line. Connect the matching peaks or troughs on the RSI or MACD below.
- Compare the slopes. When the two lines point in opposite directions, a regular divergence exists.
- Wait for confirmation. Let a candle or a structure break agree before you treat the signal as tradable.
So divergence is just a picture of momentum falling out of step with price. The concept graphic below contrasts a bearish signal at a high with a bullish one at a low.
One detail keeps you honest. The two swings must be genuine peaks or troughs, not tiny bumps. Because a weak swing gives a weak signal, only clear turning points carry any real weight.
Count the swings you compare as well. Classic divergence uses two peaks or two troughs, side by side. Because extra swings blur the read, keep the comparison to the two clearest points and ignore the noise between them.
Reading the Oscillator Behind the Signal
Both the RSI and the MACD work well for divergence, and each reads slightly differently. The RSI is a single line, so its lower high or higher low is easy to see at a glance. So many traders start with the RSI for its clarity.
The MACD adds its histogram and signal line. A shrinking histogram into a new price high shows the same loss of momentum in a different form. Because the MACD tracks the gap between two moving averages, it often catches broader shifts than the RSI does.
Pick one tool and learn it well rather than juggling five. A trader who reads the RSI fluently spots divergence faster than one who hops between indicators. So build fluency in a single oscillator first, then add a second only once the first feels natural.
Regular Bullish Divergence at a Bottom
The bullish case simply mirrors the bearish one. Price drives to a lower low, yet the oscillator carves a higher low. So sellers are pushing price down while their momentum quietly drains away.
Read it the same way, in reverse. Draw a line across the two price lows and another across the matching oscillator lows. Because the price line falls while the oscillator line rises, the two disagree. So a bounce may be near, once a confirming candle or a broken minor high agrees. Because the logic simply flips, one skill covers both the tops and the bottoms you will trade.
Choosing Settings and Timeframes
Start with the standard settings, since they suit most charts. The 14-period RSI and the 12, 26, 9 MACD are the common defaults, and I would keep them until you have a reason to change.
Higher timeframes give stronger divergence. A signal on the four-hour or daily chart carries more weight than one on the one-minute chart. Because larger swings reflect bigger crowds, their divergences turn price more reliably. So treat a daily divergence with real respect.
Match the tool to your style as well. A swing trader might hunt divergence on the daily and enter on the four-hour. A day trader might scan the one-hour and drop to the fifteen-minute for timing. So the higher chart finds the signal while the lower chart times the entry.
Keep the two charts in agreement. A divergence on the four-hour means more when the daily trend is already stalling near a level. Because the higher frame sets the tide, a signal that fights it faces long odds. So let the big chart pick the direction, then trust the smaller one only for the exact entry.
Pairing Divergence With Trend and Structure
Divergence works best inside a plan, not alone. A trend read tells you whether you are fading a stretched move or catching a healthy pullback. Our guide to the oscillator indicators archive shows the tools that plot these signals for you.
Structure adds the map. A bearish divergence into old resistance is far stronger than one in open space. So blend the momentum read with prior divergence basics and key levels, then act only where several clues agree.
Grading a Divergence Setup
Not every divergence deserves a trade. So grade each one before you risk money, and let the weak signals pass by untouched.
Start with the location. A divergence at a major level, such as old resistance or a round number, ranks far above one in the middle of a move. Because price already has a reason to pause there, the momentum read gains support from structure. So location is the first filter that lifts a signal.
Then judge the swings. Two sharp, well-spaced peaks give a cleaner signal than two shallow bumps close together. Because clear swings reflect real crowd behaviour, they turn price more reliably. So a tidy pattern beats a cramped one every time. When the swings look messy, it is usually wiser to skip the trade and wait for a cleaner one.
Strong Signals Versus Weak Ones
A strong divergence stacks several clues at once. It sits at a key level, shows two obvious swings, and comes with a confirming candle. So the case leans on structure, momentum, and price action together.
A weak divergence stands alone in open space. It hangs off minor wiggles, sits far from any level, and lacks a confirming candle. Because nothing supports it, that signal fails far more often. So treat a lone mismatch as a note to watch, not a reason to trade.
Adding Momentum Confirmation
Momentum tools can confirm each other. When the RSI and the MACD both show a divergence at the same swings, the message grows louder. Because two independent readings agree, the fading move looks more real. So a double signal earns more trust than a single line ever could.
Still, more tools cannot replace price. A confirmation candle or a broken minor level remains the trigger, whatever the oscillators say. So let momentum grade the setup, then let price itself fire the entry.
Worked Example: Shorting a EURUSD Top
Picture EURUSD grinding higher on the four-hour chart toward 1.148. The rally looks strong, yet the RSI is quietly slipping. Its second peak sits well below its first, so a bearish divergence is now in place.
Now wait for the chart to agree. Price stalls, then prints a bearish reversal candle with a long upper wick. At the same time, the MACD histogram shrinks and the MACD line rolls under its signal. So momentum and candles both confirm the fading top. The chart below marks the entry and the stop.
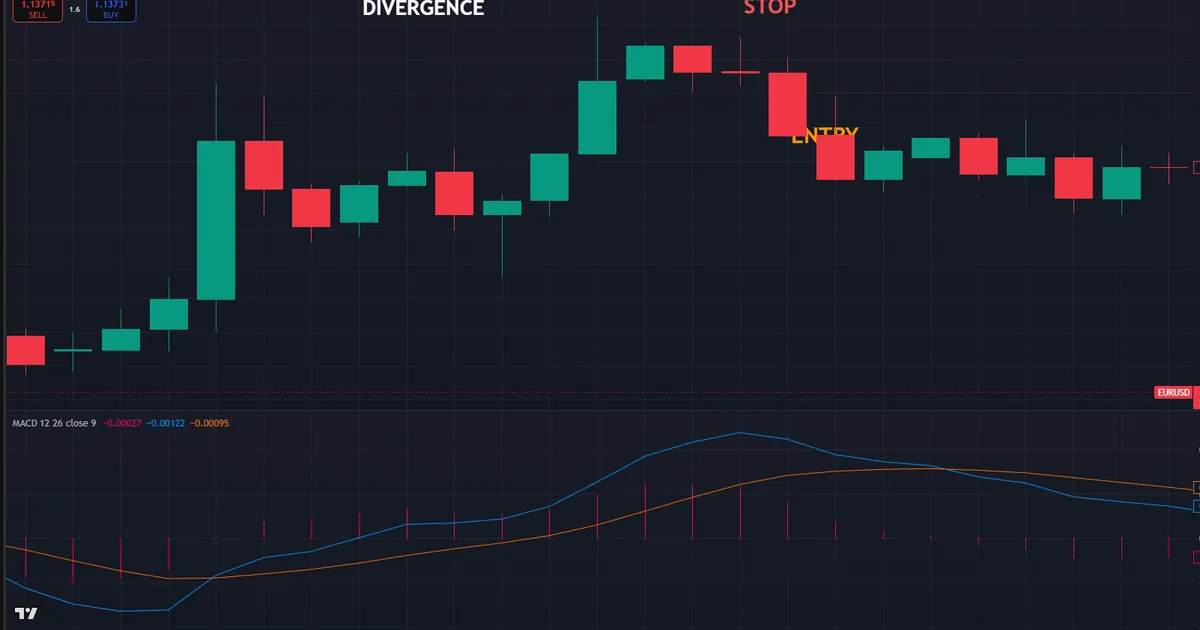
Then set the risk with care. The entry sits just below the reversal candle, and the stop tucks above the swing high near 1.150. Because a new high would erase the divergence, that spot is the honest place for a stop. A close back above the high, not just a wick, would tell you the setup has clearly failed. Our free position size calculator turns that stop distance into a size in seconds.
Weigh the whole setup before the click. The signal sat at a prior resistance shelf, both oscillators agreed, and a clean candle fired the trigger. Because so many clues lined up, this ranked as a strong grade rather than a lonely guess. So the trade earned a normal size instead of a cautious, trimmed one.
The follow-through rewarded the patience. Price rolled over from the divergence, broke the last minor low, and slid toward prior support. So the confirmed entry caught the turn while the tight stop capped the risk. That mix of an early read and a late trigger is the heart of trading divergence.
Why the Confirmation Step Matters
Notice what the confirmation did for the trade. The divergence alone had appeared a full day earlier, while price still crept higher. A trader who shorted that first signal would have sweated through more upside. So the wait for a candle and a MACD roll kept the entry cleaner and the stop closer.
Managing the EURUSD Short
Handle the trade in stages once it moves your way. As price breaks the first minor low, lower the stop toward breakeven so the position can no longer hurt. Because the turn has proven itself, that shift protects the account while the trend develops.
Then let the target guide the exit. Prior support sat well below the entry, so that shelf became the logical goal. Because the reward clearly beat the risk, the trade fit a sensible plan from the first click. So one confirmed signal timed the entry, set the stop, and framed the exit in a single read.
Download the complete indicator database
Put these concepts on your charts. One email unlocks the full library of 1,380+ indicators with compiled MT4 and MT5 files, plus my TradingView scripts. No paywall, no spam, unsubscribe any time.
Get free access to my indicator database
One email unlocks 1,380+ free MT4, MT5 and TradingView indicators — the complete library. No single-tool download; you get the whole database.
Common Mistakes and How to Fix Them
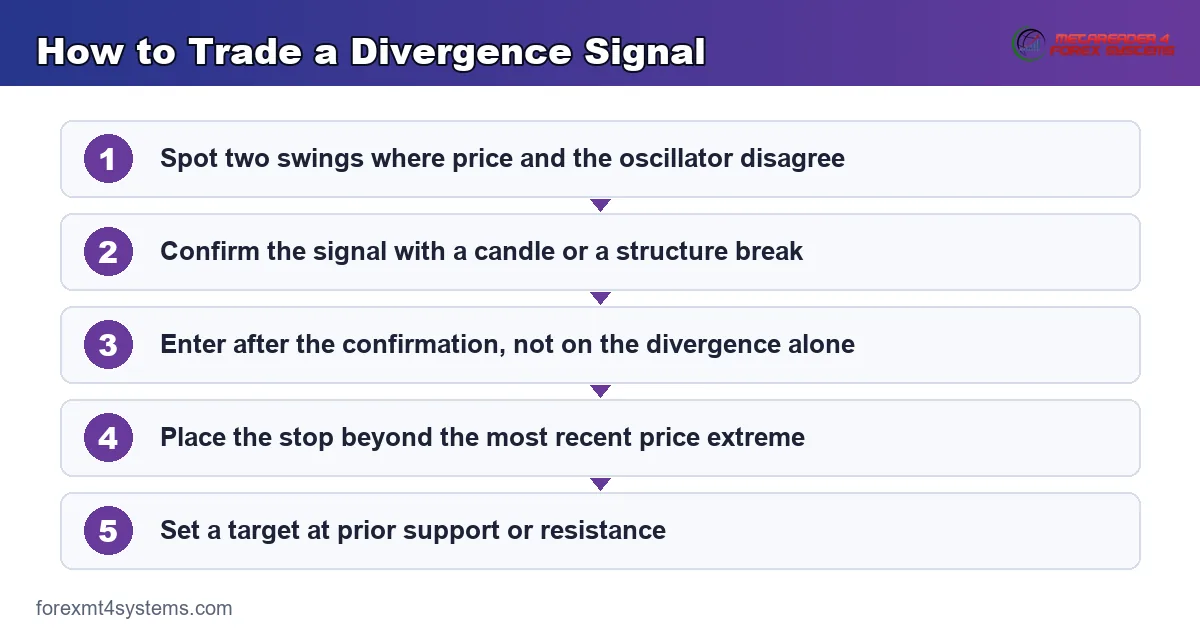
Divergence tempts traders into early, lonely entries. Most errors trace back to treating a warning as a trigger, and the fixes follow beneath the graphic. So read each mistake, then check your own habits against it.
These slips share a root cause. Each one skips a step of the plan, whether confirmation, context, or risk. Because the pattern feels so convincing on the chart, traders rush past the checks that keep them safe. So slow down at the exact moment the signal excites you most.
Trading the Signal With No Confirmation
A divergence can persist for many bars while price keeps trending. Acting on the mismatch alone puts you in front of a live move. Instead, wait for a candle, a small structure break, or a momentum cross before you enter.
Fading a Very Strong Trend
A powerful trend can print divergence again and again without turning. Traders who short every lower RSI high in a rocket move get run over. So respect the larger trend, and take counter-trend divergence only at major levels.
Forcing a Signal From Weak Swings
Two tiny bumps do not make a real divergence. A signal built on noise gives a noisy result. So demand two clear peaks or troughs, then ignore the mismatches that hang off minor wiggles.
Placing the Stop Too Tight
A stop a pip beyond the swing gets tagged by normal noise. Momentum turns are rarely instant or clean. So give the stop room past the recent extreme, so an ordinary retest cannot end the trade before the idea plays out.
Ignoring the Higher Timeframe
A one-minute divergence means little against a daily uptrend. Small signals bow to bigger ones. So check the higher chart first, then trade divergences that agree with the dominant direction.
Pre-Trade Divergence Checklist
Run this short list before every divergence trade. A few seconds here saves a rushed entry later. So keep it in view, and let a missing check talk you out of a marginal setup.
- Two clear price swings with a matching oscillator mismatch.
- The signal read on a timeframe that suits your style.
- The higher-timeframe trend checked for context.
- A confirmation candle or momentum cross in place.
- A key support or resistance level near the signal.
- A stop set beyond the most recent price extreme.
- A reward that clearly beats the risk on the trade.
When Divergence Fails
Study the failure as hard as the winner. Here is a common one. A trader spots a clean bearish divergence on GBPUSD near 1.34 and shorts at once, sure the top is in. The RSI has clearly made a lower high.
Then the trend ignores it. Price barely dips, then pushes to a fresh high and keeps climbing. The chart below shows the divergence that never reversed, with price trending straight over the warning.
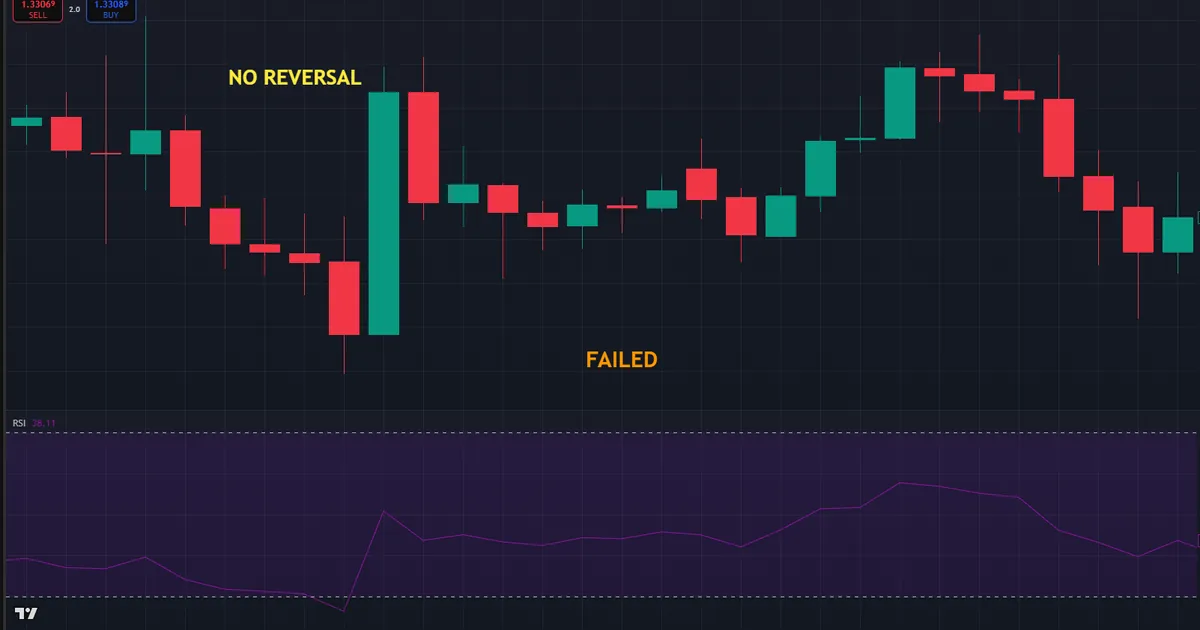
So what went wrong? Divergence measures fading momentum, not a certain turn. In a strong trend, momentum can cool and then reload without any reversal. Hence the rule that saves the account: wait for confirmation and honour the stop, so a failed signal stays a small loss rather than a stubborn one.
Divergence in Trends Versus Ranges
Notice where the tool shines and where it struggles. In a range, divergence at the edges often marks clean turns, since price is already rotating. In a strong trend, the same signal fails more often, because the trend simply overpowers the wobble. So weight your divergence trades toward ranges and major levels, not the middle of a runaway move.
The Cost of a Missing Stop
Be honest about the real danger here. The signal did not ruin the trader; a missing stop would have. Because divergence can fail while price runs far, an unprotected short can bleed badly. So size every divergence trade small and set the stop first, then let the market prove the idea right or wrong.
Waiting for the Trend to Crack
Patience separates the two outcomes here. In a strong trend, the safest divergence trades come after price also breaks a real level or structure. Because the break shows the trend itself is cracking, the momentum warning finally has support. So a trader who waits for that crack takes far fewer doomed shorts.
Think of divergence as an alarm, not an order. The alarm tells you to watch closely and prepare a plan. Because the turn still needs price to confirm, acting early simply front-runs a move that may never come. So let the warning sharpen your focus, then trade only what price agrees to give.
Related Concepts to Study Next
Divergence connects to a family of momentum ideas, and a few deserve your next reading hour. The same mismatch also appears as a continuation clue, which flips the logic entirely, so a look at hidden divergence rounds out the picture. The RSI version has its own quirks and grades, which our guide to RSI divergence breaks down in detail.
A grounding in the basics helps too. Before you trade the pattern, a firm grasp of what divergence is keeps the entries disciplined. So return to the fundamentals whenever a run of losses tempts you to force signals that are not really there.
For hands-free charting, the momentum indicators archive plots the RSI, the MACD, and their cousins automatically. Tools speed the scan, yet the logic above still carries the trade. So master the two-swing read first, then let any indicator on the chart simply plot the momentum you already know exactly how to judge and act on with a plan.
FAQ
How do you trade divergence for beginners?
Find two price swings where the oscillator disagrees with price. Mark the mismatch, then wait for a confirmation candle or a momentum cross. Enter after that confirmation, place a stop beyond the recent extreme, and aim for a prior level.
Which indicator is best for divergence?
Both the RSI and the MACD are common choices for this job. The RSI is a single clean line that makes the mismatch easy to see. A MACD histogram then adds a second view of fading momentum.
Is divergence a reliable signal?
Divergence is a useful warning, not a certainty. It works best inside a range or at a major level, and it fails more often in a strong trend. Always add confirmation and a stop before you treat it as tradable.
What is the difference between regular and hidden divergence?
Regular divergence warns of a possible reversal, since momentum fades against the trend. Hidden divergence points the other way and signals trend continuation. The two share the same tools but carry opposite meanings, so name the type first.
What timeframe works best for divergence?
Higher timeframes give stronger signals because larger swings reflect bigger crowds. The four-hour and daily charts suit swing traders well. Day traders often find the signal on the one-hour chart and time entries on the fifteen-minute.
Where do you place a stop on a divergence trade?
Place the stop beyond the most recent price extreme that formed the signal. A new high past a bearish divergence, or a new low past a bullish one, means the setup has failed. Keep the stop first and the size small. Results are not guaranteed; past performance is not indicative of future results.
External references
- For background on this concept, see Signal Line at Investopedia.
- For broader market context, see Momentum at Corporate Finance Institute.

About the author
Written by Dominic Walsh, a Forex trader and MT4/MT5 indicator, Expert Advisor and script developer. Every tool on forexmt4systems.com is tested on live charts before release and ships with ready-to-use compiled MT4 (.ex4) and MT5 (.ex5) files. Learn more about the trader and developer behind this site.
How we build, test and correct every tool: Editorial & Testing Policy. Trading carries risk; see the disclaimer.