
RSI divergence is one of the clearest momentum reads a trader can learn. It compares the swings on the price chart with the swings on the Relative Strength Index, and a disagreement between the two hints that a move is changing character.
This guide explains RSI divergence in full, from the basic mismatch to the graded class A, B, and C signals. So by the end, you will read both the regular and hidden forms, use oversold context, and trade the signal with a stop that fits.
What RSI Divergence Is
The Relative Strength Index is a momentum oscillator built by J. Welles Wilder in 1978. It runs from 0 to 100 and measures the pace of recent gains against recent losses. So a reading above 70 flags an overbought market, while one below 30 flags an oversold one. Those two zones become important context once you start hunting divergence.
Divergence appears when price and the RSI disagree at their swings. Price pushes to a new extreme, yet the RSI refuses to match it. So the momentum behind the move is fading, even while price still looks strong on the surface.
There are two families, and they carry opposite meanings. Regular RSI divergence warns of a reversal, since momentum drops away as the trend stretches. Hidden RSI divergence, by contrast, points to continuation on a pullback inside a trend.
Look at a live case. The chart shows AUDUSD on the four-hour timeframe with a 14-period RSI below price. Near 0.697, price makes a lower low, yet the RSI holds a higher low. So the clearest regular bullish divergence on this chart now sits under the market.
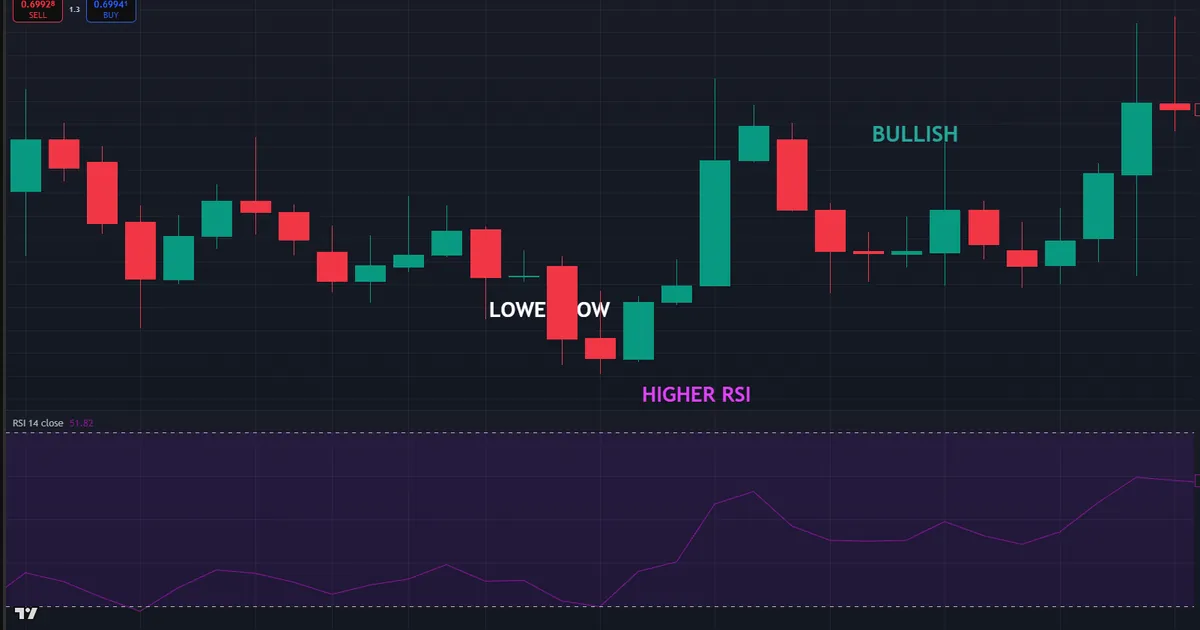
Now trace the two swings. Draw a line across the two price lows, then draw a line across the matching RSI lows. Because the price line falls while the RSI line rises, the two disagree. So sellers are driving price lower while their momentum quietly drains away.
How RSI Divergence Forms
The mechanics follow a simple sequence. So learn the steps once, then read any RSI divergence at a glance.
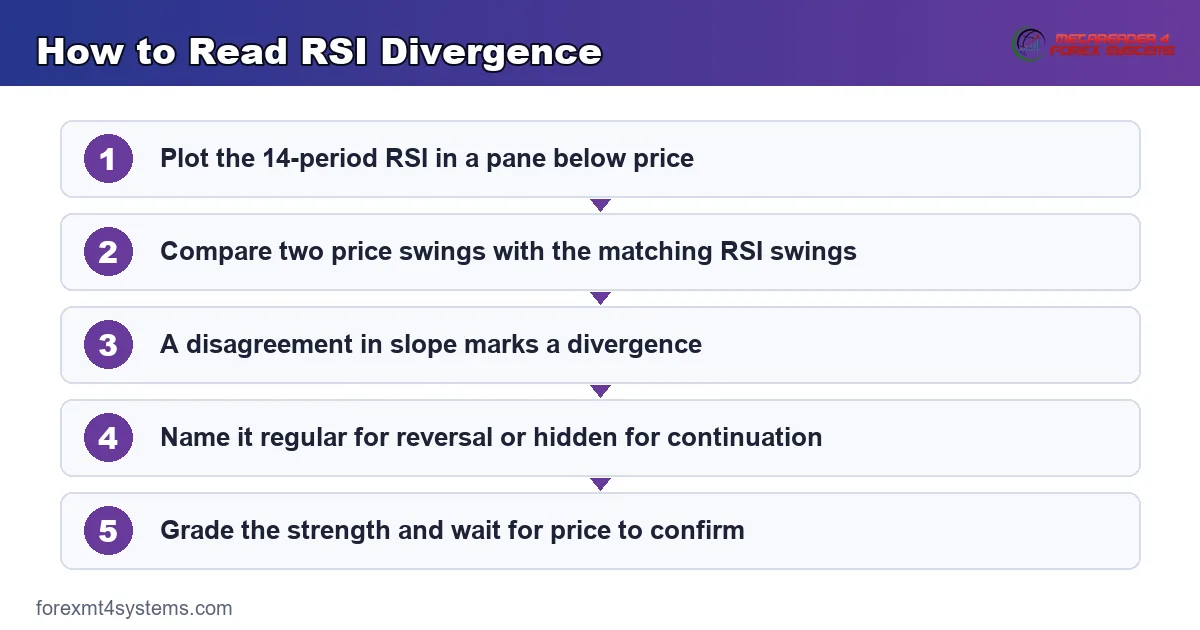
- Plot the RSI. Add the 14-period RSI in a pane below price so the swings sit side by side.
- Find two price swings. Locate two clear highs for a top, or two clear lows for a bottom.
- Mark the RSI swings. Note the matching RSI peaks or troughs beneath those price swings.
- Compare the slopes. When the price line and the RSI line point in opposite directions, a divergence exists.
- Name the type. Read the price swing to label it regular for reversal or hidden for continuation.
So RSI divergence is just a picture of momentum falling out of step with price. The concept graphic below sets the regular reversal form beside the hidden continuation form.
One detail keeps you honest. The RSI swings must line up with genuine price swings, not tiny bumps. Because a weak swing gives a weak signal, only clear turning points carry any real weight. So mark the two obvious peaks or troughs, then ignore the small wiggles between them.
Regular Versus Hidden RSI Divergence
Regular divergence forms at the end of a move. In a bullish case, price makes a lower low while the RSI makes a higher low, which hints at a bottom. In a bearish case, price makes a higher high while the RSI makes a lower high, which hints at a top.
Hidden divergence forms on a pullback and favours continuation. Here a bullish signal shows price holding a higher low while the RSI dips to a lower low. So the same tool reads two ways, and the price swing decides which story applies. Our guide to hidden divergence covers that continuation logic in depth.
The Three Classes of RSI Divergence
Traders often grade regular divergence into three classes. So the grade tells you how much to trust a given signal before you risk money. This simple system dates back to the early technical-analysis literature on momentum.
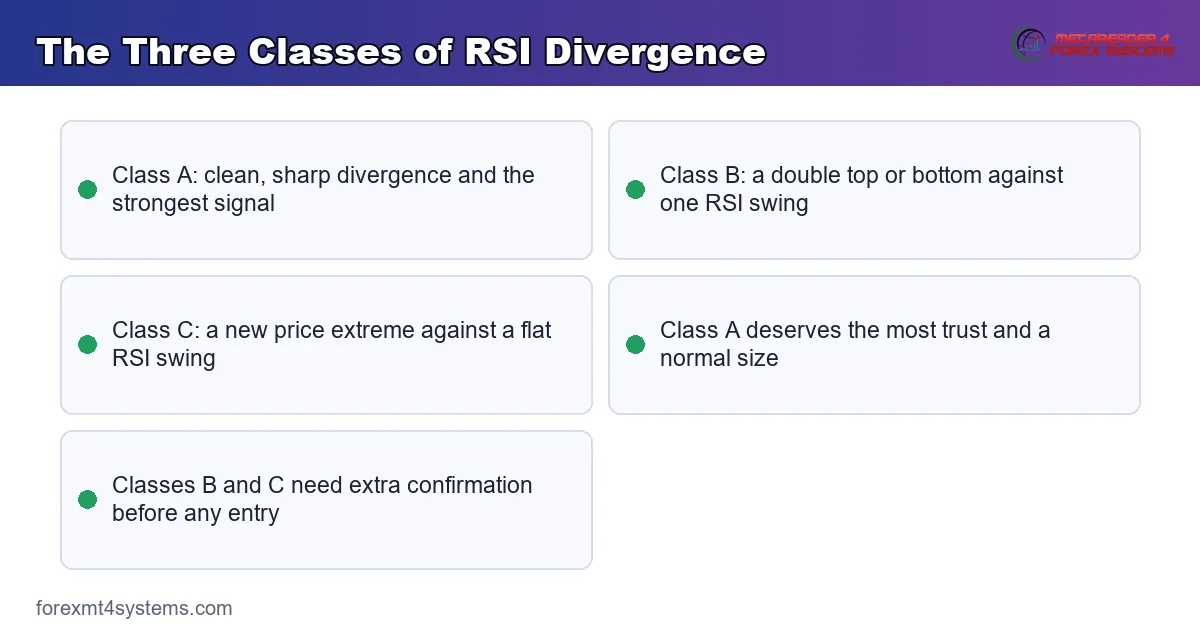
The classes rank from strongest to weakest. A class-A signal is the cleanest and the most reliable, while class B and class C are murkier. So knowing the class keeps you from treating every mismatch as equal.
Class A: The Strongest Signal
Class A is the textbook divergence and the one worth waiting for. In a bullish case, price carves a clearly lower low while the RSI carves a clearly higher low. So both swings are sharp and obvious, and the momentum shift is plain.
This class earns the most trust. Because the pattern is clean, it turns price more often than the weaker grades. So a class-A signal deserves your full attention and a normal position size when other clues agree. A sharp swing on both price and the RSI is the hallmark to look for here.
Class B: The Double Swing
Class B is softer and easy to miss. Price forms a double bottom, roughly equal lows, while the RSI makes a higher low between them. So the price swing barely moves, yet momentum has clearly improved.
Treat class B with more caution. Because the price signal is flat, the read leans heavily on the RSI. So demand a confirmation candle and a supporting level before you act on a class-B mismatch. A double bottom on real support, with a rising RSI, is the version worth taking.
Class C: The Weakest Grade
Class C is the faintest of the three. Price makes a new low, yet the RSI prints a roughly equal, flat low. So momentum has stalled without truly improving, which is a weak hint at best. A flat RSI low tells you the selling has merely paused, not reversed.
Handle class C with real care. Because the signal is so thin, it fails often and suits only the most confluent setups. So many traders skip class C entirely and wait for a cleaner grade. Patience here usually costs far less than a string of thin, failed entries.
Why the Grade Guides Your Size
The class does more than label a signal. It also tells you how much to risk on the trade. A clean class-A read at a level can carry a normal size, while a class-B or class-C read deserves a smaller one.
Think of the grade as a confidence dial. Higher confidence earns a fuller position, and lower confidence earns a trimmed one. Because the weak grades fail more often, a smaller stake keeps those losses light. So let the class set the size, not just the decision to trade.
Consistency matters here as well. A trader who sizes every signal the same way ignores the real edge in grading. So build a simple rule: class A gets full size, class B gets half, and class C usually gets nothing at all.
Settings and Workflow
Start with the standard 14-period RSI, since it suits most charts. I would keep that default until you have a clear reason to change it. A shorter length reacts faster but fires more noise, while a longer one smooths the swings.
The overbought and oversold zones add context to a signal. A bearish divergence that forms while the RSI sits above 70 carries extra weight. Likewise, a bullish divergence from below 30 gains support from an oversold, stretched market. So read the level alongside the mismatch.
Think of the level as a backdrop, not a trigger. A signal at an extreme simply starts from a stronger position, since the market is already stretched. Because a mid-range divergence lacks that tension, it usually turns price less often. So weight your entries toward signals that form at the edges of the RSI range.
Timeframes and Higher-Chart Context
Higher timeframes give stronger RSI divergence. A signal on the four-hour or daily chart reflects a bigger crowd than one on the one-minute chart. Because larger swings carry more weight, their divergences turn price more reliably. So treat a daily signal with real respect.
Keep the two charts in agreement. A divergence on the four-hour means more when the daily trend is already stalling. So let the higher chart set the context, and use your working chart only for the exact entry. Our notes on RSI settings for day trading dig into the shorter frames.
Pairing RSI Divergence With Structure
Structure turns a good signal into a strong one. A bullish divergence that forms on old support ranks far above one in open space. So blend the momentum read with prior divergence techniques and key levels.
Confluence is the filter that keeps you selective. When a class-A signal, an oversold RSI, and a support shelf all meet, the case is strong. Because several clues point one way, a reversal there looks far more believable. So stack the evidence, then act only where it agrees.
Weigh the clues rather than counting them. Two strong reasons, such as a class-A grade on real support, beat five weak ones. Because quality matters more than quantity, a tidy setup earns more trust than a crowded chart. So judge the confluence, then size the trade to match your confidence.
Worked Example: AUDUSD Bullish Divergence
Picture AUDUSD sliding lower on the four-hour chart toward 0.697. The fall looks heavy, yet the RSI is quietly turning up. Its second trough sits above its first, so the clearest bullish divergence on the chart is in place.
Now wait for the chart to agree. Price stalls at the lower low, then prints a bullish reversal candle with a long lower wick. At the same time, the RSI turns up from below 30, deep in oversold territory. So momentum, level, and candle all confirm the fading decline. The chart below marks the entry and the stop.
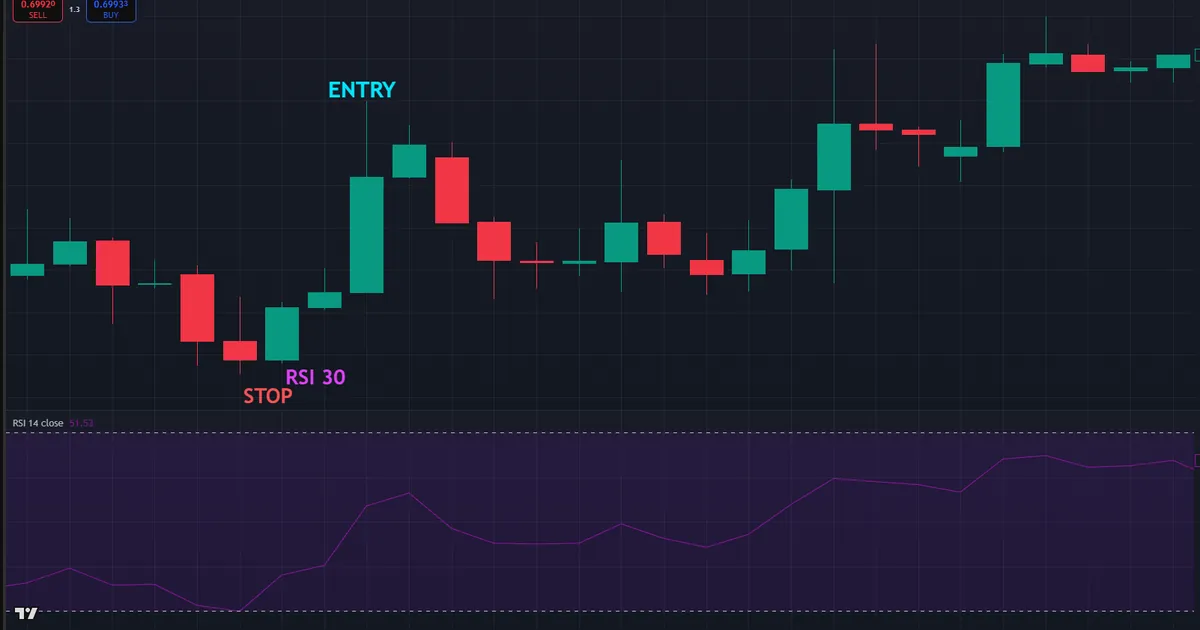
Then set the risk with care. The entry sits just above the reversal candle, and the stop tucks below the swing low near 0.694. Because a new low would erase the divergence, that spot is the honest place for a stop. Our free position size calculator turns the stop distance into a size in seconds.
The follow-through rewarded the patience. Price turned up from the oversold low, broke the last minor high, and climbed toward prior resistance. So the confirmed entry caught the turn while the tight stop capped the risk. That blend of a clean momentum read and a late trigger is the heart of trading RSI divergence.
Why This Trade Earned Full Size
Weigh why this setup earned a full size. It was a clean read, it sat at prior support, and the RSI was deeply oversold below 30. Because three strong clues pointed the same way, the confidence dial sat high. So the trade took a normal position rather than a cautious, trimmed one.
Contrast a rushed version to see the gain. A trader who bought the first oversold reading, with no divergence and no candle, would have caught a falling market. Because that entry skipped the grade and the confirmation, it lacked any real edge. So the patient plan did not just find a better price; it also rested on a far stronger case.
Managing the AUDUSD Trade
Handle the trade in stages once it moves. As price breaks the first minor high, lift the stop toward breakeven so the position can no longer hurt. Because the turn has proven itself, that shift protects the account while the move develops.
Then let prior resistance guide the exit. That shelf above gave the trade a clear, logical target. Because the reward beat the risk from the start, the setup fit a sensible plan. So one graded signal timed the entry, set the stop, and framed the exit in a single read.
Download the complete indicator database
Put these concepts on your charts. One email unlocks the full library of 1,380+ indicators with compiled MT4 and MT5 files, plus my TradingView scripts. No paywall, no spam, unsubscribe any time.
Get free access to my indicator database
One email unlocks 1,380+ free MT4, MT5 and TradingView indicators — the complete library. No single-tool download; you get the whole database.
Common Mistakes and How to Fix Them
RSI divergence tempts traders into early, lonely entries. Most errors trace back to trading weak grades or skipping confirmation, and the fixes follow beneath the graphic.
Trading Weak Class-C Signals
A flat RSI low against a new price low is a thin read. Acting on it as if it were class A invites trouble. So grade every signal first, then reserve full size for the clean class-A patterns and skip most class-C ones.
Ignoring Overbought and Oversold Context
A divergence in the middle of the RSI range means less than one at an extreme. Traders who ignore the level miss half the picture. So favour bearish signals from above 70 and bullish signals from below 30, where the market is already stretched.
Entering With No Confirmation
An RSI mismatch can sit for many bars while price keeps trending. Acting on it alone puts you in front of a live move. Instead, wait for a reversal candle or a broken minor level before you commit to the trade.
Fighting a Very Strong Trend
A powerful trend can print divergence again and again without turning. Traders who fade every signal in a rocket move get run over. So respect the larger trend, and take counter-trend RSI divergence only at major levels.
Placing the Stop Too Tight
A stop a pip beyond the swing gets tagged by normal noise. Momentum turns are rarely instant or clean. So give the stop room past the recent extreme, so an ordinary retest cannot end the trade before the idea plays out.
Pre-Trade RSI Divergence Checklist
Run this short list before every RSI divergence trade. A few seconds here saves a rushed entry later. So keep it in view, and let a missing check talk you out of a marginal setup.
- Two clear price swings with a matching RSI mismatch.
- The signal graded as class A, B, or C.
- An overbought or oversold RSI reading for context.
- The higher-timeframe trend checked for direction.
- A confirmation candle or broken minor level in place.
- A support or resistance level near the signal.
- A stop set beyond the most recent price extreme.
When RSI Divergence Fails
Study the failure as hard as the winner. Here is a common one. A trader spots a bearish RSI divergence on EURUSD near 1.15, with the RSI above 70, and shorts at once. The lower RSI high looks convincing.
Then the trend ignores it. Price barely dips, then pushes to a fresh high and keeps climbing while the RSI stays elevated. The chart below shows the divergence that never reversed, with price trending straight over the warning.
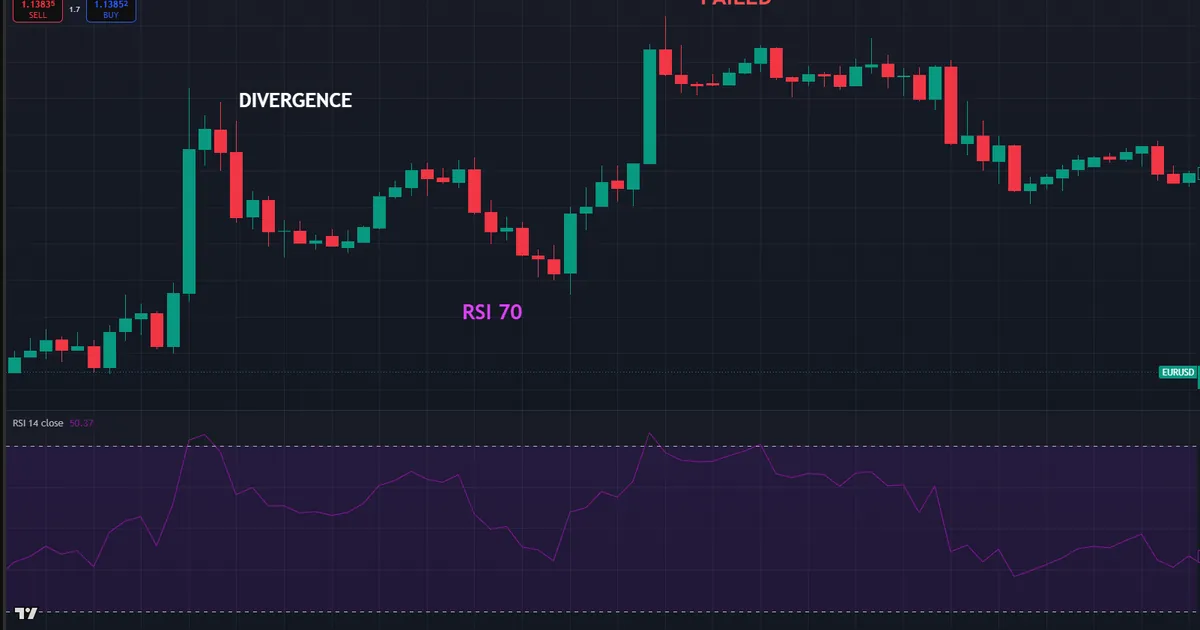
So what went wrong? RSI divergence measures fading momentum, not a certain turn. In a strong trend, the RSI can stay overbought for a long stretch while price keeps rising. Hence the rule that saves the account: wait for confirmation and honour the stop, so a failed signal stays a small loss. The trader who shorted on the mismatch alone, with no candle and against the trend, took the worst version of the trade.
Overbought Can Stay Overbought
Notice the trap in a trending market. A high RSI is not a short signal on its own, since strong trends keep the reading pinned up high. So a bearish divergence in a powerful uptrend often fails, because the momentum simply reloads. Read the level as context, never as a standalone trigger.
Grade and Confirmation Cut the Risk
Be honest about what protects you here. A weak grade with no confirmation, taken against the trend, is the riskiest trade on the board. Because those signals fail so often, the class and the candle do most of the filtering. So demand a strong grade and a clear trigger, then let price prove the idea right or wrong.
Related Concepts to Study Next
RSI divergence connects to a wider family of momentum ideas, and a few deserve your next reading hour. A firm grasp of the basics keeps the entries disciplined, so a look at what divergence is grounds the why behind the grades. The full trading routine also matters, which the pairing section above ties back to a practical plan.
For hands-free charting, the RSI indicators archive plots the oscillator and its signals automatically, while the oscillator indicators archive gathers its cousins in one place. Tools speed the scan, yet the logic above still carries the trade. So master the two-swing read first, then let any indicator on the chart simply plot the momentum you already know exactly how to grade and trade.
FAQ
What is RSI divergence in simple terms?
RSI divergence is a mismatch between price and the Relative Strength Index. Price makes a new high or low, but the RSI does not follow. So the momentum behind the move is fading, which hints at a reversal or a continuation depending on the type.
What RSI setting is best for divergence?
The standard 14-period RSI that Wilder designed suits most charts. It keeps the swings readable without adding too much noise. Shorten it for faster intraday signals or lengthen it to smooth the reading, changing one variable at a time.
What are class A, B, and C divergences?
They are grades of strength. Class A is the cleanest and strongest, with sharp swings on both price and the RSI. Class B leans on a double top or bottom, and class C is the weakest, with a flat RSI swing.
Does RSI divergence work in a strong trend?
It works less well there. A strong trend can keep the RSI overbought or oversold while price runs on, so the signal often fails. Take counter-trend RSI divergence only at major levels, and favour signals that agree with the trend.
How do you confirm an RSI divergence signal?
Wait for price to agree before you enter. A reversal candle, a broken minor level, or an RSI cross out of an extreme all help. Add a support or resistance level and a strong class grade for the best odds.
Where do you place a stop on an RSI divergence trade?
Place the stop beyond the most recent price extreme that formed the signal. A new high past a bearish divergence, or a new low past a bullish one, means the setup has failed. Keep the stop first and the size small. Results are not guaranteed; past performance is not indicative of future results.
External references
- For background on this concept, see Most Common Trend Trading Indicators at Investopedia.
- For broader market context, see Momentum Indicator at Corporate Finance Institute.

About the author
Written by Dominic Walsh, a Forex trader and MT4/MT5 indicator, Expert Advisor and script developer. Every tool on forexmt4systems.com is tested on live charts before release and ships with ready-to-use compiled MT4 (.ex4) and MT5 (.ex5) files. Learn more about the trader and developer behind this site.
How we build, test and correct every tool: Editorial & Testing Policy. Trading carries risk; see the disclaimer.