
Pin bar meaning comes from a single bar with one very long wick and a small body tucked at the opposite end. Price ran hard in one direction, then gave the whole move back before the close.
Price action traders adopted the name, and it stuck. Yet the shape itself already had older names, which causes most of the confusion around it.
So this guide covers the exact geometry first, then the overlap with the classic candlestick names, and finally the ways the bar disappoints. Nothing here treats the shape as a forecast.
Pin Bar Meaning: The Exact Anatomy
Four numbers build any candle: open, high, low and close. A pin bar arranges them so that one wick dominates the bar’s entire range.
The body sits at one extreme, small and unimpressive. Beyond it, a short wick or none at all closes off that end of the bar.
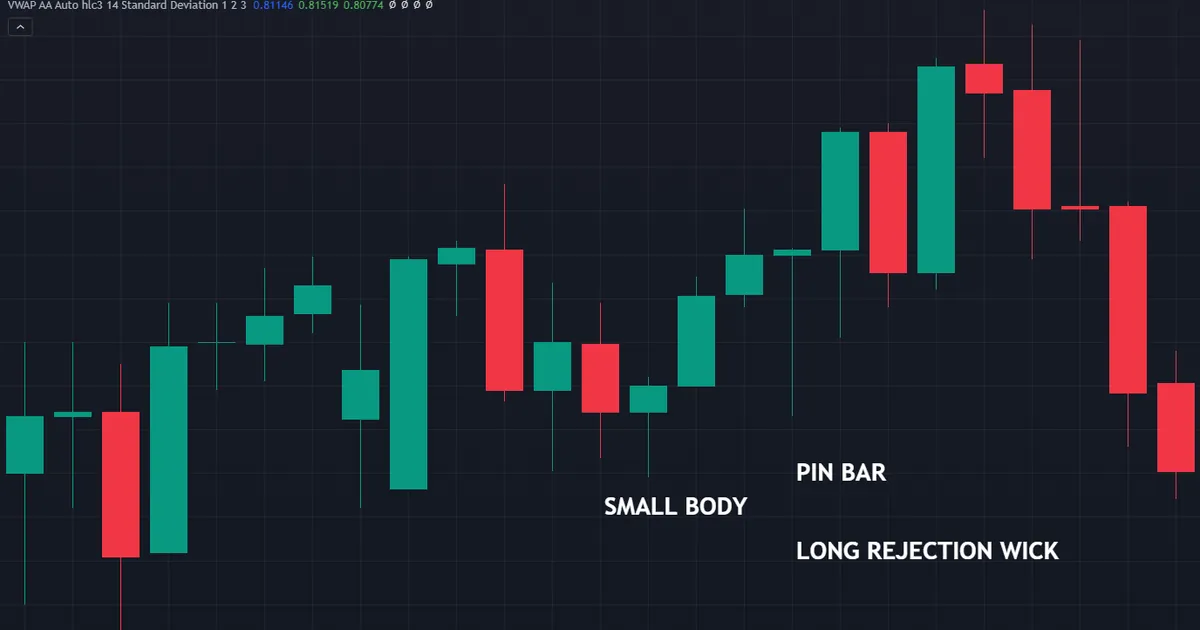
Notice that direction plays no part in the definition. Colour hardly matters, because the wick supplies the whole story.
The Long Wick, or Nose
Traders call the dominant wick the nose or the tail, depending on which side it hangs from. It records a move that the market fully rejected inside the same session.
Length carries the weight here. A wick barely longer than the body describes an ordinary bar, not a rejection.
So measure rather than glance. The nose should dominate the bar so obviously that nobody would argue about it.
The Body and the Short Wick
The body belongs at the far end of the range, well away from the nose. A body drifting toward the middle turns the bar into a spinning top instead.
Any wick beyond the body should stay short. Some traders allow a small one, while stricter definitions demand almost none.
Colour of the body counts for very little. A bullish pin bar with a red body still describes rejection of the lows.
The Measurement Most Traders Use
A common convention asks the nose to cover at least two thirds of the bar’s total range. The body plus the opposite wick then share the remaining third.
Others use a simpler ratio. They want the wick at least twice the length of the body, which allows a slightly looser shape.
Pick one and write it into your plan. Two traders using different thresholds will disagree about the same bar forever.
Bullish and Bearish Versions
A bullish pin bar hangs its nose below the body. Sellers pushed price down through the session, and buyers reclaimed everything before the close.
A bearish pin bar flips that arrangement. The nose points up, the body sits at the low end, and the session ended with the advance rejected.
Both versions describe the same event in mirror image. Neither one predicts anything by itself.
Traders often shorten the names further. A bullish version becomes a buying tail, and a bearish version becomes a selling tail.
Whatever label you prefer, keep the geometry constant. Nicknames multiply quickly, and a written definition stops them from drifting.
Where the Pin Bar Name Came From
The term shortens “Pinocchio bar”, and traders widely attribute it to Martin Pring. His work on technical analysis popularised the idea in the early 1990s.
The metaphor does real work. A bar that pokes far beyond a level and then closes back inside told the market something untrue about direction.
Pinocchio and the Lie
Picture a bar that breaks yesterday’s high by twenty pips. Breakout buyers step in, and the bar then closes back beneath that high.
The long nose exposes the lie. Everybody who bought the break now sits underwater, and their exits can push price further the other way.
So the name captures a mechanism rather than a shape alone. That mechanism explains why location matters so much.
Why the Metaphor Helps
Classic candlestick names describe geometry. The Pinocchio framing describes participation, which most traders find easier to reason about.
It also points you straight at the useful question. Which level did the nose poke through, and who got trapped there?
How a Pin Bar Overlaps With the Classic Names
Here honesty matters more than novelty. A pin bar rarely represents a discovery, because Japanese candlestick vocabulary already named these shapes decades earlier.
The table below lines them up. Read it once and the overlap stops causing trouble.
| Shape | Nose direction | Prior move | Classic name |
|---|---|---|---|
| Bullish pin bar | Down | After a decline | Hammer |
| Bullish pin bar | Down | After an advance | Hanging man |
| Bearish pin bar | Up | After an advance | Shooting star |
| Bearish pin bar | Up | After a decline | Inverted hammer |
Hammer and Hanging Man
Both carry the identical geometry: small body at the top, long lower wick, little above. Only their position in the wider move separates them.
A hammer follows a decline, and a hanging man follows an advance. Our guide to hammer candlestick meaning works through that distinction in detail.
So the pin bar label covers both without distinguishing them. That convenience costs you the context the older names carried.
Inverted Hammer and Shooting Star
Flip the shape and the same rule applies. A long upper wick after an advance earns the shooting star name, while the identical bar after a decline becomes an inverted hammer.
Our note on the shooting star candlestick covers the bearish side. Read the two guides together and the family fits into place.
What the Price Action Name Adds
One genuine contribution stands out. The pin bar framing insists on the level the nose pierced, which the classic names leave implicit.
That emphasis changes how traders scan. Instead of hunting shapes, they mark levels and wait for a bar to poke through one.
So treat the two vocabularies as complementary. Geometry from the classic names, location from the price action framing.
Reading a Pin Bar Step by Step
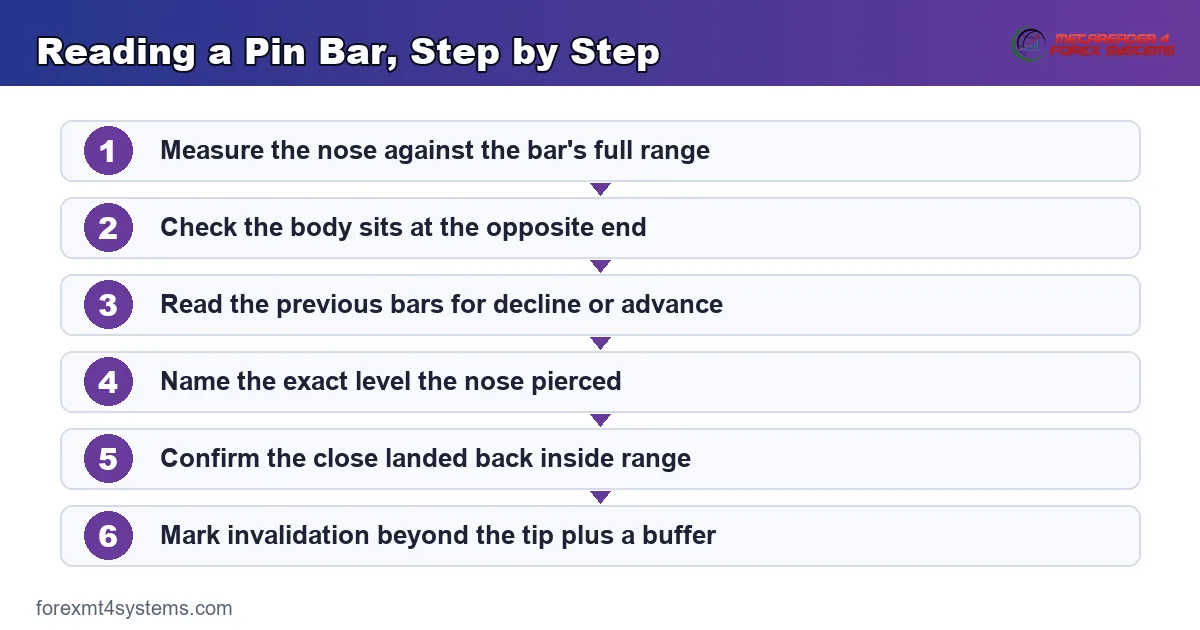
Six checks cover the bar and its surroundings. Run them in order and stop the moment one fails.
- Measure the nose. Compare the dominant wick against the bar’s total range using your written threshold.
- Locate the body. It belongs hard against the opposite end, with little or no wick beyond it.
- Read the previous bars. Decline, advance or range determines which classic name applies.
- Name the level. Identify exactly what the nose pierced: a prior high, a session extreme, a moving average or nothing at all.
- Check the close. The body should finish back inside the previous bar’s range for the lie to count.
- Set invalidation. Mark the tip of the nose plus a buffer as the price that ends the idea.
Only steps three and four decide whether the bar deserves your attention. The rest simply confirm the label.
What the Bar Actually Describes
Strip away the vocabulary and one event remains. A group of participants committed in one direction, and a larger group pushed price back past their entry.
That description stays modest on purpose. It covers what the session did, without pretending to know what the next session will do.
Who Ends Up Trapped
Breakout traders supply most of the trapped orders. They buy above a marked high or sell beneath a marked low, expecting continuation.
When the close lands back inside the range, those positions sit underwater immediately. Their eventual exits add fuel to any move in the opposite direction.
So the useful question concerns crowding rather than shape. A nose piercing a level nobody watched traps nobody at all.
Why the Close Carries the Weight
Intrabar movement fascinates traders, and it rarely helps. Only the closing price records where the session actually settled.
A bar that pokes through a level and closes beyond it describes a break. The same poke followed by a close back inside describes a failure.
That single difference separates a pin bar from an ordinary breakout bar. Wait for the close before naming anything.
Volume and the Forex Caveat
Rising activity during the rejection supports the reading. Genuine exchange volume makes that case cleanly on futures charts.
Spot forex offers only tick volume from a single broker. Treat any volume confirmation in currencies as a hint rather than as evidence.
Why Location Decides the Reading
A pin bar in open space describes a busy session and nothing more. The same bar poking through a level that held twice describes trapped traders.
Academic testing of standalone candlestick shapes has generally found little consistent edge once costs enter the sum. Results move around with the market, the period and the definition applied.
That evidence argues for context rather than abandonment. The bar earns its place as a location tool, not as a trigger.
Levels You Marked in Advance
Draw your levels before the session starts. A line drawn after the candle prints will always look convincing, which makes it worthless.
Prior swing highs and lows, round numbers and old ranges all qualify. Our guide to multi-timeframe analysis shows how to pull those levels from a slower chart first.
Trend Pullbacks
Many traders prefer pin bars that appear at the end of a pullback inside a trend. The bar then marks where the pullback ran out of participants.
Context does the heavy lifting in that setup. The trend supplies the direction, and the bar merely supplies the timing.
Moving Averages and Dynamic Levels
Some traders treat a long moving average as the level. A nose that dips through it and closes back above carries a similar trapped-trader story.
Dynamic levels behave differently from horizontal ones, though. They move each bar, so the invalidation price shifts with them rather than staying fixed.
Because of that, many traders prefer horizontal references for the stop. The average supplies context, and the swing supplies the number.
Session Extremes and Sweeps
Forex runs around the clock, so session highs and lows replace much of what gaps once provided. A nose that pierces the Asian session high and closes back inside carries obvious meaning.
Our note on liquidity sweep trading explains why price gravitates toward those clusters. The pin bar often prints exactly where the sweep ends.
A Worked Pin Bar at Resistance
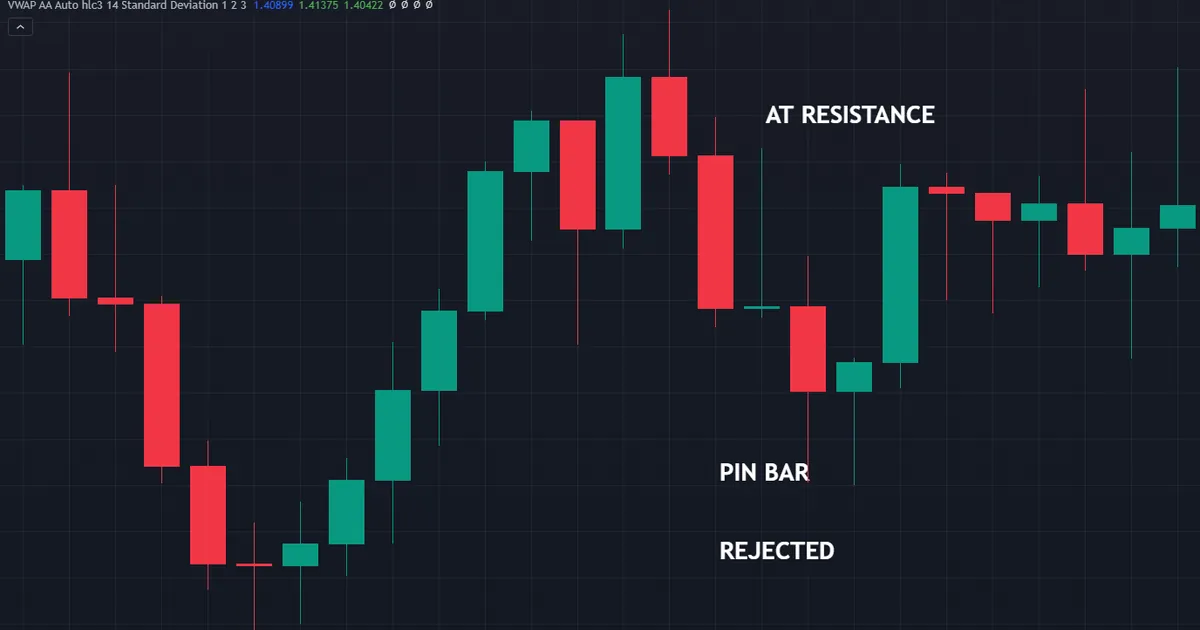
Picture a pair rallying for weeks into an area where sellers turned it back twice. Price then slips away from that area.
The next bar stretches back up toward it. Sellers appear again, and the bar closes right down at its own low with a long upper nose.
Reading the Sequence
Three facts sit together now. The push higher stalled below the old highs, the whole gain was given back inside one bar, and buyers who chased it sit offside.
None of that promises a decline. It does describe a location where a short idea carries a tight, obvious invalidation point.
Entry, Stop and Target
The tip of the nose supplies the invalidation price. A close above it says the rejection did not hold after all.
Entry styles differ. Some traders sell the close of the bar, while others wait for a retest of the body before committing.
Size from the stop distance rather than from habit. Our ATR position size calculator turns volatility and stop distance into a lot size directly.
Managing Afterwards
Once price leaves the bar, the bar stops guiding anything. Structure and the next levels take over the decision.
Trail behind swing highs rather than behind the original nose. A single candle from four sessions ago cannot manage a live position.
What a Sensible Target Looks Like
Targets belong on structure rather than on round multiples. The previous swing low, the opposite edge of the range, or an untested level all work.
Compare that distance against the stop before you commit. A setup offering less than one to one rarely deserves the risk, however tidy the bar looks.
Some traders scale out at the first structure and trail the remainder. That approach suits pin bars, because the tight stop makes an early partial exit cheap.
Download the complete indicator database
Put these concepts on your charts. One email unlocks the full library of 1,380+ indicators with compiled MT4 and MT5 files, plus my TradingView scripts. No paywall, no spam, unsubscribe any time.
Get free access to my indicator database
One email unlocks 1,380+ free MT4, MT5 and TradingView indicators — the complete library. No single-tool download; you get the whole database.
Common Pin Bar Mistakes and Fixes
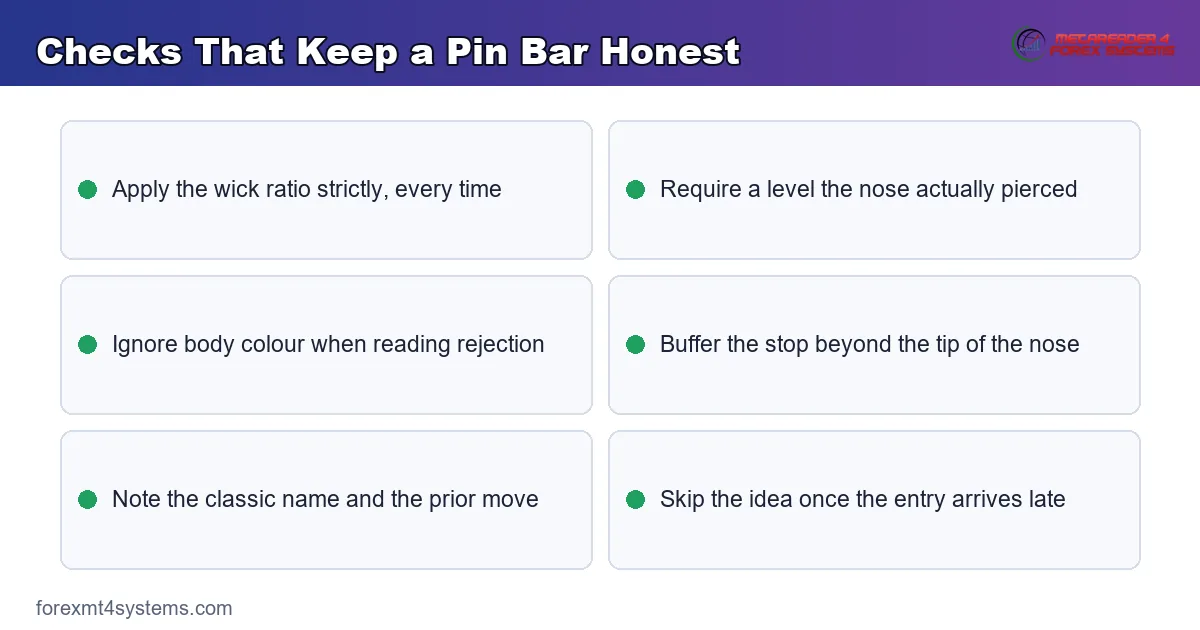
Six habits cause most pin bar disappointment. The keypoints panel below gathers the checks that prevent them.
Trading Every Long Wick
Long wicks appear on hundreds of bars every week. Apply your ratio strictly and reject anything that fails it, however tempting the chart looks.
Ignoring What the Nose Pierced
A pin bar that pierced nothing traps nobody. Require a named level, a session extreme or a clear pullback low before the bar counts.
Using It on a One-Minute Chart
Sixty seconds of trade rarely reflects genuine rejection. Move up the timeframes until each bar represents real participation.
Placing the Stop on the Tip
Stops resting exactly on the nose invite a one pip sweep. Add a buffer sized from recent volatility rather than from wishful thinking.
Forgetting the Classic Name
Calling everything a pin bar erases the location information the older names carried. Note whether the bar follows a decline or an advance every single time.
Chasing the Bar Late
Entering three bars after the close removes the tight invalidation that made the setup attractive. Take the entry near the bar or skip the idea entirely.
Pin Bar Quick Reference
Seven questions cover the bar and its context. Answer them before you place anything.
- What share of the bar’s range does the nose occupy?
- Does the body sit hard against the opposite end?
- Did a decline, an advance or a range precede the bar?
- Exactly which level did the nose pierce?
- Did the close land back inside the previous bar’s range?
- Where does the invalidation price sit, including a buffer?
- Which classic name applies: hammer, hanging man, shooting star or inverted hammer?
Write the answers down rather than holding them in your head. A short note beside the chart survives far longer than an impression.
When a Pin Bar Fails
Failure teaches more than success here. The chart below shows a textbook bar whose marked wick low is cut clean through two sessions later.
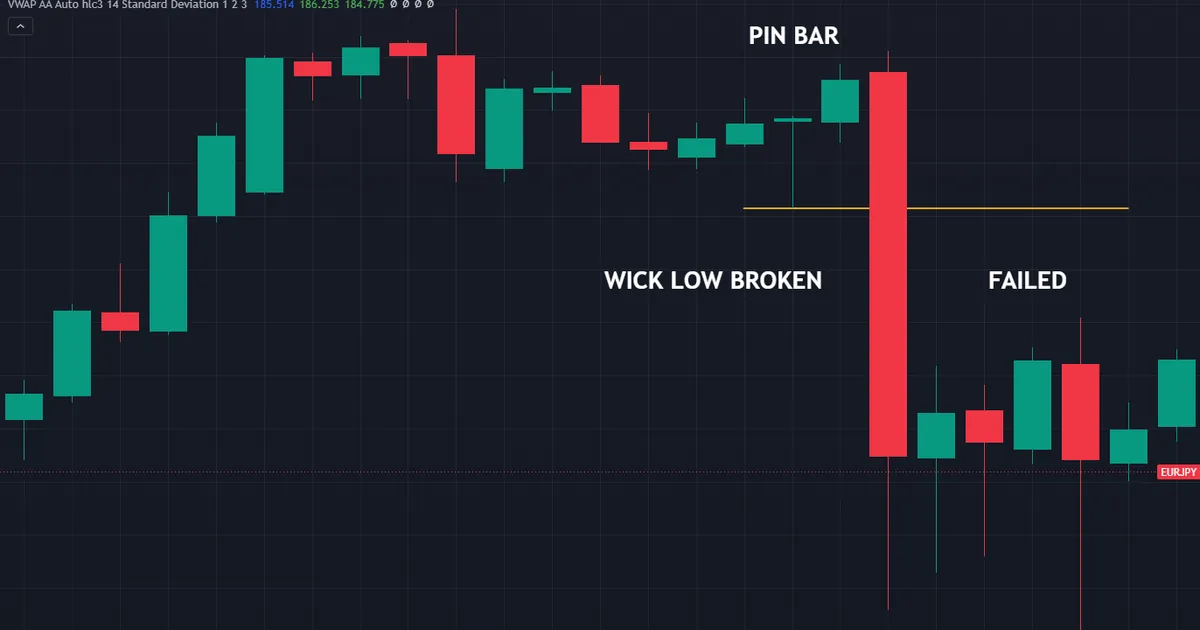
The Level Gives Way Anyway
Rejection during one session says nothing about the next. Strong trends pierce a level, pull back, then push through on the following bar.
That outcome appears constantly during genuine breakouts. Accepting it as normal keeps your sizing sensible.
The Nose Gets Swept
Stops gather just beyond the tip, and clusters attract price. A quick poke through them removes you before the move you expected arrives.
Buffer the stop with recent volatility. Paying a few extra pips regularly beats losing the whole idea to a two pip overshoot.
The Bar Prints Mid-Range
Ranges produce beautiful pin bars in the middle where nothing matters. Only the edges of a range carry structural weight.
News Overwrites the Rejection
A scheduled release can undo any single-bar story within seconds. Check the calendar before trading a bar that formed just ahead of one.
The Wick Came From a Spread Spike
Thin sessions and broker feeds occasionally paint wicks that never traded elsewhere. Compare the bar against a second feed when the shape looks too perfect.
Turning the Shape Into a Written Rule
Measured rules behave the same on every chart. Eyeballed rules behave however your mood dictates that morning.
So convert the anatomy into four numbers and store them in your plan. Each number removes a judgement call you would rather not make under pressure.
The Four Numbers
First, the minimum share of the range the nose must occupy. Second, the maximum size of the body against that range.
Third, the minimum timeframe you will act on. Fourth, the buffer beyond the nose that defines your invalidation price.
Reviewing the Rule
Pull every pin bar trade from the past month and sort them by the level the nose pierced. Named levels and open space usually separate cleanly.
Then change one number at a time. Adjusting all four at once teaches you nothing about which one mattered.
Log the setups you skipped as well. Rejected bars carry the same information and cost nothing to record.
Testing the Threshold Fairly
Two thresholds usually compete for attention: a strict one and a loose one. Run both against the same three months of charts before choosing.
Count how many bars each version produces. A strict rule that yields two setups a year cannot support a routine, however clean those setups look.
Then weigh frequency against quality honestly. Neither extreme suits everyone, and the right balance depends on how much screen time you actually have.
Related Concepts to Study Next
Single-bar rejection makes more sense beside its two-bar cousins. Two short reads round out the picture.
Start with our comparison of pin bar versus engulfing, which sets rejection against absorption. The two shapes describe different mechanics at the same locations.
For tooling, browse the price action indicators archive and the candlestick indicators archive. Automatic marking frees your attention for the location question.
FAQ
What does a pin bar mean?
It means one wick dominated the bar’s range while the body finished at the opposite end. Price travelled a long way in one direction during the session and gave all of it back. The bar reports rejection of that excursion, nothing further.
Is a pin bar the same as a hammer?
Largely, yes. A bullish pin bar after a decline matches the hammer definition, and the same shape after an advance matches the hanging man. The price action name covers both without naming the prior move, so the older vocabulary carries more information.
How long should the wick be?
A common convention asks the nose to cover at least two thirds of the bar’s total range. Others simply want the wick at least twice the body length. Choose one threshold, write it down, and measure the same way every time.
Does the body colour matter?
Very little. A bullish pin bar with a red body still records rejection of the lows, because the wick carries the story. Some traders prefer a body that closes in the direction of the idea, though the difference stays cosmetic.
Which timeframe suits pin bars best?
Higher timeframes involve more participants, so their bars represent genuine rejection more reliably. Daily and four-hour charts remain the most common choices. Plenty of traders ignore any pin bar below the fifteen-minute chart entirely.
Can I trade a pin bar on its own?
Most experienced traders do not. They mark levels first, wait for a nose to pierce one, and use the bar only to time the entry and set an invalidation price. Results are not guaranteed; past performance is not indicative of future results.
External references
- For background on this concept, see Reversal at Investopedia.
- For broader market context, see Spinning Top at BabyPips Forexpedia.

About the author
Written by Dominic Walsh, a Forex trader and MT4/MT5 indicator, Expert Advisor and script developer. Every tool on forexmt4systems.com is tested on live charts before release and ships with ready-to-use compiled MT4 (.ex4) and MT5 (.ex5) files. Learn more about the trader and developer behind this site.
How we build, test and correct every tool: Editorial & Testing Policy. Trading carries risk; see the disclaimer.