
The morning star vs evening star question has one clean answer, and everything else follows from it. Both patterns use the same three-bar skeleton, and only the direction of the prior move tells them apart.
So this comparison leads with the distinction rather than teaching both shapes from scratch. Once you can flip the mirror in your head, one pattern gives you the other for free.
The rest of the guide covers the geometry they share, the gap that textbooks demand and forex rarely provides, and the failure case that trips most traders who learn these shapes from a picture.
Morning Star vs Evening Star: The One Real Difference
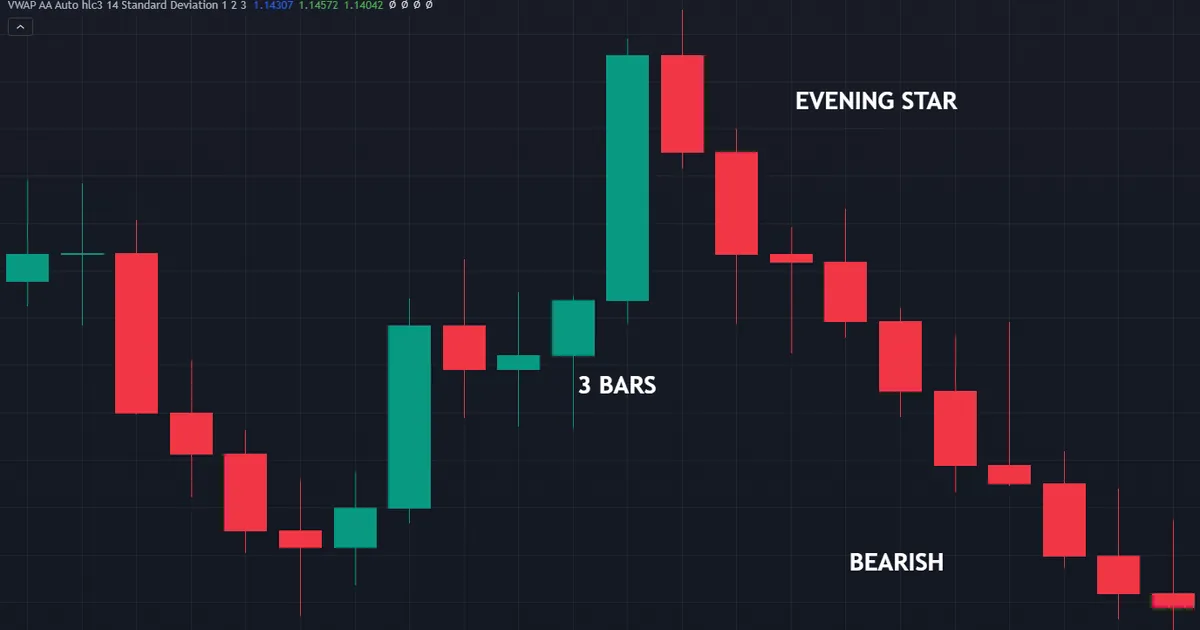
A morning star appears after a decline. An evening star appears after an advance, and that single word swap accounts for the entire difference between them.
Everything else mirrors exactly. Bar colours flip, the pause sits at the opposite end of the move, and the third bar drives the other way.
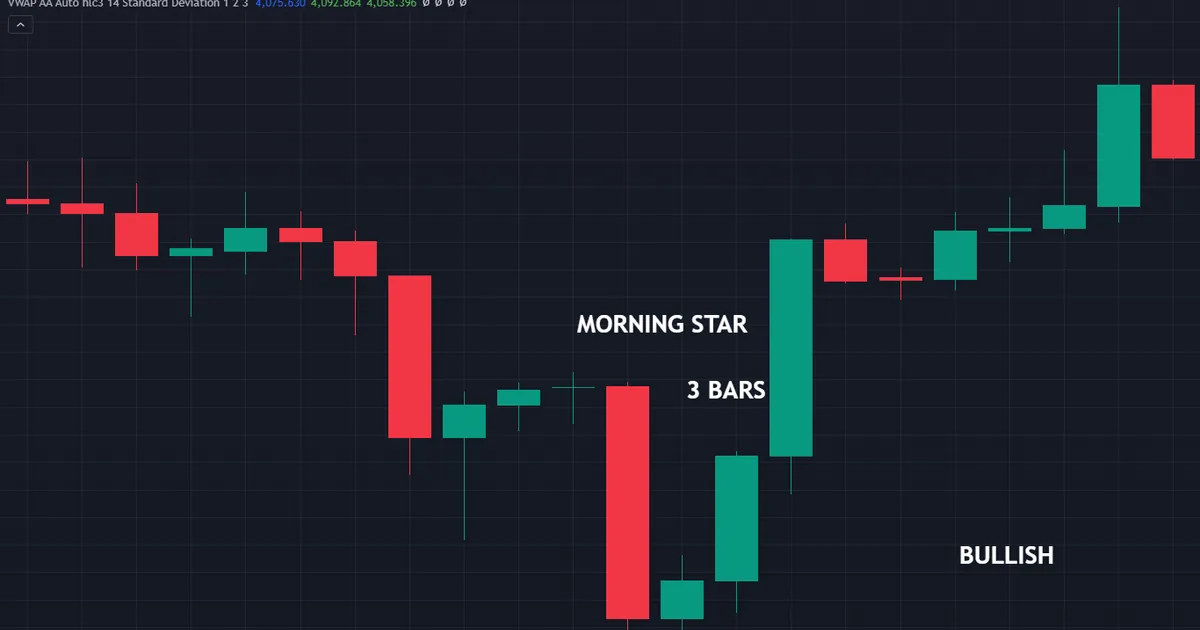
So a trader who knows one pattern already knows the other. Learn the morning star properly, then read every rule upside down and you have the evening star.
The Distinction in One Sentence
A morning star describes selling pressure exhausting itself at the bottom of a move. An evening star describes buying pressure exhausting itself at the top.
Notice the word describes. Neither shape predicts anything, and neither says the trend has turned, because both simply report what three finished sessions looked like.
Our overview of candlestick patterns explained sets out that distinction across the whole family. Stars sit at the more demanding end, since they need three bars and a prior move before they count at all.
The Three-Bar Skeleton They Share
Both patterns run the same sequence: push, pause, takeover. Read those three beats in order and the shape identifies itself.
Timeframe changes nothing about the structure. A star on a five-minute chart and a star on a weekly chart share identical geometry, though they carry very different weight.
Nothing in the skeleton mentions indicators, volume or anything beyond price. Three closes and three ranges hold the entire pattern, which explains both its appeal and its limits.
Bar One: The Push
The first bar continues whatever came before. In a morning star it prints a large bearish body, ideally closing near its low with little lower wick.
Size matters here. A small first bar weakens the whole pattern, because a pause after nothing much says nothing much.
The evening star mirrors this exactly. Its first bar prints a large bullish body closing near its high, which shows buyers finishing the session firmly in control.
Bar Two: The Pause
The middle bar carries the meaning. A small body, of either colour, shows the push running out of participants.
Traditional definitions ask that this bar gap away from the first body. That requirement comes from stock markets, which close overnight and reopen at a new price.
A doji in this slot creates the variant most books call a morning doji star. Open and close finish effectively equal, so the body shrinks to a line and the indecision reads even more clearly.
Bar Three: The Takeover
The third bar completes the story. It prints a strong body in the opposite direction to the first bar, and it closes well inside that first body.
Most traders ask for a close past the midpoint of bar one. That convention gives you a testable rule, which beats arguing about whether a shape looks convincing.
Deeper closes read better. A third bar that closes beyond the whole first body shows a far more complete takeover than one that scrapes past the halfway mark.
How Big Is Too Big for the Pause
No rulebook fixes the middle bar’s size, which frustrates newcomers. Most traders use a simple ratio and ask that the pause body measure under a third of the first body.
Anything larger stops describing hesitation. Two similar bodies in a row look more like a stall inside an ongoing move than a genuine handover between the two sides.
So pick a ratio and record it. Because the shape sits on a spectrum rather than in two boxes, a written threshold keeps your own records comparable over time.
Why the Third Bar Carries the Most Weight
The first two bars only set the scene. Selling ran, then selling paused, and neither of those events tells you that anyone stepped in on the other side.
Bar three supplies the evidence. A strong close deep inside the first body shows buyers taking back ground in a single session, which is the only genuinely new information in the pattern.
Judge the shape by that bar, then. A perfect first two bars followed by a weak third close describes a pause, not a takeover.
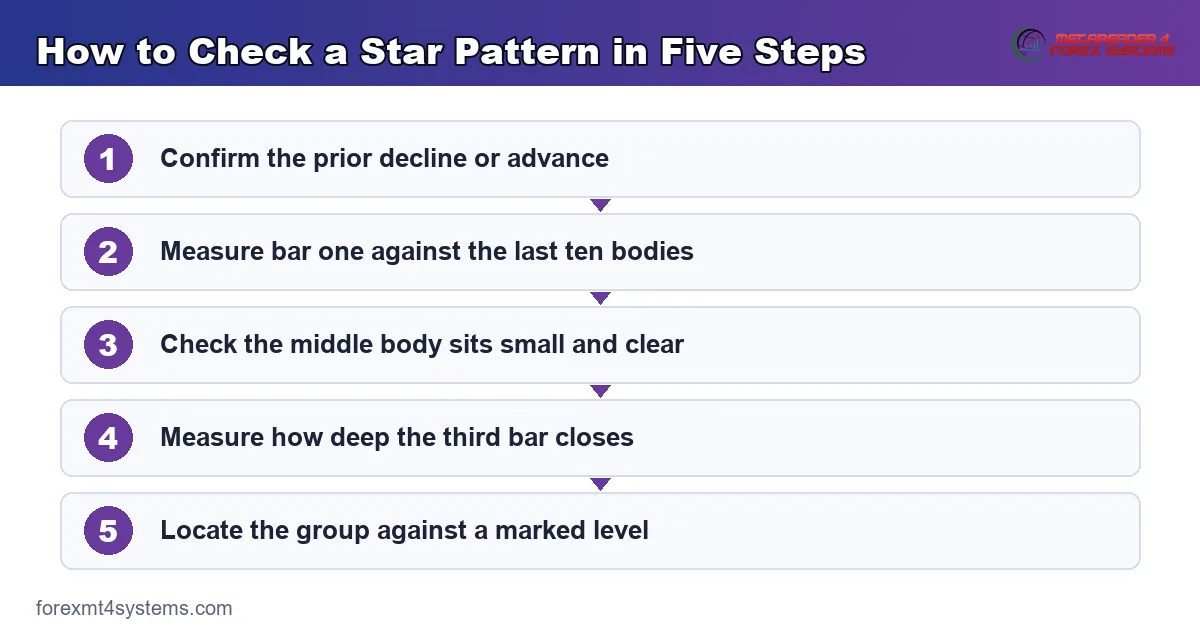
Checking a Star in Five Steps
Run this short routine whenever a candidate appears. Five checks separate a genuine star from three bars that happen to sit near each other.
- Confirm the prior move. A morning star needs a decline into it, and an evening star needs an advance. No prior move, no pattern.
- Measure the first body. It should stand out against the last ten bodies rather than blend into them.
- Check the middle body. Small relative to bar one, colour irrelevant, and ideally sitting clear of the first body’s range.
- Measure the third close. Past the midpoint of the first body as a minimum, and deeper reads stronger.
- Locate the whole thing. Note whether the three bars sit at a level you marked earlier or drift in open space.
That last check decides most outcomes. A textbook star in the middle of a range describes a small pause, while an ordinary star at a swing high describes a fight somebody lost.
What Continuous Forex Changes About the Gap
Textbook stars gap. Spot forex trades continuously from Sunday evening to Friday evening, so the classic gap almost never appears on a major pair.
Pretending otherwise causes real confusion. Traders reject valid shapes because the middle bar touches the first body, when the gap requirement simply does not translate.
Where Gaps Still Show Up
The weekend break produces the one regular forex gap. Price closes Friday and reopens Sunday, and a sharp weekend headline can leave a visible hole on the daily chart.
Gapping instruments behave differently again. Index CFDs, single stocks and futures with a session break gap routinely, so a textbook star with a clean gap turns up far more often there.
Our note on the kicker candlestick pattern covers the same translation problem in more detail. Any pattern built on a gap needs rewriting before you apply it to continuous markets.
Why the Weekend Gap Needs Caution
A Sunday gap looks dramatic on a daily chart. Yet the opening hours run on thin liquidity and wide spreads, so the printed prices often overstate what actually traded.
Many pairs then close the gap during Monday. That habit turns a textbook star built on a weekend hole into a shape that unwinds before London opens.
Treat weekend structure as provisional, then. Waiting for the first full session before you act removes most of the noise at almost no cost.
The Continuous-Market Version
Drop the gap and keep the logic. What the gap represented was a break in participation, and a small body sitting clear of the first body’s midpoint achieves the same reading.
So use body separation rather than price separation. Ask whether the middle body sits entirely beyond the first body’s close, not whether empty space appears between the bars.
Write your version down once. Because scanners and books disagree here, an unwritten rule turns into a moving target the moment a marginal case appears.
A Worked Example of Each Side of the Mirror
Picture a pair selling off for six sessions into a weekly low you marked last month. Bar one extends the decline with a wide bearish body closing near its low.
Bar two opens near that close and prints a tiny body with wicks either side. Neither side gained ground, so the selling has clearly slowed.
Bar three opens quietly, then runs, closing above the midpoint of bar one. That reads as a morning star at a level that already mattered.
The Evening Star at a Prior High
Flip every word above and you get the other case. A rally runs into a swing high from three weeks ago, and bar one prints a wide bullish body closing near its top.
Then the pause arrives. Bar two prints a small body just above that close, showing buyers unable to extend the move any further.
Bar three settles it, opening lower and closing back inside the first body. Sellers took the session, and they did it exactly where sellers appeared last time.
Why the Level Does the Work
Strip the level out of either example and both patterns lose most of their weight. Three bars in open space describe a pause that nobody defended.
Our guide to multi-timeframe analysis covers how to find levels that carry weight. Marking them on a higher timeframe first keeps the count small and the quality high.
What the Following Two Bars Decided
Confirmation matters more than the shape. Watch whether the bar after the star holds above the third bar’s close, and whether it extends the move at all.
A fourth bar that closes back inside the pattern range changes everything. Buyers failed to build on the takeover, so the star describes a pause after all.
Set that rule before the trade. Deciding afterwards turns every ambiguous case into a negotiation with yourself, and those negotiations rarely end well.
Download the complete indicator database
Put these concepts on your charts. One email unlocks the full library of 1,380+ indicators with compiled MT4 and MT5 files, plus my TradingView scripts. No paywall, no spam, unsubscribe any time.
Get free access to my indicator database
One email unlocks 1,380+ free MT4, MT5 and TradingView indicators — the complete library. No single-tool download; you get the whole database.
How to Trade Around a Star Without Guessing
The pattern gives you a location and a rough boundary. It gives you no target, no size and no promise, so the rest of the plan has to come from you.
Three decisions cover the practical work. Settle all three before the third bar closes rather than afterwards.
Entry After the Third Close
Wait for bar three to finish. A forming third bar can look decisive an hour before the close and finish as a small doji, which changes the pattern entirely.
Some traders enter on the close itself, while others wait for the next bar to take out the third bar’s extreme. Both conventions have supporters, and neither removes the need for a stop.
Stop Beyond the Pattern Extreme
Place the stop past the low of the whole three-bar group for a morning star, and past the high for an evening star. That point marks where your reading stops making sense.
Then work the size backwards from that distance. Our free position size calculator turns the stop distance and your risk figure into a lot size in one step.
Wide stars therefore get smaller positions. That feels unfair when the setup looks dramatic, yet it keeps every star trade on the same footing.
Targets From Structure, Not From the Pattern
Star patterns carry no measured objective. So take targets from the next opposing level, from a prior swing, or from a multiple of the recent average range.
Because the pattern says nothing about distance, any target you invent from the candles alone rests on nothing. Structure at least reflects places where traders reacted before.
What Actually Invalidates the Read
Name the price that ends your argument before you click anything. For a morning star that price sits below the lowest low of the three bars, since a close beyond it removes the rejection entirely.
Keep that number separate from your stop. The stop protects capital, while the invalidation level tells you the reasoning has failed, and the two often trigger at slightly different points.
Traders who write both numbers down argue with themselves far less. One line covers the money, and the other covers the idea.
Common Mistakes With Star Patterns
Six habits account for most star-related frustration. The comparison panel below puts the two sides of the mirror next to each other for quick reference.

Calling It a Star With No Prior Move
Three bars in a sideways range form the shape constantly. Without a decline or an advance leading in, the pattern has nothing to reverse, so it means nothing at all.
Accepting a Weak First Bar
A small first body drains the whole sequence of meaning. Compare it against the last ten bodies, and drop the setup when it fails to stand out.
Demanding a Gap on a Forex Chart
Spot pairs rarely gap, so a strict gap rule discards almost every valid shape. Translate the requirement into body separation instead of abandoning the pattern.
Trading the Shape in Open Space
A star drifting in the middle of a range describes a pause and nothing more. Mark your levels first, then only take the stars that land on one.
Front-Running the Third Bar
Traders enter halfway through bar three because the move looks obvious. That bar often closes somewhere very different, and the resulting position sits against a pattern that never completed.
Reading Stars on Very Low Timeframes
Three-bar shapes appear every few minutes on a one-minute chart. Spread and thin liquidity produce most of them, so stick to timeframes where your levels genuinely live.
Mixing Up Which Side of the Mirror You Hold
Under pressure traders flip the names and take the wrong direction. Say the prior move out loud before you act, because that one word settles which pattern sits in front of you.
Hunting Stars Backwards Through History
Scroll back and every major turn shows a star somewhere near it. The same shapes also litter places nothing happened, so review your charts forwards rather than reasoning backwards from outcomes.
Star Pattern Quick Reference
Keep this table beside your chart while the two names settle in your head. Every row mirrors exactly, which is the whole point of the comparison.
| Feature | Morning star | Evening star |
|---|---|---|
| Prior move required | A decline into the pattern | An advance into the pattern |
| Bar one | Large bearish body, close near the low | Large bullish body, close near the high |
| Bar two | Small body below the first close, colour irrelevant | Small body above the first close, colour irrelevant |
| Bar three | Strong bullish close past the first midpoint | Strong bearish close past the first midpoint |
| Best location | A support band or prior swing low | A resistance band or prior swing high |
| Stop reference | Below the lowest low of the three bars | Above the highest high of the three bars |
| Doji variant name | Morning doji star | Evening doji star |
Print it once and the vocabulary stops slowing you down. Because the mirror holds on every row, you only ever learn the table once.
When a Star Does Not Follow Through
Both patterns fail regularly, and the failure has a recognisable shape. Price completes the three bars, stalls instead of following through, then works its way back to the pattern extreme.
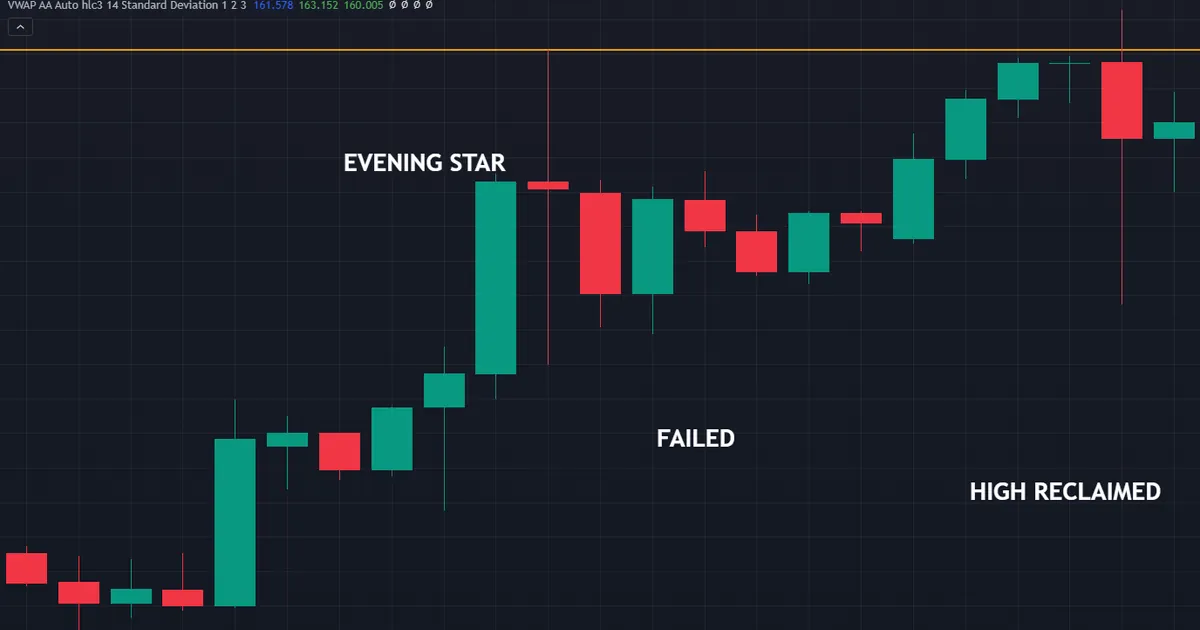
So treat that recovery as your exit signal. The reason for the trade has gone, and waiting for the stop simply costs you the difference.
Failure Against a Strong Trend
Counter-trend stars fail more often, as most experienced traders will tell you from their own records. A single three-bar shape rarely stops a move that has run for weeks.
Failure at a Level Nobody Defends
Levels differ in quality. A line drawn from one brief touch attracts far less defence than a swing that produced two sharp reactions, so the same star carries less weight there.
Failure From a Shallow Third Close
A third bar that barely clears the midpoint leaves the first bar’s sellers or buyers mostly intact. Deeper closes describe a fuller takeover, which is why the depth rule exists at all.
Failure Because the Pattern Was Late
Stars complete three bars after the move began. On slower timeframes that delay can hand back a large slice of the available distance, so the entry sometimes arrives at a poor location even when the reading holds.
How to Leave a Failed Star Cleanly
Decide the exit rule while the pattern still looks good. A close beyond the group extreme ends the argument, so leave on that close rather than hoping the stop rescues the position.
Then record the case. A folder of failed stars teaches you more about your own level selection than any run of winners, since the failures cluster around the levels you should not have used.
Related Patterns to Read Next
Two neighbouring guides finish the picture. Each takes the topic somewhere a single comparison cannot.
Start with our detailed note on the morning star pattern for the bullish side in full. Then read do candlestick patterns work for an honest look at what testing has shown about shapes like these.
If you want the shapes flagged automatically while you learn, browse our candlestick indicators and reversal indicators. Use them as a scanner rather than a decision maker, since the location work still belongs to you.
FAQ
What is the difference between a morning star and an evening star
Only the prior move. A morning star follows a decline and ends with a strong bullish close, while an evening star follows an advance and ends with a strong bearish close. Every other feature mirrors exactly, including the small middle bar and the depth rule for the third close.
Does a star pattern need a gap in forex
No, and demanding one discards almost every valid shape. Spot forex trades continuously, so gaps appear mainly at the Sunday open. Translate the requirement into body separation instead: ask whether the middle body sits clear of the first body’s close.
How deep should the third bar close
Past the midpoint of the first body as a minimum. Deeper closes describe a fuller takeover, and a bar that closes beyond the entire first body reads strongest of all. Write your threshold down so marginal cases never turn into an argument with yourself.
Which timeframe suits star patterns best
Traders commonly favour the four-hour and daily charts, mainly because each bar contains more trading activity and fewer shapes appear. That preference reflects convention and experience rather than a measured rule, so test it against your own records before adopting it.
How often do star patterns appear on a daily chart
Strict definitions produce only a handful per pair each year, while loose definitions produce dozens. That range explains most disagreements about the pattern: two traders scanning the same chart with different thresholds see completely different numbers of setups.
What does the colour of the middle bar mean
Very little. The middle bar signals a pause, so its size matters far more than its direction. Traditional definitions accept either colour, and a doji in that slot simply produces the morning or evening doji star variant.
Can I trade a star pattern on its own
You can, though most traders find the results thin once spread and swap come out. Stars work better as timing inside a plan that already marks levels, checks the higher timeframe and fixes risk in advance. Results are not guaranteed; past performance is not indicative of future results.
External references
- For background on this concept, see Morning Star Candlestick Pattern on Wikipedia.
- For broader market context, see Evening Star at BabyPips Forexpedia.

About the author
Written by Dominic Walsh, a Forex trader and MT4/MT5 indicator, Expert Advisor and script developer. Every tool on forexmt4systems.com is tested on live charts before release and ships with ready-to-use compiled MT4 (.ex4) and MT5 (.ex5) files. Learn more about the trader and developer behind this site.
How we build, test and correct every tool: Editorial & Testing Policy. Trading carries risk; see the disclaimer.