
You want candlestick patterns explained without the usual promises, so start with what a single bar really holds. Each candle packs four prices into one shape, and that shape shows who controlled the session that just closed.
A candle records history. It never forecasts, so the useful question runs the other way: where did this shape appear, and what happened next.
This guide works upward from that idea. Anatomy first, then the three families every named pattern belongs to, then the short process that turns a shape into a decision you can defend.
Candlestick Patterns Explained From the Bar Upward
Every pattern in every book rests on the same four numbers. Open, high, low and close describe the whole session, and nothing else goes into the drawing.
Learn those four numbers properly and the named shapes almost fall out on their own. Skip them, and you memorise pictures you cannot apply when the market looks slightly different.
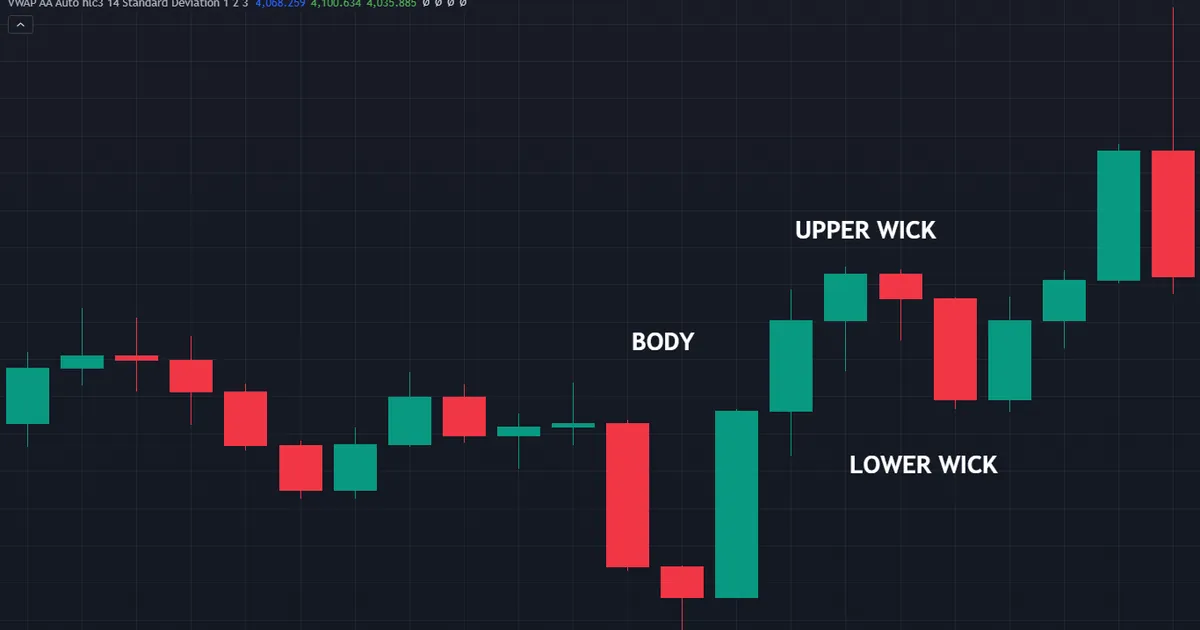
So treat the names as shorthand. A hammer, a doji or an engulfing bar simply labels a common arrangement of open, high, low and close.
Notice what a candle leaves out as well. It shows no order flow, no volume on spot forex, and no clue about who traded, so the shape carries far less information than the confident language around it suggests.
What the Four Prices Mean Together
The open marks where the session started. The close marks where it finished, and the gap between them shows the net result of everything traded in between.
High and low mark the extremes price reached along the way. Together they define the range, which measures how far the market travelled rather than where it settled.
So a candle answers two questions at once. It reports the net move through the body, and the attempted moves through the wicks, and the two often disagree sharply.
Why the Names Come Second
Traders argue endlessly about whether a given bar qualifies as a textbook hammer. That argument misses the point, because the long wick told you about rejection whether or not the label fits neatly.
Read the story first, then reach for the name. Because the story travels across markets and timeframes, while a strict label often does not.
Charting software makes this worse, not better. Automatic pattern scanners apply one fixed definition, so they flag bars you would ignore and skip bars you would trade.
The Anatomy of a Single Candle
Two parts make up every candle. The body spans open to close, and the wicks run from the body out to the high and the low.
Traders also call the wicks shadows or tails. All three words mean the same thing, so pick one and stay consistent in your notes.
The Body Shows the Net Result
A bullish body closes above its open. A bearish body closes below, and most platforms colour the two differently so you can scan a chart quickly.
Body length carries the message. A long body says one side pushed price a long way and held the gain into the close.
Short bodies say the opposite. Buyers and sellers finished the session roughly level, so the bar reports a stalemate rather than a decision.
Colour alone misleads plenty of beginners. A green bar with a tiny body and a huge upper wick describes a failed push, even though the platform paints it in the friendly colour.
The Wicks Show What Got Rejected
A wick marks ground price visited and then gave back. So a long lower wick means sellers pushed down, failed to hold, and watched buyers drag the close back up.
Ratios matter more than raw length. Compare the wick against the body of the same bar, and against the average range of the last twenty bars.
Our guide to candlestick wicks meaning goes deeper on those ratios. Wicks carry most of the information in single-bar patterns, so the detail repays the reading time.
One caution belongs here. Spread widens at rollover and around news, and your platform draws that widening as extra wick, so unusual bars at odd hours often reflect the feed rather than the market.
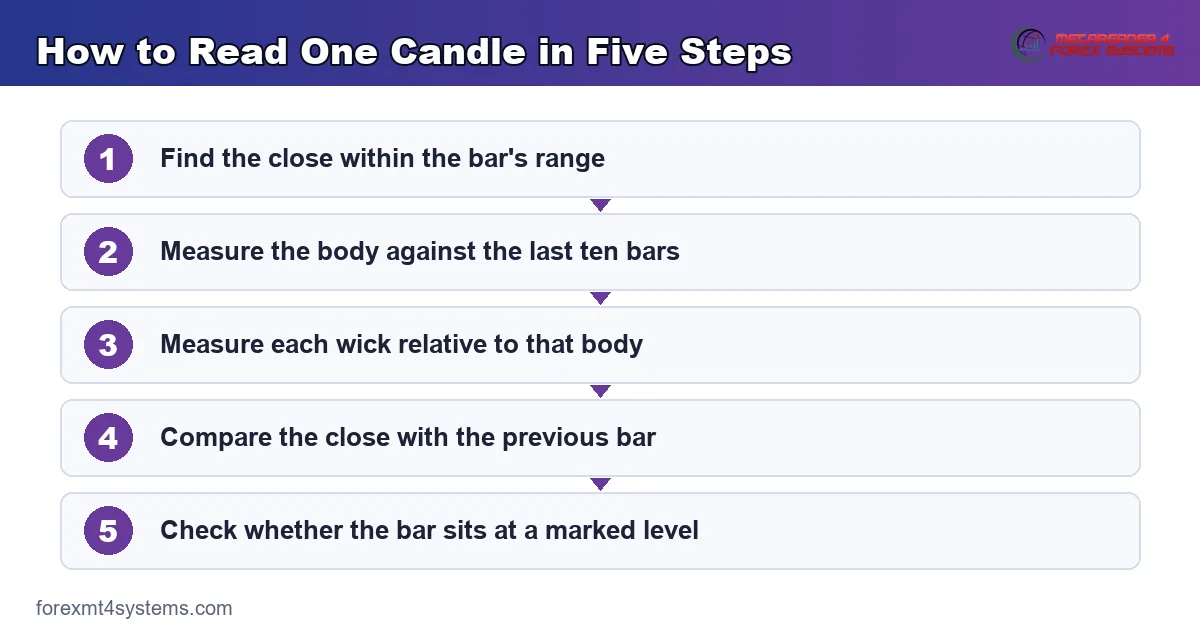
Reading One Candle in Five Steps
Run the same short routine on any bar that catches your eye. Five questions cover everything a single candle can tell you.
- Find the close relative to the range. Near the high, near the low, or somewhere in the middle.
- Measure the body. Compare it against the bodies of the last ten bars rather than judging it alone.
- Measure each wick. Note which side of the bar shows rejection, and by how much relative to the body.
- Compare with the previous bar. Did the close finish above or below that bar’s close, and did the range expand.
- Check the location. Mark whether the bar sits at a level you drew earlier, or in open space.
That last step decides most outcomes. A textbook shape in open space rarely leads anywhere useful, while an ordinary bar at a level you already respected often does.
Where Candlestick Charting Came From
The technique grew out of Japanese rice trading, and traders usually associate its origins with Munehisa Homma in the eighteenth century. Steve Nison brought the method to Western traders in the early 1990s, and the vocabulary in use today largely follows his books.
Treat the history as background rather than proof. Much of the Homma legend rests on stories retold long afterwards, so a pattern deserves no extra credit simply because someone traded rice with it.
Still, the origin explains the language. Names like harami and marubozu survive untranslated, which is why the vocabulary feels stranger than the ideas behind it.
How the Pattern Families Group
Hundreds of named patterns exist, yet they sort into three small families. Count the bars involved and you have placed almost any pattern instantly.
So learn the families rather than the catalogue. Each family answers a slightly different question about who holds control.
Single-Bar Patterns
One bar, one story. Hammers, hanging men, inverted hammers, shooting stars, doji and marubozu all sit here.
These shapes hinge on the balance between body and wick. A long rejection wick with a small body at the other end of the range forms the core of the group.
Location separates them. The same shape after a decline carries a different name from the shape after an advance, which our note on the hanging man candlestick works through in detail.
Two-Bar Patterns
Two bars let you compare. Engulfing patterns, harami, piercing lines, dark cloud cover, tweezers and inside bars all belong to this family.
The question here concerns takeover. Did the second bar reverse the first bar’s work, contain it quietly, or simply repeat the same high or low.
Traditional definitions compare the bodies, not the wicks. State which version you use before you test anything, because the two versions flag different bars.
Three-Bar Patterns
Three bars describe a sequence: push, pause, reverse. Morning stars, evening stars, three white soldiers and three black crows live in this group.
The middle bar carries the meaning. A small body wedged between two large opposite bodies shows momentum stalling before the other side takes over.
Our comparison of morning star vs evening star covers the mirror logic. Both sides of that mirror share one skeleton, so learning one teaches you the other.
Three-bar shapes take longer to complete, which cuts both ways. You get more evidence, yet the move often runs some distance before the third bar closes.
How to File a Pattern You Have Never Seen
New names appear constantly, and most of them rebrand something older. Run three quick questions and you can file almost any of them without looking it up.
First, count the bars. Second, ask whether the definition compares bodies or wicks. Third, ask what prior move the pattern requires before it counts.
Those three answers place the shape inside a family you already understand. After that, the only remaining work involves testing whether the extra name adds anything your existing rules miss.
Reversal Patterns Versus Continuation Patterns
Books split patterns a second way, by what they supposedly do next. That split helps as a filing system, provided you hold it loosely.
Neither group promises anything. Both simply describe a change in the balance of pressure during one short window.
What a Reversal Shape Actually Claims
A reversal shape says the prior direction met resistance during that session. It does not say the trend has turned, and it never sets a target.
So treat it as evidence, weighed against everything else on the chart. Evidence at a level you drew last week counts for far more than evidence in the middle of a range.
Continuation and the Quiet Pause
Continuation shapes describe a rest. Inside bars, small harami and short-bodied pauses inside a strong move all show a market catching breath.
Because contraction tends to precede expansion, these shapes attract breakout traders. Yet the direction of the break stays open until price actually moves, so the pause alone decides nothing.
A Worked Example of Candles in Context
Picture a pair grinding lower into a support line you marked earlier. Price reaches the line, prints a bar with a long lower wick, and closes near its high.
Now the shape means something. Sellers reached the level, failed to hold the low, and buyers finished the session in charge exactly where you expected a fight.

Notice how much of that came from the level rather than the candle. Without the line, the same bar would sit in open space and tell you almost nothing.
What the Next Two Bars Decide
Confirmation matters more than the pattern. Watch whether the following bar closes above the rejection bar’s high, and whether it holds that ground into its own close.
A second bar that closes back below the low changes the reading completely. Buyers failed to build on the rejection, so the level looks weaker than it did an hour earlier.
So write your confirmation rule down before the bar prints. Deciding afterwards turns every ambiguous case into an argument with yourself, and that argument usually ends badly.
The Same Bar in Open Space
Move the identical shape to the middle of a quiet range and the reading collapses. Nobody defended anything, so the rejection wick reflects noise rather than a decision.
Our guide to candlestick patterns at support and resistance builds a whole method around that contrast. Location does the heavy lifting, and the candle refines the timing.
Download the complete indicator database
Put these concepts on your charts. One email unlocks the full library of 1,380+ indicators with compiled MT4 and MT5 files, plus my TradingView scripts. No paywall, no spam, unsubscribe any time.
Get free access to my indicator database
One email unlocks 1,380+ free MT4, MT5 and TradingView indicators — the complete library. No single-tool download; you get the whole database.
How to Use Candlestick Patterns Inside a Process
A pattern on its own gives you no plan. Slot it into a short sequence and it starts earning its place.
Three steps cover the practical work. Each one runs before you consider any entry.
Step One: Draw the Levels First
Mark your levels before you look for shapes. Prior swing highs and lows, session extremes and clear ranges all qualify, and our note on support and resistance covers the marking rules.
Then let the candles come to you. Waiting for a shape at a level filters out most of the noise that clutters a chart.
Keep the level count small as well. Four or five lines on a chart force you to choose the areas that genuinely produced reactions, while twenty lines make sure a candle always lands near one of them.
Step Two: Wait for the Close
A forming bar lies. A hammer at the midpoint of the session can finish as a plain bearish bar an hour later, so the shape only counts once the bar closes.
Patience costs you a few pips at worst. Acting early costs you the whole reason you waited for a pattern in the first place.
This single habit changes more results than any pattern you learn. Traders who act on forming bars end up trading a shape that never existed once the session finished.
Step Three: Size From the Structure
Place the stop beyond the wick that defines the pattern, then work the position size backwards from that distance. Our free risk reward calculator turns those two numbers into a plan in seconds.
Because wick length varies wildly, a fixed lot size makes no sense here. Let the bar dictate the size rather than the other way round.
A long wick therefore costs you position size, not risk. That trade-off feels wrong at first, yet it keeps every candle setup on the same footing regardless of how dramatic it looks.
Common Mistakes When Reading Candles
Five habits account for most of the frustration traders report with candles. The comparison panel below sets the two readings of the same shape side by side.

Treating the Shape as a Signal
A shape describes the past. So build the decision from level, trend and follow-through, and let the candle refine your timing rather than trigger the trade.
Ignoring the Bars Around It
One bar out of context tells you very little. Read the three or four bars before it, since a rejection after a long push means something quite different from a rejection after a quiet drift.
Hunting Patterns on Every Timeframe
Drop to a one-minute chart and shapes appear constantly. Most of them reflect spread and thin liquidity, so stick to the timeframes where your levels actually live.
Forcing the Definition
Traders stretch a definition until any bar qualifies. Write your own numeric rule instead, such as a lower wick at least twice the body, and hold yourself to it.
Skipping the Failure Cases
Most people only remember the patterns that worked. Log every occurrence in a journal, including the ones that went nowhere, and the picture changes quickly.
Reading the Pattern After the Move
Scroll back far enough and every big move shows a pattern at the turn. Yet the same shapes litter the chart at places nothing happened, so scroll forward through history instead of hunting backwards from outcomes.
Letting the Pattern Set the Target
Candlestick shapes carry no measured objective, unlike some chart patterns. So take your targets from structure, from the next level or from a multiple of recent range, and leave the candle to handle entry alone.
Candlestick Quick Reference
Keep this table beside your chart while the vocabulary settles. Six lines cover the shapes you will meet most often.
| Shape | Bars | Geometry in one line | What it describes |
|---|---|---|---|
| Hammer | 1 | Small body at the top, long lower wick, after a decline | Sellers pushed down and lost the ground back |
| Hanging man | 1 | Identical shape, but after an advance | Selling appeared inside a rising market |
| Doji | 1 | Open and close effectively equal, so the body is a line | Indecision, nothing more |
| Engulfing | 2 | Second body completely covers the previous body | One side took over the session |
| Harami | 2 | Small second body sits inside the previous large body | Momentum contracted sharply |
| Morning star | 3 | Large bearish bar, small pause bar, strong bullish close | A push stalled, then reversed |
Print it once and stop looking up definitions. Because the geometry never changes, one reference sheet lasts you for years.
When a Clean Pattern Fails
Every shape on that table fails regularly. Accepting that up front saves a great deal of confusion later.
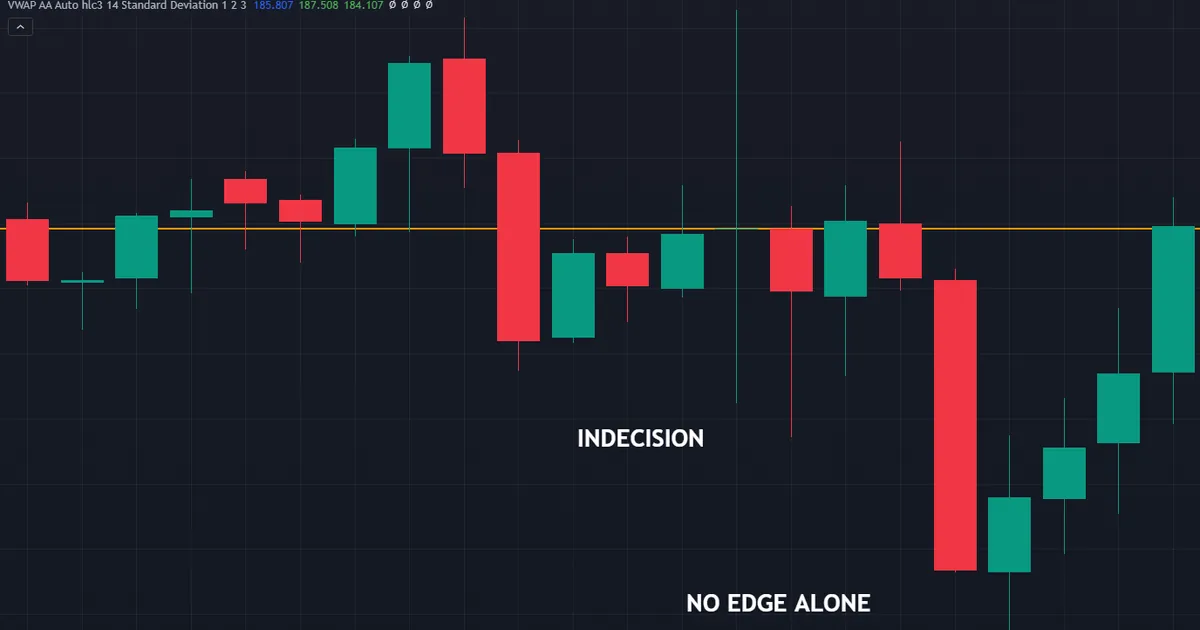
Watch what a failure looks like. Price prints the pattern, drifts for a bar or two, then swings the other way and ends up back where it started.
Failure at a Weak Level
Levels differ in quality. A band touched once last month attracts far less defence than a swing high that produced two sharp reactions, so the same candle carries less weight there.
Failure Against the Larger Trend
Counter-trend shapes fail more often, which most experienced traders will tell you from their own logs. Check the higher timeframe before you fade a strong move on the strength of one bar.
Failure Because the Market Was Thin
Rollover, holidays and the hours between sessions produce strange bars. Wide spreads exaggerate wicks, so a dramatic shape in a quiet hour deserves scepticism rather than excitement.
Failure After a Long Extension
Markets that have run a long way produce reversal shapes constantly. Most of them mark a pause inside the move rather than its end, so a single bar against a strong trend rarely deserves a full position.
How to Handle a Failure Without Damage
Plan the exit before the entry. When price closes back through the defining wick, the reason for the trade has gone, so leave rather than waiting for the stop to do it for you.
Then log the case. A folder of failed patterns teaches you more about your own filters than a folder of winners ever will.
Related Guides to Read Next
Three neighbouring guides finish this picture. Each one takes a piece of the topic further than a single overview can.
Start with the evidence in do candlestick patterns work, which reviews what testing has actually shown. Then browse our candlestick indicators and pattern recognition indicators if you want the shapes marked automatically while you learn.
Above all, keep the order right. Levels first, candles second, and a written rule for size before either of them.
Then give the vocabulary time. Reading candles well takes a few hundred logged examples, not a weekend with a cheat sheet, and the logging does most of the teaching.
FAQ
What do candlestick patterns actually tell you
They describe how one or more finished sessions unfolded, using open, high, low and close. A long lower wick tells you sellers lost ground they had taken. Nothing in the shape forecasts the next bar, so context and follow-through decide whether the description matters.
How many candlestick patterns should a beginner learn
Roughly six, chosen from the three families. A hammer, a doji, an engulfing bar, a harami, an inside bar and a star pattern cover most of what you will see. Learn the geometry properly rather than collecting fifty names you cannot apply.
Do candlestick patterns work better on some timeframes
Higher timeframes produce fewer shapes and cleaner ones, mainly because each bar holds more trading activity. Traders commonly favour the four-hour and daily charts for this reason. That preference reflects convention and experience rather than a measured rule.
Should I use the body or the wick to define a pattern
Traditional definitions use the body for engulfing and harami, and the wick for hammers and shooting stars. Pick one convention, write it down as a numeric rule, and apply it consistently. Mixing conventions makes your own records impossible to compare.
Where did candlestick charting come from
The technique grew out of Japanese rice trading, and traders often associate it with Munehisa Homma. Steve Nison introduced the method to Western traders in the early 1990s. Much of the Homma story remains unverified, so treat the history as background rather than evidence.
Can I trade using candlestick patterns alone
You can, though most traders find the results thin once spread and swap come out. Patterns work better as a timing and location tool inside a wider plan that already defines levels, trend and risk. Results are not guaranteed; past performance is not indicative of future results.
External references
- For background on this concept, see Marubozu at BabyPips Forexpedia.
- For broader market context, see Continuation Pattern at Investopedia.

About the author
Written by Dominic Walsh, a Forex trader and MT4/MT5 indicator, Expert Advisor and script developer. Every tool on forexmt4systems.com is tested on live charts before release and ships with ready-to-use compiled MT4 (.ex4) and MT5 (.ex5) files. Learn more about the trader and developer behind this site.
How we build, test and correct every tool: Editorial & Testing Policy. Trading carries risk; see the disclaimer.