
The best RSI settings for day trading are not a single magic number, and any guide that promises one is selling you a shortcut. The Relative Strength Index (RSI) is flexible, so the right length and bands depend on your pair, your timeframe, and how many signals you can stomach.
This guide walks you through the real choices. So by the end, you will know when RSI(14) still works, when a shorter length helps, and how the 80/20 and 70/30 bands change what the tool tells you on a fast intraday chart.
Best RSI Settings for Day Trading, Explained
RSI is a momentum oscillator built by J. Welles Wilder in 1978. It measures the speed of recent gains against recent losses, then plots the result on a scale from 0 to 100. So a high reading means buyers have pushed hard, and a low reading means sellers have.
The default length is 14 periods. On a daily chart, that setting is calm and reliable. Drop it onto a five-minute chart, though, and the same 14-period line reacts far faster because each bar covers only five minutes of trade.
Look at a concrete reading first. The chart shows EURUSD on the five-minute timeframe during the London session. RSI(14) dips to around 28, tags the oversold band, and price bases just above a prior swing low near 1.0840 before turning up.
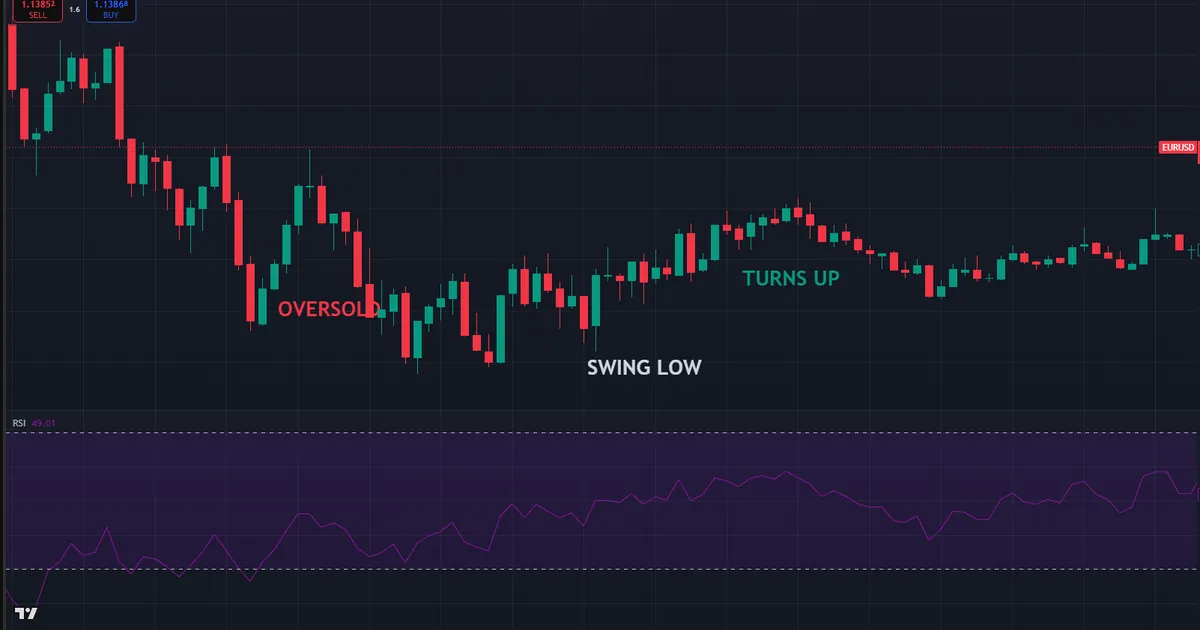
Now trace what that single reading tells you. First, momentum stretched to the downside. Then it stalled at an extreme. Because price also held a visible level, the oversold tag lined up with structure rather than firing in empty space. That overlap is the whole point, and it matters far more than the exact number you dialed in.
So the honest answer starts here. No setting removes false signals, and none suits every trader. Instead, you pick a length and a band pair that match your speed, then you test them on your own pairs before you risk anything.
How RSI Is Built and Why the Length Matters
Understanding the math makes the settings obvious. The calculation runs in a few clear steps, and each one shapes how the line behaves intraday.
- Measure each move. RSI splits recent bars into up-closes and down-closes over your chosen length.
- Average the two sides. It smooths the average gain and the average loss across that lookback window.
- Form the ratio. It divides average gain by average loss to get relative strength.
- Scale it 0 to 100. A final formula bounds the result, so 50 sits at the midpoint.
- Repeat every bar. The window rolls forward, so the newest bar always carries the most weight.
The length is simply that lookback window. So a shorter length watches fewer bars and swings faster. A longer length watches more bars and moves slower. That single trade-off drives every setting decision you will make.
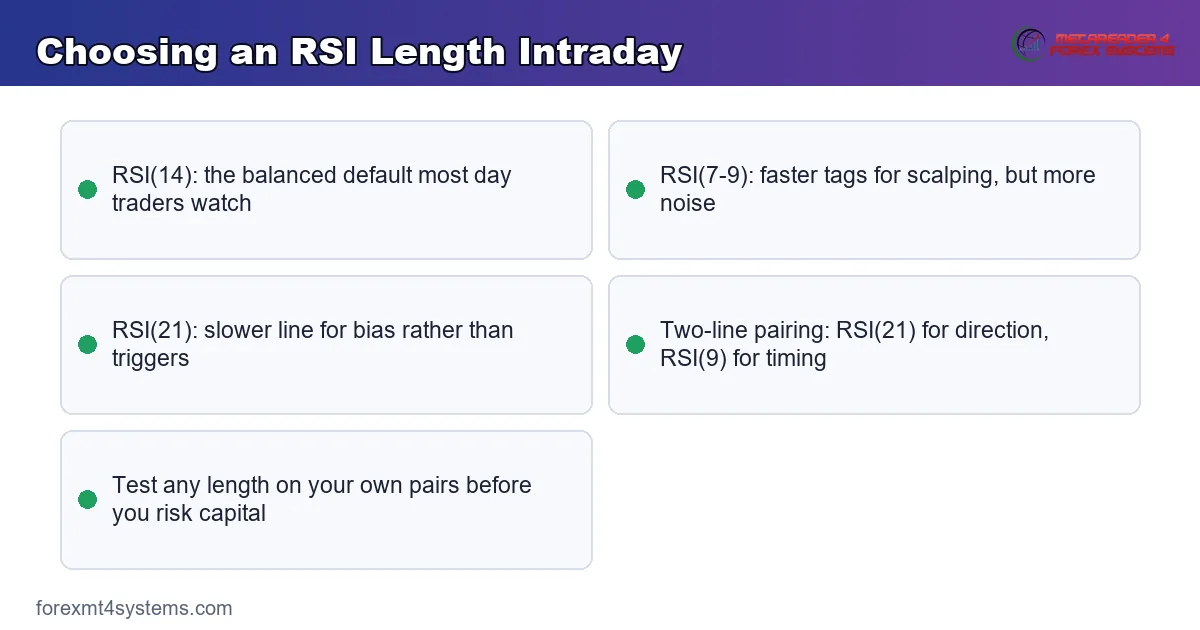
Here is the practical version. A short RSI, near 7 to 9, hugs price and prints many overbought and oversold tags. Meanwhile, a long RSI, near 21, filters noise but arrives late. The default 14 sits between the two, which is exactly why so many traders keep it.
Choosing an RSI Length for Intraday Charts
Match the length to your trading speed, not to a forum poll. Three broad options cover almost every day trader.
The Default RSI(14)
Start here before you change anything. RSI(14) is the setting every other trader watches, so its levels tend to matter simply because a crowd reacts to them. On the five and fifteen-minute charts, it gives a balanced flow of signals without drowning you in noise.
So treat 14 as your baseline. Then only shorten it if you can prove, on your own charts, that the faster line adds more good entries than bad ones.
A Shorter RSI for Scalping
Faster traders often drop the length to 7 or 9. This tighter window reacts sooner, so oversold tags appear earlier in a dip. That early read helps a scalper who needs to be in and out within a few candles.
Yet the cost is real. A shorter RSI whips back and forth, and many of its extreme tags lead nowhere. Because of that, a short length demands a strong filter, such as a trend rule or a key level, before you act on any signal.
A Longer RSI for Cleaner Bias
Some intraday traders push the length to 21 instead. This slower line ignores small wiggles and tracks the broader momentum of the session. So it works well as a bias tool rather than a trigger.
A common pairing runs two lines at once. One trader keeps RSI(21) for direction and RSI(9) for timing. When both agree, the signal carries more weight. When they clash, the trader simply stands aside and waits.
Reading the Bands: 70/30 Versus 80/20
The bands decide how strict your signals are. Two pairs dominate day trading, and each answers a different question.
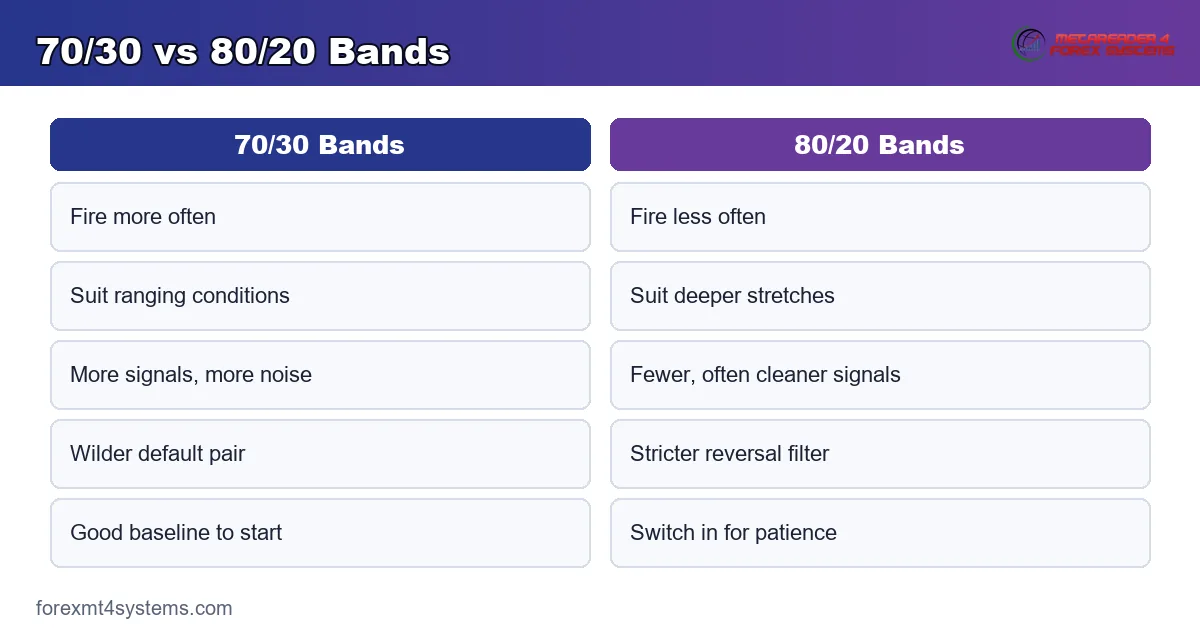
The classic 70/30 pair is the Wilder default. It marks overbought at 70 and oversold at 30, so it fires fairly often on a fast chart. That frequency suits traders who want more chances and accept more noise. In quiet, mean-reverting conditions, 70/30 tends to shine.
The tighter 80/20 pair demands a deeper stretch before it flags anything. So it prints fewer signals, and each one reflects a more exhausted move. Day traders who hunt only the cleanest reversals often prefer 80/20 for that reason. The trade-off is patience, because the line reaches 80 or 20 far less often.
There is a third idea worth knowing. In a strong trend, the oscillator behaves differently, and fixed bands mislead you. Andrew Cardwell, who studied RSI deeply, noted that an uptrend often holds RSI between roughly 40 and 80, while a downtrend holds it between 20 and 60. So in a clear trend, the 40 or 60 level can act as support or resistance for momentum itself.
Using the RSI Centerline at 50
The 50 line deserves more attention than it usually gets. It marks the midpoint of the oscillator, so it splits bullish momentum from bearish. In an uptrend, RSI tends to hold above 50 and bounce off it on pullbacks. In a downtrend, it tends to cap below 50 and reject there.
So the centerline gives you a fast bias read. When RSI trades above 50, buyers hold the recent edge. When it slips below, sellers take over. Day traders often treat a 50 cross as an early cue that momentum has shifted, well before price confirms it with structure.
Then combine the two ideas on one chart. A pullback that holds above 50 in an uptrend, followed by a shallow dip toward 40, often marks a clean continuation entry. Because the centerline and the band work together, the read gains weight when both point the same way.
RSI Divergence on Intraday Charts
Divergence ranks among the strongest RSI signals, and day traders lean on it often. It appears when price and the oscillator disagree about momentum. So the tool warns that a move is losing steam even while price still pushes on.
Regular divergence points toward a reversal. In a downtrend, price prints a lower low while RSI prints a higher low. That gap says selling momentum is fading, so a bounce may follow. In an uptrend, the mirror applies, since a higher high in price against a lower high in RSI warns of a top.
Hidden divergence points toward continuation instead. Here price makes a higher low while RSI makes a lower low inside an uptrend. So the pullback looks weak, and the trend is likely to resume. Traders use hidden divergence to time entries in the direction of the larger move.
Still, patience protects you. Divergence can persist for many bars before price finally turns, so treat it as a warning rather than a trigger. Then wait for a level break or a band reclaim to confirm the read before you commit.
Matching RSI Settings to Your Trading Style
No single configuration suits every trader, so match the tool to how you actually work. Three broad styles cover most intraday traders, and each leans on RSI in its own way.
A scalper on the one and five-minute charts often runs a short RSI near 7 to 9 with the 80/20 bands. So the line reacts fast, and the tighter bands filter the flood of tags. Speed matters most here, and every signal still needs a level behind it.
A standard day trader on the five and fifteen-minute charts usually keeps RSI(14) with 70/30 or 80/20. That balance gives a steady flow of signals without constant noise. Meanwhile, a slower intraday trader who holds for hours may prefer RSI(21) for a cleaner bias and fewer, higher-quality tags.
Adjusting RSI for the Pair You Trade
The pair matters as much as the timeframe. A calm major like EURUSD moves in smoother waves, so RSI(14) tags its bands cleanly. A jumpier pair, or a metal like gold, spikes harder, so the same setting fires more often and stretches to extremes faster.
So adapt the bands to the pair, not only to the clock. On a volatile instrument, the 80/20 bands filter the noise better than 70/30, since price reaches shallow extremes constantly. On a quiet pair, 70/30 may hand you enough signals without missing the moves.
Then test the choice before you commit real money. Load your setting on a demo or a replay, and count how the tags line up with real turns across a week. Because each pair carries its own rhythm, that small study saves you from forcing one setting onto a market it does not fit.
Where RSI Fits Your Day-Trading Workflow
RSI works best as one voice in a process, never as the whole decision. Slot it into a simple top-down routine, and its signals sharpen at once.
First, set your bias on a higher timeframe. Read the fifteen or sixty-minute chart, and note whether price makes higher highs or lower lows. Our guide to the stochastic oscillator shows a similar momentum read you can cross-check against RSI.
Then drop to your entry chart, usually the five-minute during an active session. There you wait for RSI to tag your band in the direction of the higher-timeframe bias. So in an uptrend, you hunt oversold tags near 30 for longs, and you ignore overbought tags that fight the trend.
Also respect the clock. The cleanest intraday momentum tends to print inside the London window, 2:00 to 5:00 a.m. New York time, and the New York morning, 8:30 to 11:00 a.m. Momentum tools like momentum indicators and RSI indicators read most reliably when real volume is present.
Finally, size the trade before you click. A signal tells you the direction, not the risk. Our free position size calculator turns your stop distance into a lot size, so one loss never dents the account too hard.
Worked Example: An Intraday RSI Long
Walk through a full read on EURUSD, step by step. The higher-timeframe bias is up, since the sixty-minute chart prints a clean run of higher lows into the London open.
Now the setup builds on the five-minute chart. Price pulls back into a prior demand area, and RSI(14) slides to around 27. So both momentum and structure reach a stretch at the same moment, which is the alignment you wait for.
Then the trigger arrives. RSI curls back above 30, and price closes above the small swing high that capped the pullback. The chart below marks the oversold tag, the reclaim of 30, and the entry candle.
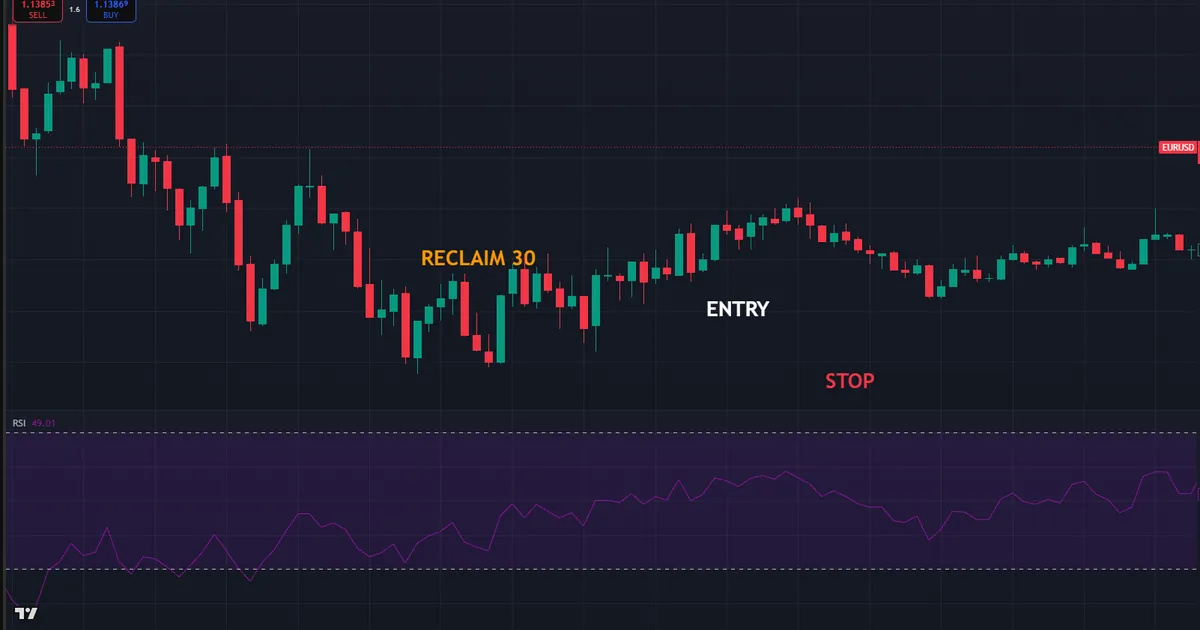
Here the trade defines itself. A long enters on that close, with a stop just below the pullback low, roughly 12 to 15 pips of risk. Meanwhile, the first target sits at the session high above, giving a reward that clears the risk comfortably. The plan never depended on the exact RSI number, only on the tag lining up with the level.
So notice the sequence, because it repeats. Bias first, then a band tag with structure, then a reclaim to trigger. Because that rhythm travels across pairs and sessions, learning it once pays off on every intraday chart you trade.
Download the complete indicator database
Put these concepts on your charts. One email unlocks the full library of 1,380+ indicators with compiled MT4 and MT5 files, plus my TradingView scripts. No paywall, no spam, unsubscribe any time.
Get free access to my indicator database
One email unlocks 1,380+ free MT4, MT5 and TradingView indicators — the complete library. No single-tool download; you get the whole database.
Common RSI Mistakes and How to Fix Them
The tool is simple, yet the same errors repeat across new day traders. The graphic below groups the traps, and the fixes follow beneath it.
Selling Every Overbought Tag
An overbought reading is not a sell signal on its own. In a strong uptrend, RSI can sit above 70 for a long stretch while price keeps climbing. So use the tag as a warning, then wait for a level or a momentum failure before you act against the trend.
Shortening the Length Too Far
A very short RSI, near 3 or 5, flips constantly and floods you with noise. Instead, keep the length at 7 or higher for day trading, and lean on 14 unless a shorter line clearly earns its place on your charts.
Ignoring the Higher Timeframe
A five-minute oversold tag against a firm downtrend usually marks a pause, not a bottom. Hence check the sixty-minute bias first, and trade band tags in the direction of that larger trend far more often than against it.
Treating RSI as a Standalone System
Momentum alone rarely pays. Truly, RSI shines only when it confirms a level, a trend, or a divergence. So pair it with structure or a moving average, and skip any tag that stands alone in empty space.
Chasing Divergence Blindly
Divergence is powerful, yet it can persist for many bars before price turns. Our guide to divergence in trading shows the regular and hidden types in detail. So wait for a trigger, such as a level break, before you trade any divergence you spot.
Pre-Trade RSI Checklist
Run this short list before every intraday entry. A few seconds here saves a stack of avoidable losses later.
- Higher-timeframe bias read on the fifteen or sixty-minute chart.
- RSI length matched to your speed, with 14 as the default baseline.
- Band pair chosen on purpose, either 70/30 for more signals or 80/20 for fewer.
- The band tag lined up with a real level or trend, not floating alone.
- A trigger present, such as a reclaim of the band or a small structure break.
- An active session open, London or New York, rather than dead hours.
- Stop, target, and position size set before the entry goes live.
When RSI Settings Fail
Study the failure case as hard as the winner. Here is the classic one for day traders who lean on RSI. Price grinds higher in a strong trend, RSI pushes above 70, and an eager trader shorts the overbought tag expecting a quick drop.
Then the move punishes that trade. Price barely pauses, RSI holds near 70, and the market grinds higher for another hour. The chart below shows that pinned oscillator and the losing short beneath it.
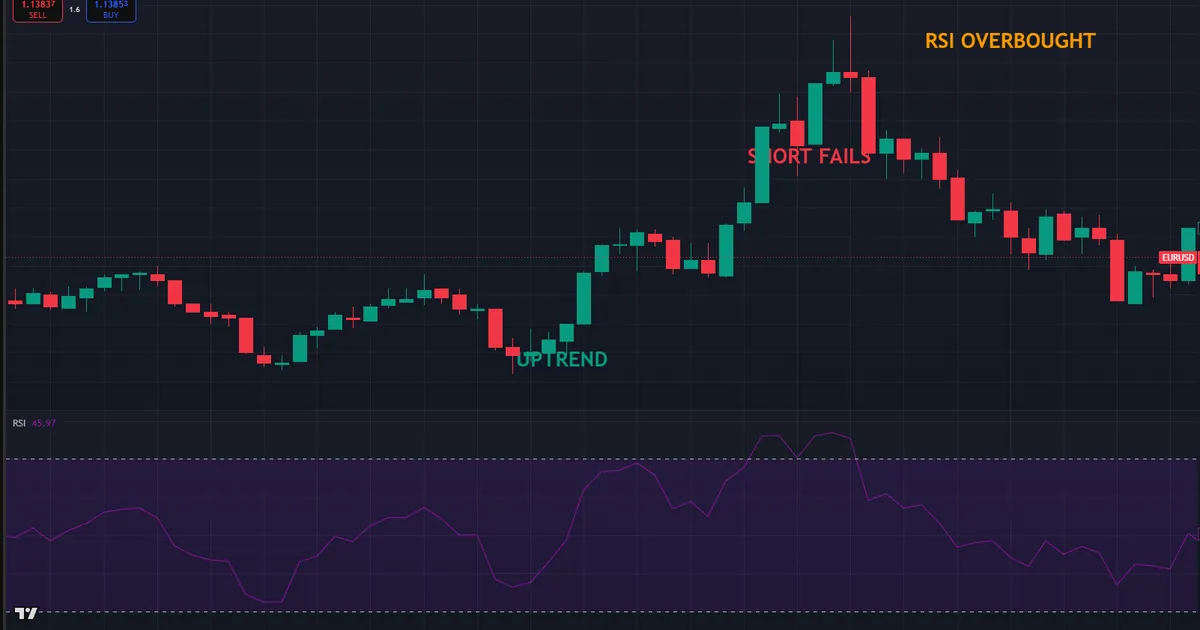
So what went wrong? The setting was fine, but the context was ignored. In a trending market, overbought is normal, and the fixed 70 line became a trap rather than a signal. Hence the fix that saves the account: in a clear trend, trade band tags only in the trend direction, and let the counter-trend tags pass.
Then log the trade while it stays fresh. Note the pair, the session, the RSI length, and whether the higher timeframe agreed with the entry. Review a few dozen of these, and a pattern appears. Our free trade journal makes that review quick, and it turns each loss into data rather than regret.
Ranging Days Blur the Bands
Be honest about the hardest condition. In a tight range, RSI tags both bands all session, and every signal dies within a few candles. So when the higher timeframe shows a sideways box, lower your size or stand down. RSI rewards clear momentum, and it punishes traders who force it inside chop.
Related Concepts to Study Next
RSI connects to a web of sibling tools, and a few deserve your next reading hour. The Williams %R oscillator reads momentum on an inverted scale and often confirms an RSI tag. Meanwhile, the stochastic and RSI together give a fuller momentum picture than either alone.
For hands-free reading, a well-built RSI indicator marks the tags and divergences for you in real time. Tools speed the work, yet the length and band choices above still carry the logic. So learn the settings first, then let software handle the watching.
FAQ
What are the best RSI settings for day trading?
Most day traders start with RSI(14) and the 70/30 bands, then adjust from there. A shorter length near 7 to 9 reacts faster for scalping, while the tighter 80/20 bands filter for cleaner reversals. So the right choice depends on your speed and your pair, tested on your own charts.
Is a shorter RSI length better for scalping?
A shorter length reacts sooner, which helps a scalper who trades within a few candles. Yet it also whipsaws more and prints many false tags. So pair a short RSI with a trend filter or a key level, and never trade its signals in isolation.
Should I use 80/20 or 70/30 bands?
The 70/30 bands fire more often and suit range-bound, mean-reverting conditions. The 80/20 bands demand a deeper stretch, so they print fewer but often cleaner signals. Many traders keep 70/30 as the default and switch to 80/20 when they want stricter entries.
Does RSI work on all timeframes?
RSI works on every timeframe, but its speed changes with the bar size. On a five-minute chart it reacts quickly and gives frequent signals, while on a daily chart it moves slowly and calmly. So match the timeframe to your holding period and adjust your expectations for signal frequency.
Why does RSI stay overbought in a trend?
In a strong trend, momentum stays stretched, so RSI can hold above 70 or below 30 for a long time. That behavior is normal, not a flaw. So in a clear trend, read the extreme as strength and trade band tags in the trend direction rather than against it.
Can RSI settings alone make me profitable?
No single setting delivers an edge by itself. RSI is one input that works best beside structure, a trend read, and disciplined risk. Manage risk on every trade. Results are not guaranteed; past performance is not indicative of future results.
External references
- For background on this concept, see Relative Strength Index at BabyPips Forexpedia.
- For broader market context, see Relative Strength at Investopedia.

About the author
Written by Dominic Walsh, a Forex trader and MT4/MT5 indicator, Expert Advisor and script developer. Every tool on forexmt4systems.com is tested on live charts before release and ships with ready-to-use compiled MT4 (.ex4) and MT5 (.ex5) files. Learn more about the trader and developer behind this site.
How we build, test and correct every tool: Editorial & Testing Policy. Trading carries risk; see the disclaimer.