
A liquidity void is a thin, fast stretch of price where one side of the market barely traded. Michael Huddleston, the Inner Circle Trader (ICT), uses the term for the near-empty zone that a violent move leaves behind. After this guide you will spot a liquidity void on any chart, separate it from a single fair value gap, and trade the retrace that so often follows.
So the void is a footprint of speed. Price repriced so quickly that the usual two-way auction never happened. That absence of trade becomes a magnet, because the market tends to return and fill some of what it skipped. Read it well and the void turns a scary spike into a patient, planned entry.
What a Liquidity Void Looks Like on the Chart
A liquidity void shows up as a run of large, one-sided candles with little overlap. The chart below shows a GBPUSD 15-minute example. Price displaced from 1.33401 to 1.33590 in three strong candles. The move left a thin zone with almost no wicks against it, and the 50 percent rebalance line sits at 1.33496.
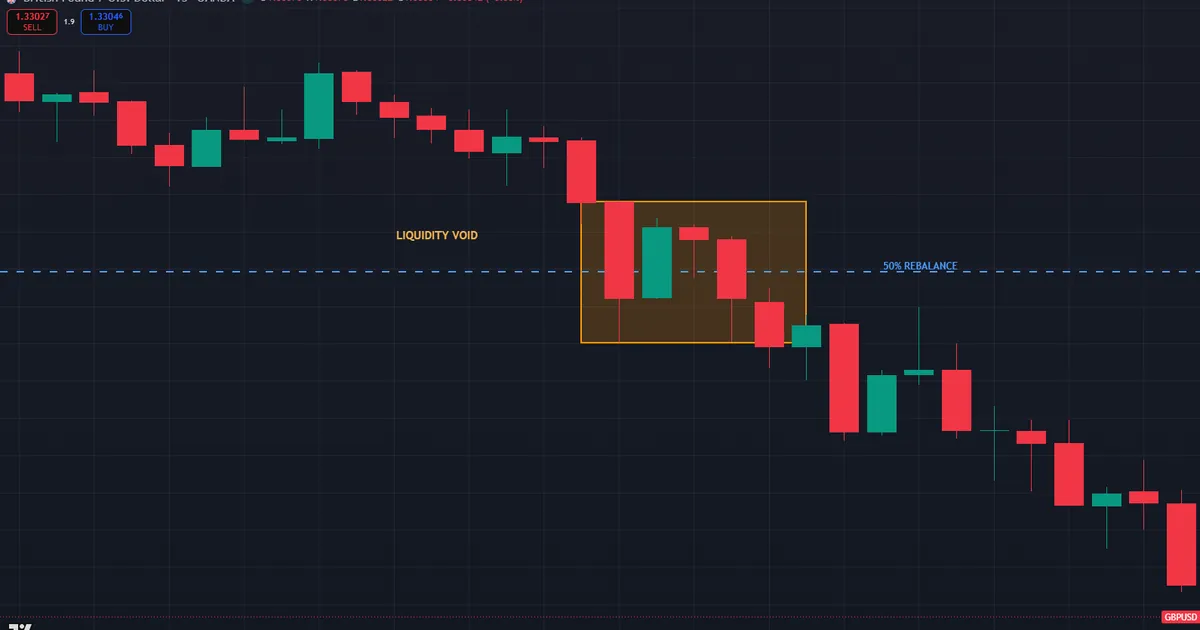
Reading the GBPUSD Void
Look at the texture first, not the size. Normal price action leaves overlapping candles and plenty of wicks in both directions. This stretch shows none of that. Each candle opens near the last one’s close and drives the same way, so buyers met almost no sellers on the way up. That one-sided print is the void itself.
Now mark the boundaries. The void runs from the base of the displacement at 1.33401 up to the point where normal, two-sided candles resume near 1.33590. Halfway between them, at 1.33496, sits the level many traders watch for a partial fill. Price rarely retraces the whole void, yet it often trades back to that midpoint before continuing.
Notice what the void tells you about intent. A fast one-way move means aggressive orders overwhelmed the book. So the path of least resistance still points the same way, and the retrace into the void is usually a chance to join the move rather than fade it.
Compare the void with the price action around it for a sanity check. Before the displacement, GBPUSD chopped sideways with balanced candles. After it, price paused and began to ease back. That contrast between calm, the shock, and the drift confirms you are reading a genuine void rather than ordinary trend candles. Truly clean voids stand out from their surroundings at a glance.
Why the Market Returns to Fill It
Fast moves leave unfinished business. Some resting orders never got filled inside the void, and market makers dislike large stretches of untraded price. So price often drifts back later to trade the level properly, a process traders call rebalancing. That return is not a reversal by default. More often it is a pause that lets late orders execute before the original move resumes.
Hold that read honestly, though. No rule forces a void to fill, and strong trends leave voids unfilled for days. Treat the rebalance as a tendency worth trading around, never as a certainty. Your own journal will show how often your instrument respects the pattern.
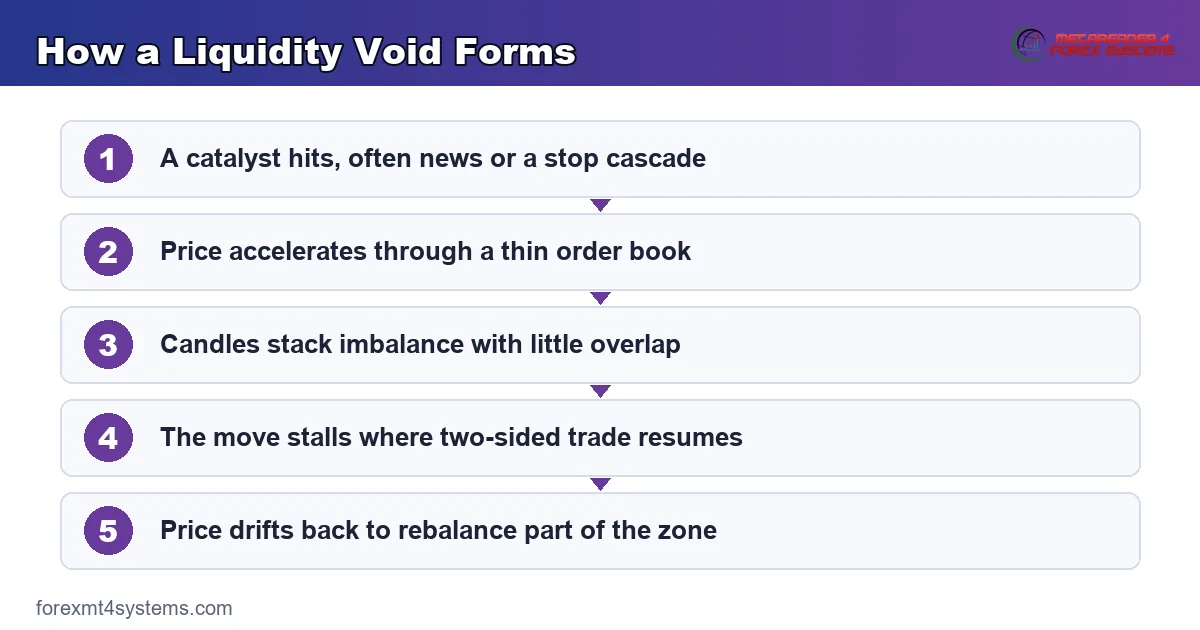
How a Liquidity Void Forms
Voids come from displacement, so start there. Displacement is a sudden, forceful move that breaks structure and leaves imbalance behind. When that force is large enough, it prints not one small gap but a long chain of them. That chain is the void. The displacement guide covers the energy behind the move in full.
- First, a catalyst hits, often a news release or a stop cascade past a key level.
- Next, price accelerates as aggressive orders sweep the thin book in one direction.
- Then several candles print with little overlap, stacking imbalance on imbalance.
- Now the move stalls where two-sided trading resumes, marking the far edge of the void.
- Last, price often drifts back to rebalance part of the zone before continuing.
News is the classic trigger. A surprise print can move a pair 40 pips in seconds, and the economic calendar tells you when those windows open. Our free economic calendar flags the high-impact releases that carve the deepest voids, so you can plan around them rather than get caught inside.
Voids Away From the News
Not every void needs a headline. A liquidity sweep can spark one on its own, when a stop run past an obvious level triggers a cascade of orders. The London open and the New York open both produce these moves regularly, even on quiet news days. So watch the session opens as closely as the calendar, since the algorithm often delivers its sharpest displacement right as liquidity thins around the handover.
The second graphic below traces the full life cycle of a void. It runs from the catalyst, through the acceleration and stacked imbalance, to the rebalance that so often follows.
Voids as a Sign of Inefficiency
ICT frames a void as inefficient delivery, and that phrase rewards a closer look. An efficient market trades both up and down at every level, leaving overlapping candles. A void is the opposite. Price delivered in one direction only, so the auction skipped whole levels. The market treats that skip as unfinished, which is why it so often returns to trade the ground it missed.
This lens explains the retrace without any mystery. Price is not obeying a magic line. Instead it is completing an auction that ran too fast the first time. So the rebalance is less a prediction and more a description of how order flow tidies up after a shock. Hold that framing and the void stops feeling like a trick and starts feeling like plumbing.
Liquidity Void Versus a Fair Value Gap
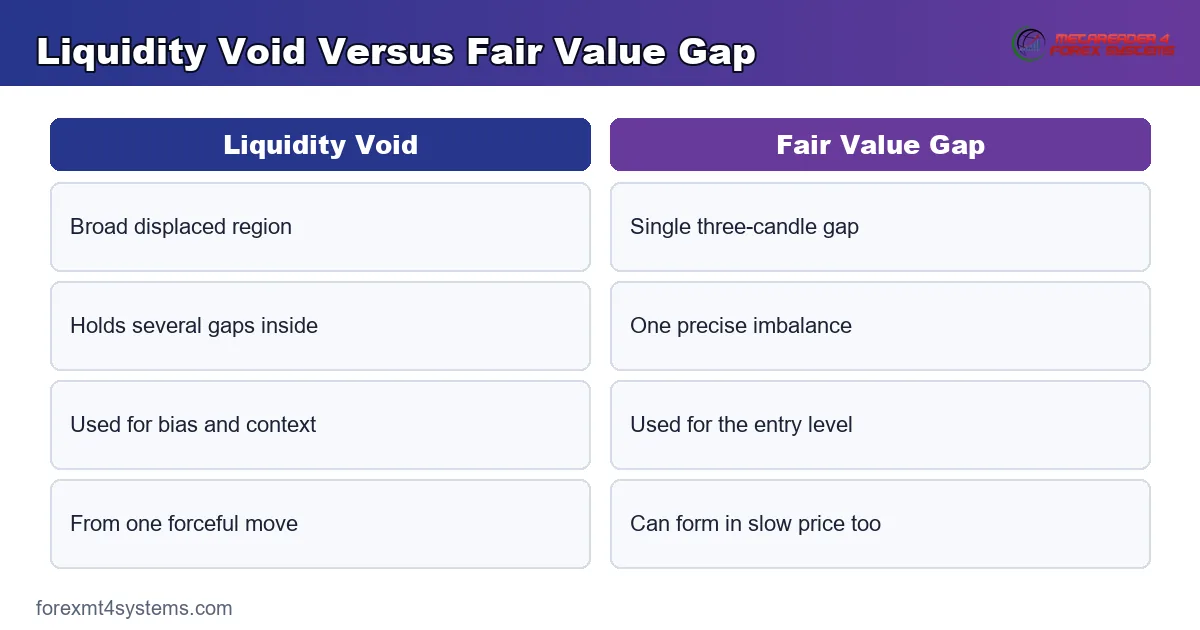
These two ideas overlap, and that overlap causes real confusion. A fair value gap is a precise, three-candle pattern. It is the gap between the first candle’s wick and the third candle’s wick, with the middle candle doing the work. A liquidity void is bigger and looser. It is the whole displaced region, and it usually contains several fair value gaps stacked together.
Think of scale, not kind. A fair value gap is one brick, while a liquidity void is the wall those bricks build. So every void holds fair value gaps inside it, but not every gap sits in a void. A single gap in slow, choppy price is just a small imbalance, not a fast one-way stretch.
Which One to Trade
Use the void for context and the gap for the trigger. The void tells you where price moved with force and which way the pressure points. Then a specific fair value gap inside it gives you a precise entry level and a tight stop. The comparison of the fair value gap and the order block shows how these zones rank against each other, and the full guide to fair value gap trading covers the entry mechanics.
How Deep a Void Should Be
Not every void is worth trading, and depth sorts the strong from the weak. A shallow void from a minor wobble carries almost no pull, so price ignores it. A deep void from real displacement, three or more strong candles with barely a wick against them, respects the rebalance far more reliably. So measure the move that built the void before you trust the level.
Volume adds a second filter. A void carved on a news release or a session open usually rests on genuine order flow, which gives the rebalance a reason to happen. A void printed in thin, late-session trade often means little, because few orders were left behind. Weigh both the size and the context of the displacement, not just the empty look of the candles.
Measuring the Rebalance
The rebalance rarely fills the whole void, so set expectations in advance. Price commonly trades back to somewhere between the far edge and the 50 percent line, taps a gap, and continues. A few voids fill completely, and a few barely fill at all. Mark the midpoint as your primary reference, then treat a fuller fill as a bonus rather than the plan. That habit keeps you from moving a target just because price paused early.
Where the Liquidity Void Fits the ICT Workflow
The void is a bias and location tool, not a standalone signal. First, read the higher timeframe and note any large displacement that left a void. That move sets your directional lean. Then wait for price to drift back toward the void on a lower timeframe. A bullish void wants a buy on the retrace, and a bearish void wants a sell.
Next comes the trigger. Inside the void, find a clean fair value gap or an order block that lines up with the rebalance. Drop to a 5-minute chart and let price tap that level. So the sequence reads high-timeframe void, then a precise zone inside it, then a low-timeframe entry as price rebalances.
Session Timing in New York Hours
Timing matters because voids cluster around the session opens. The London kill zone near 2:00 AM New York time and the New York morning window from 8:30 to 11:00 New York time produce the deepest displacement. So mark any void that forms in those windows and expect the rebalance during the same session or the next. The Asian range from 8:00 PM to midnight rarely carves a real void, so treat it mainly as a reference box. The wider catalog of smart money indicators can highlight these imbalanced zones automatically.
Pairing the Void With a Lower Timeframe
The void gives context, but the entry lives lower down. Picture a 1-hour void on GBPUSD after a strong London push. That move sets a bullish lean for the session. Drop to the 5-minute chart and wait for price to drift back into the void. When a small candle rejects a gap inside it, you have a precise trigger with a tight stop. The high timeframe answers where and why, while the low timeframe answers when. So resist entering on the 1-hour candle itself, since its range is far too wide for controlled risk.
Worked Example: Buying a Bullish Void on USDJPY
Rules feel abstract until you price a real setup. The chart below walks a USDJPY 15-minute sequence from displacement to entry, and it runs long from a bullish void.
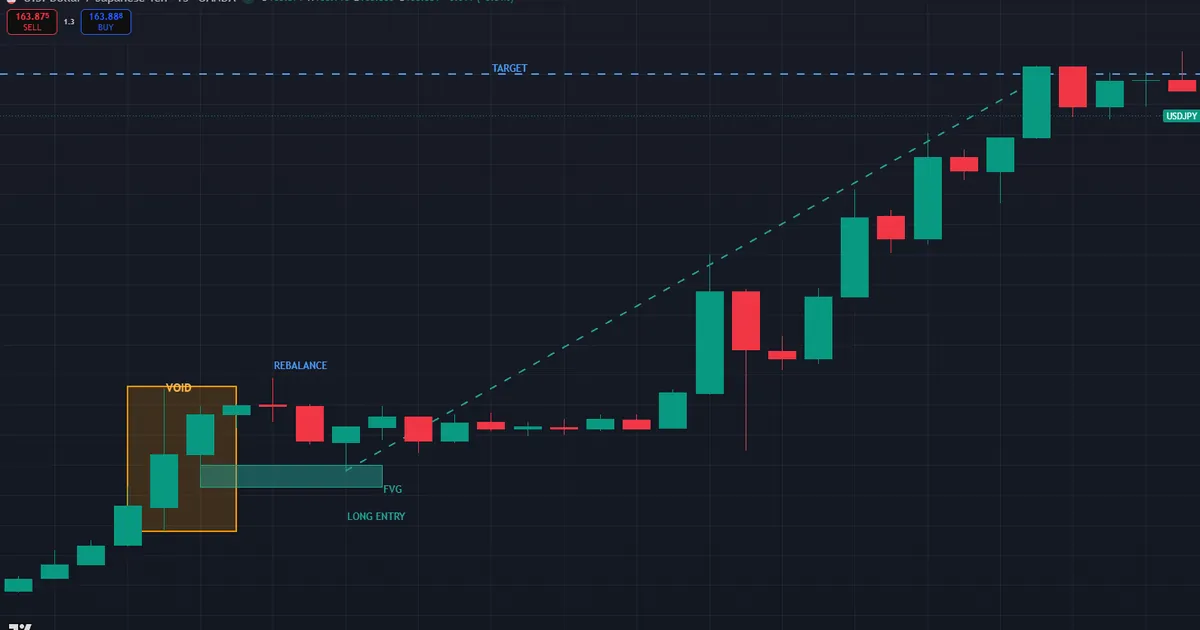
- First, the displacement: price surged from 163.190 to 163.430 in four heavy candles, leaving a thin void.
- Next, the bias: the daily chart had already broken up, so buy-side liquidity above 163.900 stood as the draw.
- Then the zone: a bullish fair value gap inside the void ran from 163.264 to 163.300.
- The rebalance: price drifted back down to 163.290, tapping the gap near the void midpoint.
- The trigger: a 5-minute candle rejected the level and displaced higher again.
- Last, the trade: buy the tap, stop at 163.180, first target 163.430, final target the pool above 163.900.
Price paid does the quiet work. A long filled near 163.290 buys into the rebalance, well below the target pool. The far target pool spans well over five times the stop distance. Also notice the discipline the void enforces. A long taken during the fast rise itself would chase, while waiting for the rebalance hands you a tight, defined risk.
Managing the USDJPY Trade
Manage the position with the same map that framed it. Many traders bank a partial as price reclaims the far edge of the void, then trail the rest toward the draw above. Others exit fully at the first target on choppy days and only hold runners when the daily bias backs the move. Choose one plan before entry and write it down. The void hands you the levels, and your journal keeps you honest about following them. Also decide in advance what you will do if price stalls halfway, since indecision at the midpoint costs more than any single stop.
Download the complete indicator database
Put these concepts on your charts. One email unlocks the full library of 1,380+ indicators with compiled MT4 and MT5 files, plus my TradingView scripts. No paywall, no spam, unsubscribe any time.
Get free access to my indicator database
One email unlocks 1,380+ free MT4, MT5 and TradingView indicators — the complete library. No single-tool download; you get the whole database.
Common Liquidity Void Mistakes and Their Fixes
Void errors sink more trades than entry errors, and a few of them dominate beginner journals. Most stem from acting on the fast move instead of the calm retrace that follows it. Each mistake below carries a plain correction you can apply on the very next chart.
- Chasing the fast move itself. Fix: wait for the rebalance into the void before you commit.
- Fading a void against the trend. Fix: trade the retrace in the direction of the displacement, not against it.
- Confusing a single gap with a void. Fix: a void is a chain of gaps from one forceful move, not one brick.
- Expecting a full fill every time. Fix: plan for a partial rebalance near 50 percent, and let the rest run.
- Trading news voids blind. Fix: check the calendar first, and skip the seconds around the release.
- Ignoring the draw on liquidity. Fix: enter only when a clear pool sits beyond your intended target.
The second graphic pairs each mistake with its fix for a fast pre-session review before the New York open.
A Liquidity Void Pre-Trade Checklist
Run these seven lines before any entry that leans on a void. A single failure sends the trade back to the watchlist.
- A clear displacement left a thin, one-sided zone on the higher timeframe.
- The void points the same way as your directional bias.
- A precise fair value gap or order block sits inside the void.
- Price is drifting back to rebalance rather than accelerating away.
- A lower-timeframe candle confirms rejection at the level.
- A liquidity pool sits beyond the target, giving the trade somewhere to go.
- The stop sits past the void edge, and the journal line is written first.
Also score a month of trades against this list. The line you skip most often is your leak, and fixing one leak beats learning three new setups.
Related Concepts to Study Next
The liquidity void connects to several ideas worth learning together. The draw on liquidity guide explains why price runs toward pools after leaving a void behind, which sets your targets. Then the ICT 2022 model ties displacement, imbalance, and a fair value gap entry into one repeatable sequence that a void often sets up. Also, the displacement and fair value gap guides linked above sharpen the raw materials of every void.
When a Liquidity Void Fails
Voids do not always rebalance. In a runaway trend, price can leave a void and never look back, so a trader waiting for the retrace simply misses the move. That is a real cost the approach accepts in exchange for tighter, more patient entries. Momentum can also punch straight through a void the second time, ignoring the level entirely.
Depth of the void is the other trap. A shallow, low-volume void carries little pull, so price ignores it more often than not. A deep void from genuine displacement respects the rebalance far more reliably. Hence weigh the quality of the move that built the void, not just its presence on the chart.
A Failure Walkthrough on EURUSD
One failure repeats more than the rest, and the chart below shows it. EURUSD spikes higher on a news print, carving a large void. A trader marks it, waits for the rebalance, and buys the retrace toward the midpoint. Yet a second release lands minutes later and reverses the whole move, so price tears back down through the void without pausing.
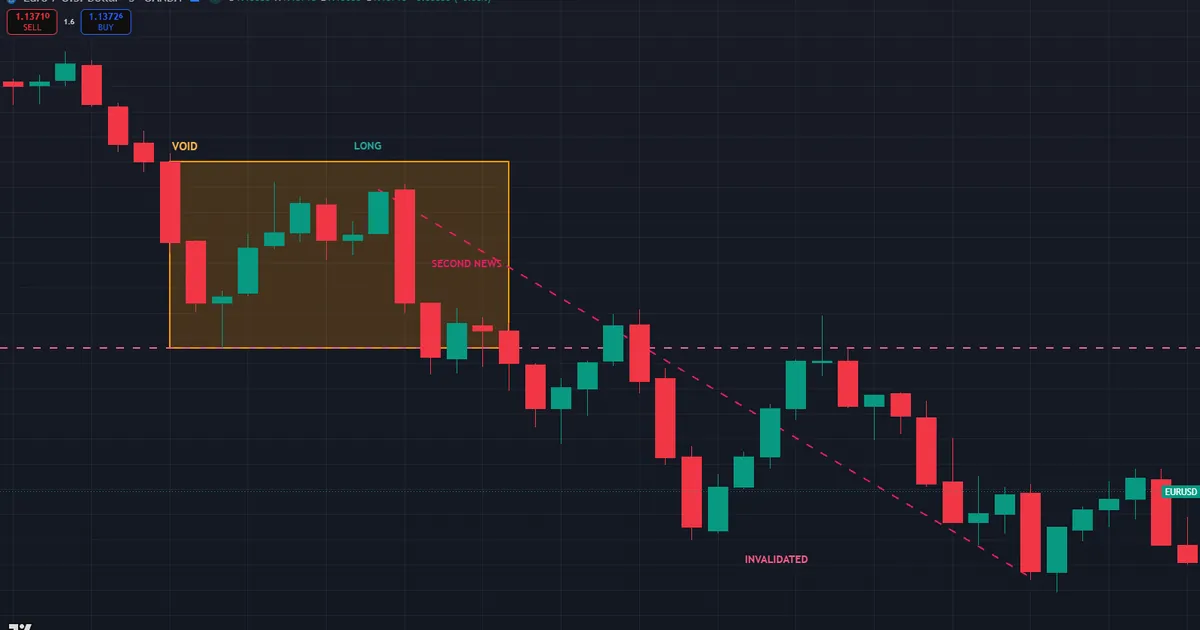
Resolution comes fast. Price closes below the base of the void, the long stops out, and the honest read appears. The first spike was noise, and the void it left never had real orders behind it. Thus the invalidation rule stays simple: a decisive close beyond the void base kills the setup. Journal the catalyst, the void depth, and whether a second news event followed, because news-on-news whipsaws cause most of these failures.
FAQ
What is a liquidity void in trading?
A liquidity void is a thin stretch of price left by a fast, one-sided move. So little trading happened inside it that the market often returns later to rebalance part of the zone. Traders use the void to gauge direction and to time entries on the retrace.
How is a liquidity void different from a fair value gap?
A fair value gap is one precise three-candle imbalance. A liquidity void is broader and usually holds several of those gaps inside a single forceful move. Think of the gap as a brick and the void as the wall those bricks build.
Does a liquidity void always get filled?
No, and that is a common misconception. Strong trends leave voids unfilled for a long time, and some never fill at all. Treat the rebalance as a tendency, plan for a partial fill near the midpoint, and always keep an invalidation level. The deeper and more news-driven the void, the more reliably it draws price back, though nothing here is a certainty.
Which timeframe is best for spotting a void?
Any timeframe with clear displacement works, though 5-minute and 15-minute charts show the cleanest news-driven voids. Higher timeframes reveal larger, slower voids that take longer to rebalance. Match the timeframe to your own holding period rather than forcing a single setting on every trade.
How do I set a stop when trading a void?
Place the stop just beyond the base of the void, since a decisive close through that level invalidates the idea. That keeps risk defined and small relative to the target pool. Never widen the stop mid-trade to avoid being wrong. A position size calculator helps you keep the risk fixed even when the void demands a wider stop than usual.
Do liquidity voids work on stocks and crypto?
The concept applies to any market that displaces quickly, and traders use it on indices, metals, and crypto. Yet each market fills voids at its own pace, so test the pattern on your instrument first. Fast-moving assets can gap over a weekend and leave voids that take days to trade back. Results are not guaranteed; past performance is not indicative of future results.
External references
- For background on this concept, see Gapping at Investopedia.
- For broader market context, see Liquidity crisis on Wikipedia.

About the author
Written by Dominic Walsh, a Forex trader and MT4/MT5 indicator, Expert Advisor and script developer. Every tool on forexmt4systems.com is tested on live charts before release and ships with ready-to-use compiled MT4 (.ex4) and MT5 (.ex5) files. Learn more about the trader and developer behind this site.
How we build, test and correct every tool: Editorial & Testing Policy. Trading carries risk; see the disclaimer.