
The fair value gap vs order block choice is a choice between two footprints of the same institutional move. A fair value gap (FVG) is a three-candle imbalance left inside a fast leg; an order block is the candle that launched that leg. Both mark zones where price may react. Yet they form differently, invalidate differently, and suit different entries. After this guide you will know which zone to trade, and what to do when both line up at one price.
Both tools anchor smart money concepts (SMC), the framework popularized by Michael Huddleston, the Inner Circle Trader (ICT). Neither replaces the other. Truly, the strongest setups tend to use the two together. Each answers a different question: the block marks where the move began, while the gap marks where price moved too fast to trade fairly.
How Each Zone Forms
The fair value gap: a three-candle imbalance
A fair value gap appears when price moves so fast that one candle’s range never overlaps its neighbors. In the bullish case, the high of candle one sits below the low of candle three, and the space between them across candle two is the gap. Only one side of the market traded there. So price often returns later to rebalance the level. The gap is measurable to the pip, which is why it anchors so many mechanical entry models. For the complete treatment, read the full guide to fair value gap trading.
The order block: the origin candle
An order block is the last opposing candle before the displacement that created the move: the final down-close candle before a rally, or the final up-close candle before a drop. ICT reads it as the footprint of institutional accumulation at the origin of the leg. Most traders refine the raw candle to its body or its midpoint before trading it. Meanwhile, the full order block trading guide covers marking rules, refinement, and entry models in depth.
Why price returns to each zone
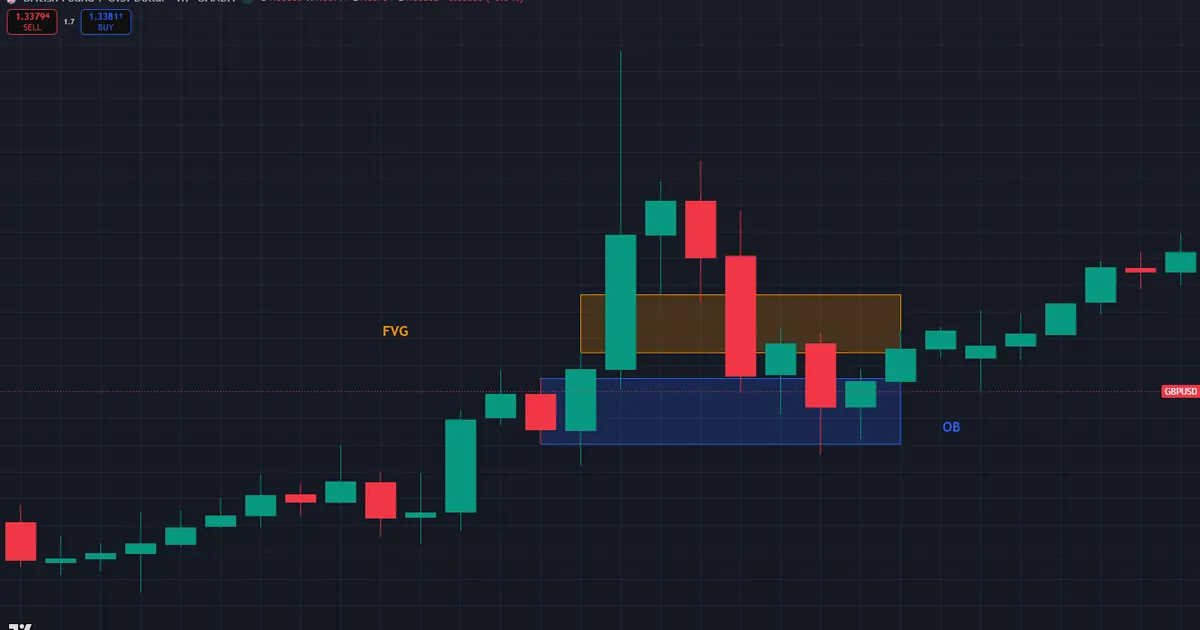
Different order flow pulls price back to each level. The gap draws price because business went unfinished there: one-sided trade left resting limit orders unfilled, and the market tends to revisit thin areas to transact where it previously could not. The block draws price for a personal reason instead. Institutions that built positions at the origin rarely fill their whole size in one pass, so the return trip lets them add at a price they already validated. Hence a gap fill is the market rebalancing, while a block retest is a participant finishing a job. The chart below shows both footprints from one leg on GBPUSD H1, July 13, 2026: an order block at 1.33702-1.33826 with a fair value gap at 1.33873-1.33982 stacked directly above it.
Fair Value Gap vs Order Block: Key Differences
Five contrasts cover most practical decisions between the two zones.
- Location. The order block sits at the origin of the move, while the FVG sits inside it, usually higher up the leg in a rally.
- Anatomy. An order block is one candle’s range, whereas an FVG spans the void between candle one’s high and candle three’s low.
- Fill logic. Price trades into an FVG to rebalance thin trade, and a full fill is normal. Instead, an order block is a defended zone, and a full close through it means failure.
- Invalidation. An FVG that price closes through can invert its role; the inversion FVG guide covers that flip. Meanwhile, a broken order block can become a breaker, as explained in the breaker block vs order block comparison.
- Frequency. FVGs print far more often. Indeed, every impulsive session leaves several, while clean order blocks are scarcer.
The pattern of use follows from those contrasts. Gaps behave like magnets and springboards inside a move, while blocks behave like foundations under it. Plainly, you fade into a block expecting defense, and you trade a gap expecting rebalance and continuation. The side-by-side graphic below condenses the whole comparison.

Timeframe Alignment for Both Zones
Zones inherit the weight of their timeframe. A four-hour order block can host a whole day of five-minute structure, while a five-minute FVG may fill within the hour. So most SMC traders work top-down. First, they mark the higher-timeframe zone price is approaching, usually on the four-hour or daily chart. Next, they wait for price to enter it. Then they drop to the one-minute or five-minute chart and hunt a small displacement in the new direction, which often leaves a fresh lower-timeframe FVG to enter from. Thus the order block frames the trade, and the gap times it. Also note the reverse: a lower-timeframe block inside a higher-timeframe gap works the same way in mirror.
A concrete pairing makes the idea usable today. Suppose the four-hour chart shows an unfilled demand block below current price and the daily draw points up. The plan writes itself: wait for price to enter the four-hour block, then watch the five-minute chart for a sweep of a minor low and a sharp push higher. That push usually leaves a five-minute FVG, and its midpoint becomes the entry inside the larger zone. One framework, two timeframes, and each zone type doing the one job it is best at.
Precision: Which Zone Gives the Tighter Entry
Fair value gaps usually win on precision. A gap has a defined midpoint, which ICT calls consequent encroachment, and that 50% line gives a single price to rest a limit order at. Stops go just beyond the far edge of the gap. Hence risk on a one-hour EURUSD gap often measures ten pips or less.
Order blocks run wider. A one-hour block can span twenty pips or more, which forces a choice: enter at the edge and accept a deeper stop, or wait for the 50% mean threshold of the block. Still, the width buys durability. A zone backed by real positioning can absorb a wick that would blow straight through a narrow gap. Width also affects sizing, since a wider stop forces a smaller position at the same account risk.
So the practical split looks like this. First pullbacks in a fast trend tend to reach the nearest FVG and go, which favors the gap entry. Deeper retracements that unwind most of the leg favor the order block at the origin. Second entries after a gap fills often resolve at the block anyway, since it sits below the gap in a bullish leg.
Sizing the two entries differently
Precision only pays when the sizing follows it. Fix the account risk per trade first, with most structured traders keeping it near 1% or lower. Then let each zone’s stop distance set the position size. A twelve-pip gap stop supports a larger position than a twenty-five-pip block stop at identical account risk, and that difference, not the entry price, is where the gap’s precision actually earns money. Resist the reverse habit of sizing first and stretching the stop to fit. A stop placed by position size rather than structure protects nothing, because the market never agreed to respect it.
Confluence: When the Two Zones Overlap
The highest-quality zones are stacked. A fair value gap sitting inside or just above an order block gives price two independent reasons to react at one level. Also, the 62-79% retracement band of the displacement leg, ICT’s optimal trade entry window, can add a third vote; our Fibonacci calculator returns that band from any swing high and low. Stacked zones are rarer than single ones, and that scarcity is part of their value. The hero chart above is exactly this case: the GBPUSD gap at 1.33873-1.33982 rests directly on the block at 1.33702-1.33826, so a single pullback meets both zones in sequence. Order of contact matters too. Price meets the gap first on the way down, and how it behaves there, snapping away or slicing through, tells you plenty about whether the block beneath will need to work at all.
A worked overlap on EURUSD
Picture a one-hour rally from 1.0805 to 1.0870. The leg leaves an order block at 1.0800-1.0812 and a bullish FVG at 1.0826-1.0834. During the New York morning, price retraces and fills the gap at 1.0830, pauses, then sinks further into 1.0811, deep inside the block and near the 70.5% retracement of the leg. Now the stacked case is complete. A long from 1.0811 carries a stop at 1.0794, below the block, and targets the buy-side liquidity above 1.0885. Price lifts from the block over the next two hours and clears 1.0850 before New York lunch. Whether it reaches 1.0885 or stalls, the invalidation was never in doubt: a close below 1.0794 ends the idea cheaply. Indeed, the entry that used both zones plus the retracement band offered the tightest logical risk of the whole pullback.
Second Worked Example: A Bearish Gap Entry on USDJPY
Now rehearse the short side step by step. USDJPY breaks down from 157.60 on the one-hour chart, and one displacement leg runs to 156.70 during the London morning. The leg leaves two footprints. At the origin sits a supply order block at 157.44-157.60, the last up-close candle before the drop. Inside the move sits a bearish FVG at 157.18-157.30, where the middle candle outran its neighbors. Spotting comes first: mark both zones the moment the leg completes, before any pullback begins.
Next, plan the entry while the chart is quiet. The gap midpoint sits at 157.24, so a sell limit rests there. The stop goes at 157.36, just beyond the gap’s far edge, for twelve pips of risk. Traders wanting a safety margin place it above the order block at 157.62 instead and cut size to match the wider distance.
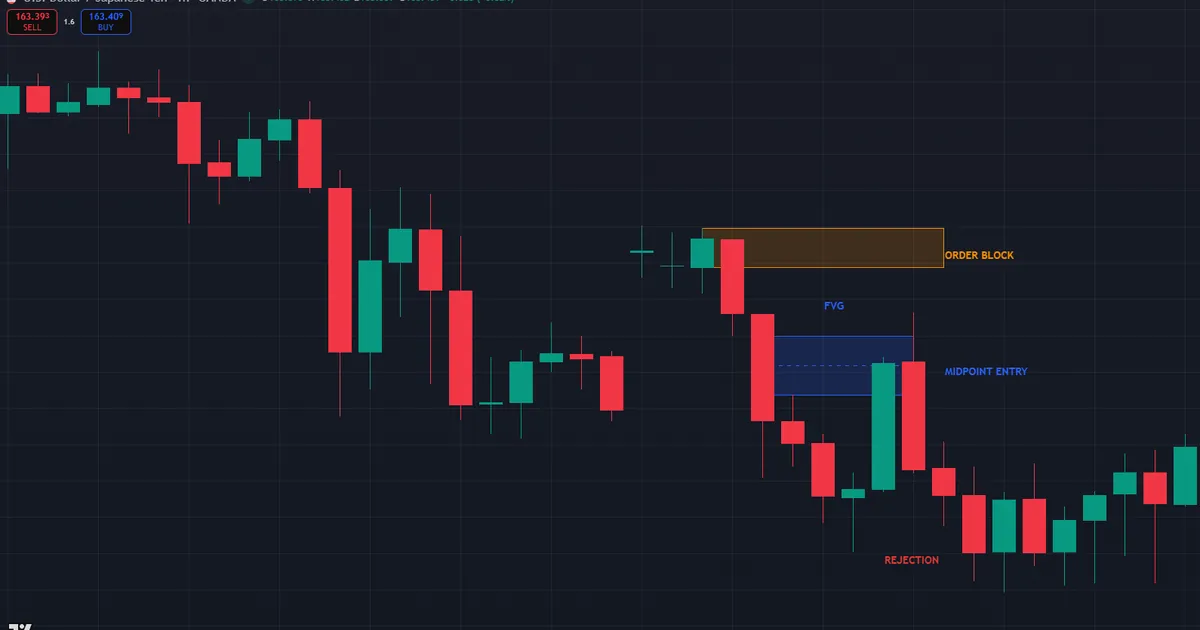
The pullback arrives in the New York morning. Price lifts into the gap, tags 157.26, and stalls right at the midpoint as the rebalance completes. The limit fills, rejection follows, and the target logic looks down at 156.40, where equal lows hold sell-side liquidity roughly eighty-four pips below entry. Half comes off at 156.70, the old leg low, with the stop moved to entry. Every element came from the two footprints: the gap supplied the price, the block supplied the ceiling, and the liquidity below supplied the destination.
Download the complete indicator database
Put these concepts on your charts. One email unlocks the full library of 1,380+ indicators with compiled MT4 and MT5 files, plus my TradingView scripts. No paywall, no spam, unsubscribe any time.
Get free access to my indicator database
One email unlocks 1,380+ free MT4, MT5 and TradingView indicators — the complete library. No single-tool download; you get the whole database.
Where Both Zones Sit in the SMC Workflow
Neither zone starts the analysis; both arrive at stage two. The routine runs from context to trigger. First, establish higher-timeframe direction on the daily and four-hour charts and name the liquidity pool price is drawing toward. Second, mark the points of interest on the path, which is where gaps and blocks enter the picture. Third, wait for price to reach a zone and drop to the five- or fifteen-minute chart. Only a lower-timeframe structure shift in the trade’s direction converts the zone touch into an order.
Sessions and timing in practice
Session timing decides how zones behave when price finally arrives. The London kill zone runs roughly 2:00-5:00 a.m. New York time, and the New York kill zone spans about 7:00-10:00 a.m. Pullbacks that reach a gap or block inside those windows meet genuine volume, so the reaction, hold or fail, comes quickly and honestly. The same touch in the Asian session often just drifts. Hence many traders mark zones around the clock yet only execute inside the two kill zones, letting every other touch pass as information.
Letting software carry the marking
Marking every gap by hand gets tedious on lower timeframes. Meanwhile, automation keeps the chart honest: our Imbalance Detector indicator draws fair value gaps automatically on MT4 and MT5, and the full shelf of smart money indicators covers order blocks and the rest of the toolkit. Discretion still owns the final call, because software finds shapes while the trader supplies context.
Common Mistakes with Gaps and Blocks
Six errors account for most losses with these two zones. Each carries a straightforward correction.
- Trading every gap that prints. Most gaps are noise inside ranges. Correction: only trade gaps left by displacement that broke structure.
- Treating a gap fill as a signal by itself. Fills are normal, not entries. Correction: demand a lower-timeframe rejection at the fill before acting.
- Putting the stop inside the block. Ordinary penetration tags it early. Correction: stops belong beyond the block, with wick room.
- Marking blocks without displacement. A candle that launched nothing defends nothing. Correction: require a structure-breaking leg after the candle.
- Mixing timeframes carelessly. A five-minute gap cannot anchor a four-hour idea. Correction: frame with the higher timeframe, time with the lower.
- Chasing after the zone reacts. Entering late turns tight risk into wide risk. Correction: if the level went without you, log it and wait.
Keep the decision rules visible while you learn them. The card below compresses the gap-versus-block choice into six lines.

Quick Pre-Trade Checklist
Walk this list before resting an order at either zone. One failed line means the setup needs more evidence.
- Did real displacement create the zone, breaking structure behind it?
- Is the zone fresh, with no prior retest since it formed?
- Does the trade direction agree with the daily draw on liquidity?
- Gap entry: is the limit at the midpoint with a stop beyond the far edge?
- Block entry: is the stop beyond the block with size cut to match?
- Is price due to arrive inside a London or New York kill zone?
- Is there a liquidity target worth at least twice the risk?
Related Concepts Worth Mastering
Three neighbors deepen this comparison. The 62-79% retracement band that graded our stacked example comes from optimal trade entry, and that guide shows how ICT anchors the band to a displacement leg. The speed test behind every valid zone lives in displacement in trading, which separates institutional urgency from drift. Study them alongside the inversion logic linked earlier, then tag live examples of each until the labels come without thinking. Concepts anchored to your own marked-up charts hold up under pressure far better than definitions read once.
Limitations of Both Zones
Both zones fail often enough to demand humility. Gaps fill constantly inside ranges, and a fill alone is not a signal; many gaps fill and keep going without any reaction. Meanwhile, order blocks break in every ranging week, and a chart can show a dozen candidate blocks at once. Hence zone selection, not zone drawing, is the real skill. Lower timeframes multiply the noise, because every minor impulse prints its own gap and candidate block. No trustworthy figure exists for how often either zone holds; the honest answer moves with market, session, and the trader’s own filters.
Spreads and costs bite harder on the gap side. A twelve-pip gap entry loses a meaningful slice of its edge to a two-pip spread, while the same spread barely dents a wider block trade. So check the pair’s typical spread during your session before leaning on tight gap stops, and widen expectations on crosses where costs run higher.
Bias must come first. Pick the higher-timeframe direction, define the draw on liquidity, and only then choose zones that agree with it. Also respect the calendar, because one news candle can fill a gap and break a block in the same minute. Truly, neither tool predicts; each one frames where a reaction is plausible and where the idea is wrong. Your own logged trades, split by zone type, settle the argument better than any article can.
A failure walkthrough: when the stack breaks
Even stacked zones fail, and the failure has a recognizable shape. GBPUSD leaves a bullish FVG at 1.3410-1.3422 resting on an order block at 1.3390-1.3408 after a London rally. The pullback fills the gap, and instead of rejecting, price slides straight through the midpoint on rising momentum. The block gets its turn next. Two probes hold briefly, then an hourly candle closes at 1.3382, below the block’s floor. Both footprints failed in sequence, and the leg that follows runs thirty pips lower.

The invalidation rule saved whoever followed it: the close below the block ends the idea, full stop, whatever the stop order still allowed. A filled gap plus a broken block usually signals that the original displacement lacked real sponsorship. Afterwards, log the case with three notes: the session of the failure, whether the daily draw opposed the trade, and how the gap behaved at its midpoint. Failed stacks recorded this way become the sharpest filter you own, because they teach exactly what missing sponsorship looks like one bar before it costs money.
FAQ
Is a fair value gap the same as an imbalance?
Yes, in common usage. Fair value gap is ICT’s name for a three-candle imbalance where one candle’s range fails to overlap its neighbors. Also, some platforms label the same structure an imbalance or a liquidity void.
Should I trade the fair value gap or the order block first?
Price reaches the gap first in a bullish leg, since it sits above the block. Shallow pullbacks favor the gap; deeper retracements favor the block. So many traders take partial risk at the gap and add at the block if price keeps falling.
What happens when a fair value gap fills completely?
A complete fill rebalances the zone, and the gap loses its draw. Then, if price closes through it with displacement, the gap can invert and act as support or resistance from the other side.
What is consequent encroachment?
It is ICT’s term for the 50% midpoint of a fair value gap. Many entry models rest limit orders exactly there, because a reaction at the midpoint suggests the gap only needed a partial fill before continuing.
Can an order block contain a fair value gap?
Yes, and that overlap is one of the strongest confluences in SMC trading. The gap pinpoints the entry while the block defines the invalidation. Still, stops belong beyond the block, not inside it.
Which zone should a newer trader learn first?
Start with the order block, because it teaches the displacement and origin logic that gaps depend on. Then add fair value gaps for entry precision. Results are not guaranteed; past performance is not indicative of future results.
External references
- For background on this concept, see Gap (Chart Pattern) on Wikipedia.
- For broader market context, see Fair Value at Investopedia.

About the author
Written by Dominic Walsh, a Forex trader and MT4/MT5 indicator, Expert Advisor and script developer. Every tool on forexmt4systems.com is tested on live charts before release and ships with ready-to-use compiled MT4 (.ex4) and MT5 (.ex5) files. Learn more about the trader and developer behind this site.
How we build, test and correct every tool: Editorial & Testing Policy. Trading carries risk; see the disclaimer.