
So what is parabolic SAR trading, and why does this trail of little dots sit on so many trend charts? The parabolic SAR plots a dot above or below each bar, and the dots flip sides when a trend turns, which gives you both a trailing stop and a trend signal in one tool. After this guide you will read the dots with confidence, tune the step and maximum, and turn a dot flip into a plan for entries, stops, and exits.
Learning what is parabolic SAR behaviour also keeps you out of its worst habit. In a clean trend it trails price beautifully, and in a flat range it flips back and forth and hands you loss after loss. Read the market type first, and the same dots either guide you or trap you.
What Is Parabolic SAR Doing on the Chart
Welles Wilder introduced the parabolic SAR in his 1978 book, the same volume that gave traders the RSI and the ATR. SAR stands for Stop And Reverse, which describes the tool exactly. It plots a stop level that trails the trend, and when price reaches that stop, the system reverses to the other side. The chart below shows a EURUSD 1-hour uptrend with the dots trailing neatly below each bar as price climbs.

Dots Above and Dots Below
Start with the single rule that makes the tool readable. When the dots sit below price, the trend reads up, and the dot marks a rising stop beneath the move. When the dots sit above price, the trend reads down, and the dot marks a falling stop overhead. So a quick glance tells you the current bias without a second thought. Below is bullish, above is bearish, and the flip between them is the event that matters most.
Now watch how the dots behave inside a trend. Early in a move they sit far from price and give the trend room to breathe. As the move extends, they creep closer and closer, tightening the stop as momentum builds. That tightening is deliberate, and it is the heart of how the tool protects an open trend trade.
The Acceleration Factor
The dots tighten because of a value called the acceleration factor. It starts small, at 0.02 by default, and it steps up by another 0.02 every time the trend prints a fresh extreme. So a trend that keeps making new highs pulls the dots toward price faster and faster. Wilder capped the factor at 0.2 so the stop never becomes absurdly tight. That cap keeps the tool usable even in a long, powerful run, where an uncapped factor would choke the trade too early.
How the Parabolic SAR Works
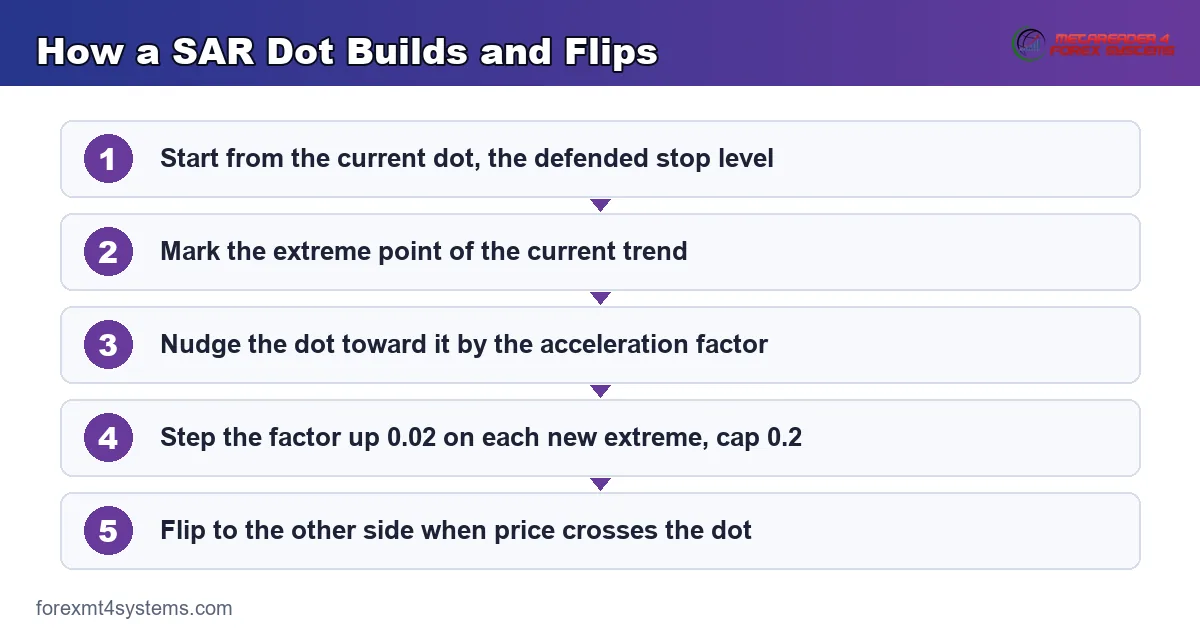
The math looks intimidating on paper, yet the idea behind it is simple. Each new dot is the last dot nudged toward the trend’s most extreme price, and the acceleration factor sets how big that nudge is. The steps below spell out how one dot becomes the next inside an uptrend.
- First, note the current dot, the SAR value the system is defending as a stop.
- Next, mark the extreme point, the highest high the uptrend has reached so far.
- Then take the gap between that extreme point and the current dot.
- Now multiply the gap by the acceleration factor, which starts at 0.02.
- Last, add that result to the current dot to place tomorrow’s dot a little higher.
The reverse logic runs a downtrend, with the dots stepping down toward each new low. Whenever price crosses through the dot, the system flips: the trend label switches, the dots jump to the other side, and the acceleration factor resets to 0.02. So every flip starts a fresh count, giving the new trend room before the stop begins to tighten again. That reset is why the tool adapts to a change in direction instead of clinging to a stale reading.
Why the Dots Never Sit Still
The trail always moves, and understanding why keeps you patient with it. Early in a trend the acceleration factor is small, so each dot barely shifts and the stop hangs back. Every fresh extreme bumps the factor higher, and the gap between price and the dots narrows bar by bar. So a young trend gets plenty of slack, while a mature one gets a tight leash. That design lets the tool capture a big move without choking it at the start, then protect the gains once the run has clearly stretched. Read the dot spacing as a live gauge of how far the trend has already travelled.
The first graphic below breaks the dot-building sequence into its plain-language flow, from the current stop to the next dot and the flip.
Where the Parabolic SAR Fits Your Workflow
The parabolic SAR is a trend-following tool, so it earns its keep once a trend exists. Most traders keep Wilder’s defaults, a 0.02 step and a 0.2 maximum, and only change them with a clear reason. A smaller step trails looser and survives more noise, while a larger step trails tighter and locks gains faster. Pick one setting, learn how it rides your pair, and avoid retuning it after every shakeout.
Choosing the Step and Maximum
The step controls everything, so treat it with respect. A step of 0.01 gives a patient trail that tolerates deep pullbacks but gives back more at the turn. A step of 0.03 or higher hugs price and exits fast, which suits scalping but courts early stops. Our parabolic SAR settings guide walks through how each dial changes the trail. Whatever you choose, test it across a range of trends before you trust it with real risk.
Filtering With a Trend Gauge
The SAR needs a partner, because it cannot tell a trend from a range on its own. Wilder himself paired it with a trend-strength gauge to skip the chop. So many traders add a directional or trend filter and take SAR flips only when that filter confirms a real trend. A moving average slope works too. When the average points up and the dots flip below price, the two agree, and the signal carries far more weight than a lone flip in a flat market.
For related trend tools, the trend indicators hub collects the systems that ride a directional move. If you want to understand the averages that often confirm a SAR signal, the SMA versus EMA guide shows how each responds to price.
Using the SAR as a Trailing Stop
The SAR earns most of its fans as a trailing stop, and this is where it shines. Once you are in a trend trade, the dot gives an objective, rules-based level to ride behind the move. No guessing, no emotion, just a stop that tightens as the trend matures. Two traders using the same setting get the same trail, which makes the exit repeatable. That objectivity is worth more than it first appears. Most trend trades die not from a bad entry but from a messy exit, where fear banks a winner far too early or hope holds a loser far too long. A mechanical dot answers both problems with the same rule, so the exit stops being an emotional decision and becomes a line you simply follow.
Riding a Trend to the Flip
The plan is simple to state. Enter a trend by your own method, then trail the stop on each new dot as it climbs beneath a long or falls above a short. Hold until price finally crosses the dots and the system flips. That flip marks your exit and, if you want, a reversal into the new direction. So the tool answers the hardest question in trend trading, which is when to get out, with a clear and mechanical rule.
Volatility and the Trail Width
Match the trail to the market’s noise. A quiet pair suits a tighter step, while a volatile pair needs a looser one so normal swings do not knock you out early. Reading recent range helps here, and the ATR guide shows how to measure that volatility directly. Combine the SAR for the trail with the ATR for context, and you set stops that respect how far the pair actually travels.
When to Take the Reverse Signal
A flip does two jobs at once, and knowing when to use each keeps you disciplined. In a strong, trending market you can treat a flip as both an exit and an entry, reversing straight into the new direction. In choppier conditions, though, taking every reverse is a fast way to lose. So use the flip as an exit always, but only reverse when a trend filter or clear structure backs the new side. That split rule captures the clean reversals while sparing you the endless whipsaws of a range. Treat the exit as automatic and the reversal as a choice you confirm.
Worked Example: A Parabolic SAR Flip Long on GBPUSD
Rules feel abstract until a real chart prices them, so walk through one. The chart below tracks a GBPUSD 1-hour sequence where a downtrend stalls and the SAR flips long off a base as buyers finally step in.
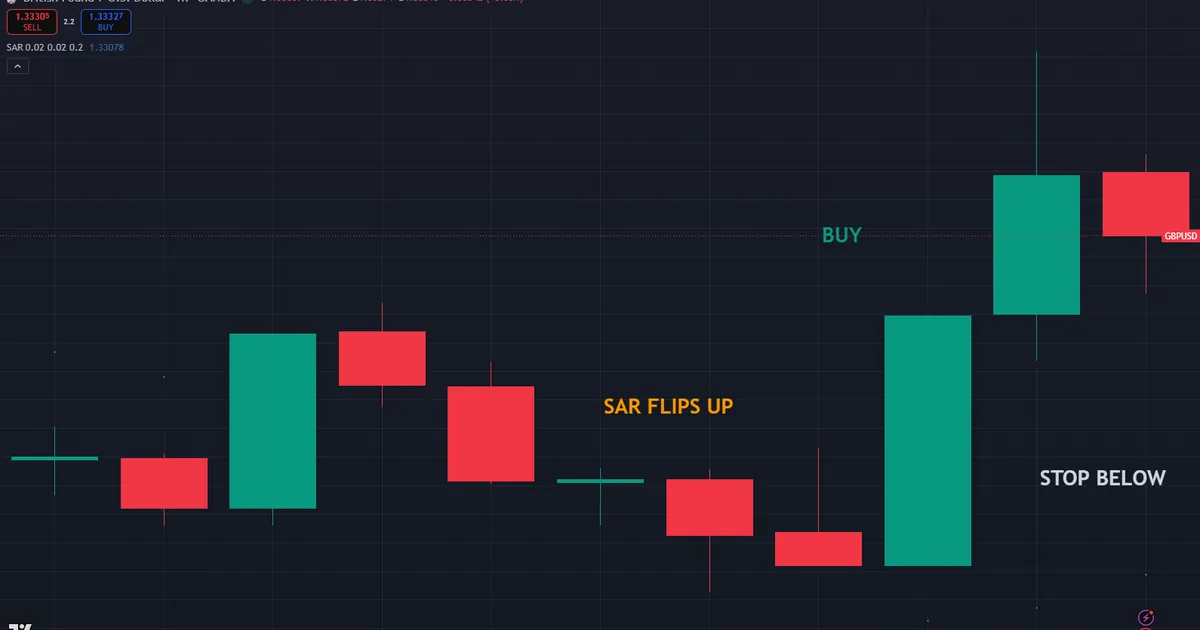
- First, the context: price had fallen for hours, with the dots trailing above each bar.
- Next, the stall: the decline lost pace, and price began carving out a base.
- Then the flip: a strong bar pushed up through the dots, so the SAR jumped below price and turned bullish.
- The confirmation: a rising moving average agreed, which backed the fresh long signal.
- Last, the trade: buy the flip, set the stop at the new dot, and trail each dot as price climbs.
The logic behind the entry matters more than the exact prices. A flip that lands where a downtrend was already tiring, and where a trend filter agrees, carries real weight. So the dots gave both the entry trigger and the initial stop in a single reading. As price rose, each new dot lifted the stop, locking in gains without a single discretionary decision along the way.
Managing the GBPUSD Trade
Manage the position with the tool that framed it. Ride the trail dot by dot, and let the next flip decide the exit rather than a gut feeling. Some traders bank a partial at a prior swing high and trail the rest on the dots, which locks a share of the move while leaving room to run. Choose one plan before entry and write it down. The SAR hands you a mechanical exit, and your journal keeps you honest about respecting it instead of jumping out early on a scary candle.
Download the complete indicator database
Put these concepts on your charts. One email unlocks the full library of 1,380+ indicators with compiled MT4 and MT5 files, plus my TradingView scripts. No paywall, no spam, unsubscribe any time.
Get free access to my indicator database
One email unlocks 1,380+ free MT4, MT5 and TradingView indicators — the complete library. No single-tool download; you get the whole database.
Common Parabolic SAR Mistakes and Their Fixes
SAR errors sink more trades than entry errors, and a few dominate beginner journals. Most come from trusting every flip in a market that has no trend to ride. Each mistake below carries a plain fix you can apply on the very next chart.
- Trading every flip in a flat range. Fix: add a trend filter and skip flips when the market is not clearly trending.
- Setting the step too high for the pair. Fix: loosen the step so normal swings do not stop you out early.
- Using the SAR as a standalone entry system. Fix: pair the flip with structure, a level, or a moving average for confirmation.
- Widening the stop past the dot on a losing trade. Fix: the dot is the stop, so honour it and let the flip do its job.
- Ignoring the higher-timeframe trend. Fix: take flips that agree with the larger direction and pass on the ones that fight it.
- Reversing on every single flip. Fix: in choppy conditions, wait for a confirmed trend before you act on a reversal.
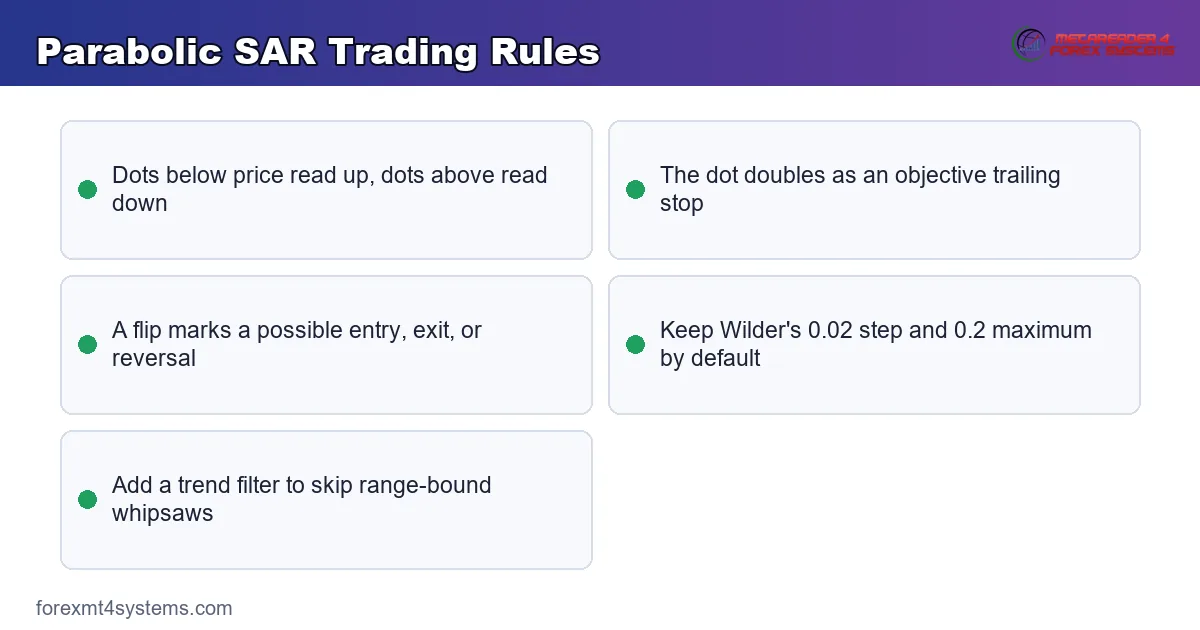
The second graphic pairs the core reading rules with the traps, so a quick glance before you commit keeps the common errors fresh.
A Parabolic SAR Pre-Trade Checklist
Run these seven lines before any entry or exit that leans on the SAR. A single failure sends the setup back to the watchlist.
- A clear trend exists on the timeframe you are trading.
- A trend filter or moving average agrees with the SAR’s direction.
- The dot has flipped to the side that matches your planned trade.
- The step and maximum suit the pair’s usual volatility.
- The initial stop sits on the new dot, not somewhere looser.
- The plan trails on each dot and exits on the next flip.
- The position size fits the stop distance, and the journal line is written first.
Also score a month of trades against this list. The line you skip most often is your real leak, and closing one leak beats collecting three new indicators.
When the Parabolic SAR Fails
The SAR breaks down in sideways markets, and this is its defining weakness. When price chops back and forth with no direction, the dots flip constantly, jumping above price and below it within a few bars. So a trader who obeys every flip buys the top of the range and sells the bottom, bleeding on each false turn. The tool is not broken here. It is simply built for trends, and a flat range gives it nothing useful to trail at all.
Gaps and sharp spikes cause the other trouble. A sudden news candle can leap past the dot and flip the system at a terrible price, well away from any sensible stop. Hence a filter and a calm head matter. Stand aside around major news, and only trust the SAR once a genuine trend has taken hold and the flips space out into a clean, one-way trail.
A Failure Walkthrough on EURUSD
One failure repeats more than the rest, and the chart below shows it. EURUSD drifts sideways in a tight range, and the SAR flips long. A trader buys the flip, only for price to stall and reverse within a few bars. The dots flip short, the long stops out, and the pattern repeats in the other direction.
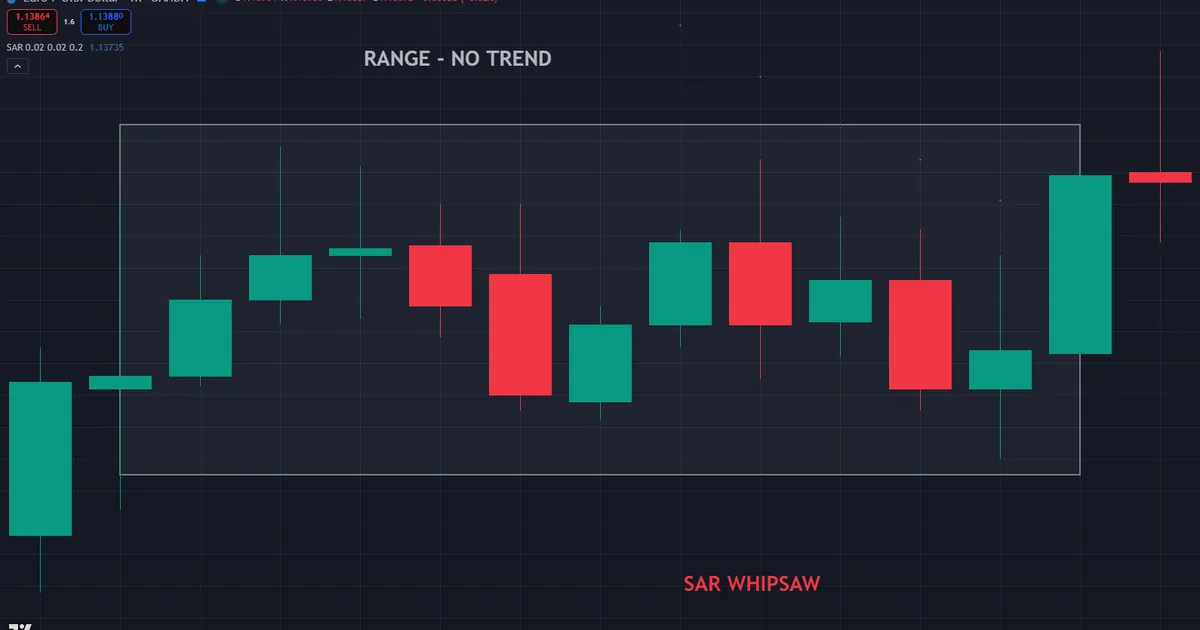
Resolution comes fast and teaches a clear lesson. Each flip fired inside a range that offered no trend to follow, so every signal was noise dressed as a setup. Thus the rule stays simple: confirm a real trend before you act on any SAR flip, and stand aside when the dots start ping-ponging across price. That single filter removes most of these whipsaw losses. Log every flip you skipped in a range, and you will see how much capital the discipline saved over a full month of trading.
Related Concepts to Study Next
The parabolic SAR sits alongside several tools worth learning together. The CCI indicator guide and the stochastic oscillator guide both cover momentum tools that can confirm whether a fresh SAR flip has real force behind it. For the averages that so often confirm a flip, the moving average indicators hub gathers the trend systems that pair well with the dots. Read a flip against one of these, and a weak signal quickly stands apart from a strong one.
A mechanical trail only helps if your size fits the stop. The position size calculator turns the distance from entry to the first dot into a lot size that matches your risk, so a tight SAR stop never forces an oversized position. Read the dots for the exit, and let the calculator keep the risk in line. A tight SAR stop can tempt you to load up because the loss per trade looks small, yet a whipsaw string of small losses still adds up fast. So set the size from your account risk, not from how close the dot happens to sit.
FAQ
What is the parabolic SAR in simple terms?
The parabolic SAR plots a dot above or below each price bar to show the current trend and a trailing stop. Dots below price mean an uptrend, and dots above mean a downtrend. When price crosses the dots, the system flips to the other side. Traders use it to trail stops and to signal when a trend may be turning.
What are the best parabolic SAR settings?
Wilder’s defaults are a 0.02 step and a 0.2 maximum, and they suit most traders on most timeframes. A smaller step trails looser and rides deeper pullbacks, while a larger step hugs price and exits faster. No single setting fits every pair, so test one configuration across several trends before you commit real capital to it.
Is the parabolic SAR a good trailing stop?
Many traders like it for exactly that job because it gives an objective, rules-based stop that tightens as a trend matures. The dot removes guesswork and emotion from the exit. It works best in clean trends, though, so pair it with a trend filter and stand aside in ranges, where constant flips make the trail unreliable.
Why does the parabolic SAR whipsaw so much?
It whipsaws in sideways markets by design. The tool is built to follow trends, so when price has no direction, the dots flip back and forth across the range. Each flip looks like a signal but leads nowhere. The fix is a trend filter that keeps you out of the SAR when no real trend exists to follow.
Can I use the parabolic SAR by itself?
You can, but most traders get better results by combining it with another tool. Wilder himself suggested pairing it with a trend-strength gauge to filter out ranges. A moving average slope or clear market structure also confirms the direction of a flip. The SAR handles the trailing stop, and the second tool decides whether the trend is worth trading.
Does the parabolic SAR repaint or change past dots?
No, the dots for closed bars stay fixed once each bar completes, so the historical trail does not move. The current, forming dot can still shift until the bar closes, which is normal for any live calculation. Always judge a flip on closed bars to avoid acting on a value that has not settled. Results are not guaranteed; past performance is not indicative of future results.
External references
- For background on this concept, see Parabolic SAR at Corporate Finance Institute.
- For broader market context, see J. Welles Wilder on Wikipedia.

About the author
Written by Dominic Walsh, a Forex trader and MT4/MT5 indicator, Expert Advisor and script developer. Every tool on forexmt4systems.com is tested on live charts before release and ships with ready-to-use compiled MT4 (.ex4) and MT5 (.ex5) files. Learn more about the trader and developer behind this site.
How we build, test and correct every tool: Editorial & Testing Policy. Trading carries risk; see the disclaimer.