
Sentiment gauges attract traders because they promise a shortcut. So it pays to learn how to use the fear and greed index properly before you let it near a decision.
The short answer sets the tone for everything below. It works as context about crowd positioning, never as an entry trigger, and it measures a US stock market rather than currencies.
What the Fear and Greed Index Actually Measures
CNN publishes the best-known version. The gauge scores investor sentiment in the United States equity market on a scale from zero to one hundred.
Zero reads as extreme fear, and one hundred reads as extreme greed. Fifty sits in the middle, which the publisher describes as neutral.
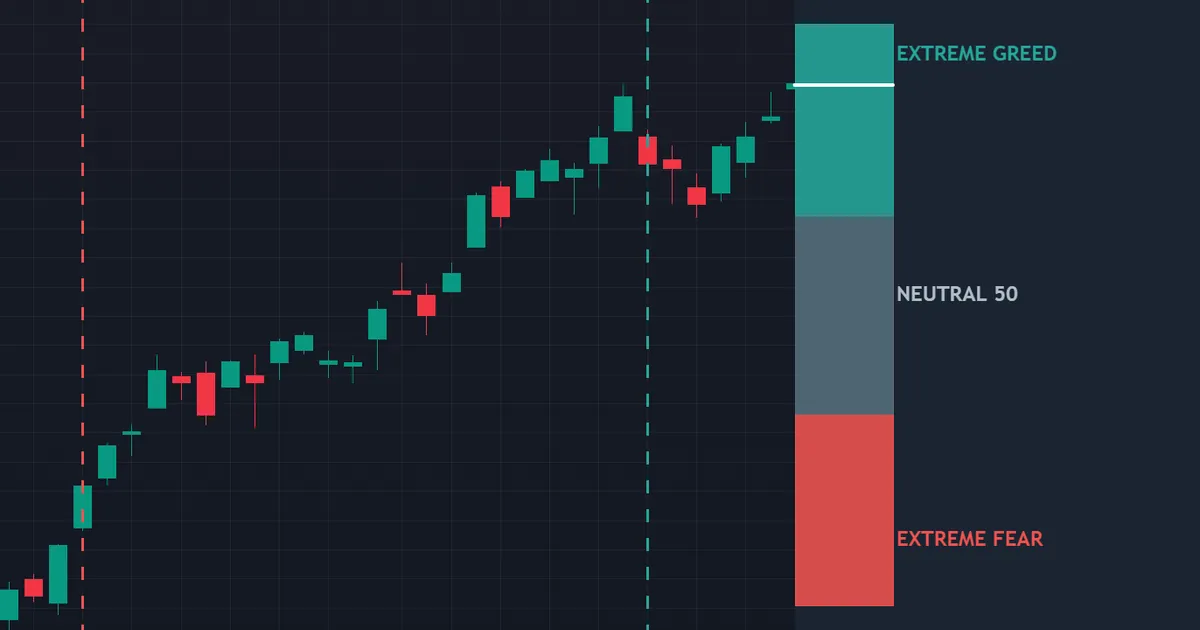
The panel above shows the idea in practice. A sentiment gauge sits beside a US equity index, with the extremes marked so the crowd mood becomes visible.
Notice what the picture does not tell you. The gauge describes conditions rather than direction, so it never names a level, a target or a trade.
That gap explains most of the disappointment around sentiment tools. People arrive looking for a trigger and leave with a weather report.
Who Publishes It and Why
CNN Business maintains the index and updates it through the trading day. The purpose runs closer to journalism than to signal generation.
It summarises several market measures in one number. Because a single figure travels well in headlines, the gauge became famous far beyond its original audience.
The Seven Inputs
Seven market indicators feed the model. Read them once, and the gauge stops looking like a mood ring.
- Market momentum. How far the S&P 500 sits above or below its 125-day moving average.
- Stock price strength. The count of shares hitting 52-week highs against those hitting lows.
- Stock price breadth. Trading volume in advancing shares compared with declining shares.
- Put and call options. The ratio of puts to calls, which shows demand for protection.
- Market volatility. The VIX measured against its own 50-day average.
- Safe haven demand. The difference between recent stock returns and bond returns.
- Junk bond demand. The yield spread between high-yield debt and safer investment-grade debt.
Each input gets scored against its own recent history. So the model asks how unusual today looks, rather than how high or low a number sits.
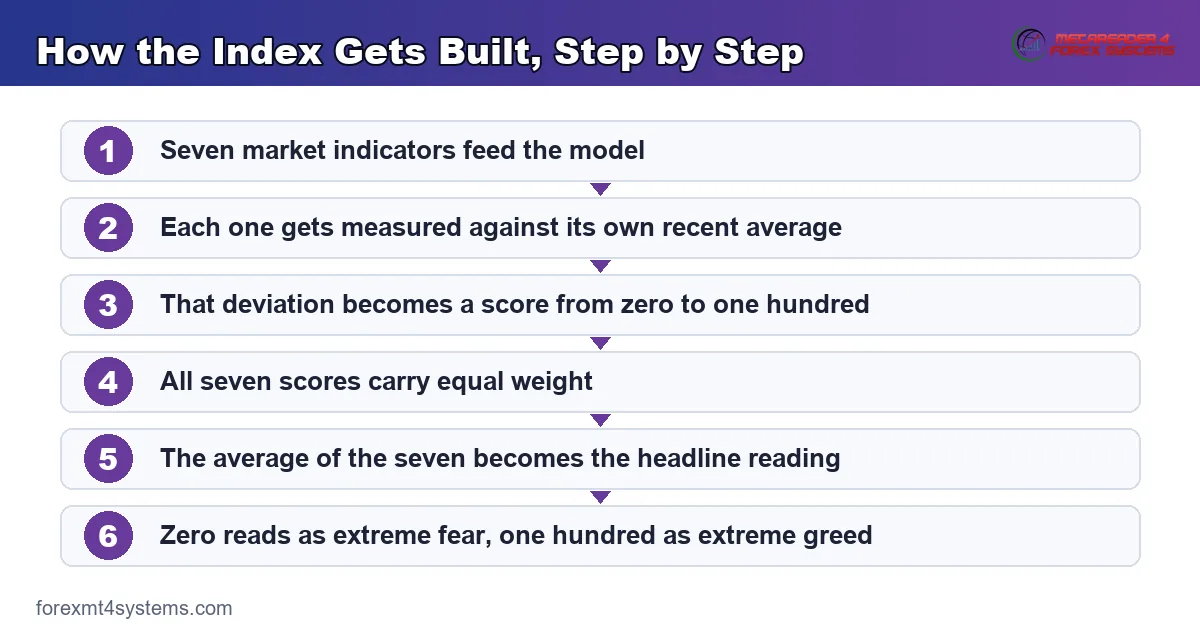
The flow graphic follows that construction end to end. Seeing the pipeline makes the output far easier to judge.
How the Scores Combine
CNN measures how far each indicator has moved from its own average, relative to its normal swing. Every input then carries equal weight.
The seven scores get averaged into the headline number. Because no input dominates, a single extreme reading rarely swings the whole gauge on its own.
How the Bands Get Labelled
The scale carries labels as well as numbers. Readings near the bottom get called extreme fear, and readings near the top get called extreme greed.
Most published versions split the range into five bands. Roughly the lowest quarter reads as extreme fear, the band above it as fear, the middle as neutral, then greed, then extreme greed above about seventy-five.
Treat those cut-offs as convenient rather than precise. Because a reading of seventy-four behaves almost identically to one of seventy-six, the band boundary carries no special meaning.
The Crypto Version
A separate crypto gauge runs on the same zero to one hundred scale. It uses different inputs, including volatility, trading volume, social media activity and search interest.
Treat the two as cousins rather than twins. So a reading on one says nothing reliable about the other, and neither one covers currencies.
What the Index Does Not Measure
Most misuse starts with a misunderstanding of scope. Three limits matter more than any reading.
Learn them first, and the tool becomes genuinely useful. Skip them, and it becomes an expensive distraction.
It Is Not a Forex Indicator
Every input comes from US stocks, US options or US bonds. No currency pair appears anywhere in the model.
So a reading tells you about equity risk appetite, which spills into currencies only indirectly. For a direct read on currency behaviour, our free currency strength meter measures the pairs themselves.
It Is Not a Forecast
The gauge describes the present, built from data already printed. Nothing inside it predicts the next session.
So the number carries no timing information. Because extremes can persist for weeks, acting on the reading alone leaves you early and exposed.
It Is Not a Measure of Volume or Conviction
A reading of ninety does not mean everyone feels greedy. It means seven indicators sit unusually far from their own averages in the same direction.
That distinction matters. So describe the output as crowd positioning rather than as crowd emotion, since the model never surveyed anyone.
It Says Nothing About One Company
The model aggregates a whole index and the instruments around it. Individual shares disappear inside that average.
So a stock trader gains context rather than a stock idea. Because breadth measures the crowd, it cannot describe any single name within it.
How to Use the Fear and Greed Index, Step by Step
The tool earns its place as a context layer. Six steps keep it in that role.
Run them weekly rather than hourly. Because the inputs move slowly, a daily check adds noise without adding information.
The Six Steps
Work through them in order, and write the output in your journal.
- Record the reading once a week. Note the number and the label beside your weekly review.
- Note the direction of travel. A move from thirty to sixty matters more than either figure alone.
- Check the inputs behind a big move. A jump driven by volatility differs from one driven by breadth.
- Ask what it implies for risk appetite. Extreme greed usually coincides with crowded positioning.
- Adjust exposure, not direction. Extremes justify smaller size, never a new trade idea.
- Log what you did and why. Your own record decides whether the input helps at all.
Notice that no step names an entry. So the gauge shapes how much you risk, while your strategy still decides what you trade.
What to Write in the Journal
Four fields keep the record useful. Note the date, the reading, the direction since last week, and what you changed.
Add nothing else. Because a short field gets filled every week, brevity beats detail here, and twelve months of that record answers the value question for you.
The Contrarian Reading
Contrarian investors read extremes as evidence of crowding. Extreme greed suggests most buyers have already bought, while extreme fear suggests most sellers have already sold.
That logic has a long history in markets. It also fails often enough that nobody sensible trades it alone, since crowded conditions can grow more crowded for months.
Where It Fits in a Forex Plan
Currency traders use it as a risk-appetite backdrop. Extreme fear in US equities often coincides with demand for the dollar, the yen and the franc.
Often, though, does not mean reliably. So pair the reading with something that measures your own market, such as a volatility filter or the economic calendar for the week ahead.
Building a Written Rule Around the Reading
Loose use of any sentiment tool decays into guesswork. A written rule keeps the gauge in the role it can actually fill.
Three clauses cover it. Write them once, then change them only at a scheduled review.
Define the Trigger Condition
Name the exact reading that activates the rule. Something like a weekly close above seventy-five or below twenty-five works well.
Write the source alongside it, since copies differ from the published gauge. Because ambiguity kills rules faster than anything else, leave no room for interpretation.
Define the Response
State what changes, and state what stays the same. Halve the risk per trade, cap open positions at two, and leave strategy selection untouched.
Notice that the response never adds a trade. So the rule can only reduce exposure, which keeps it honest during a tempting week.
Define the Restore Condition
Say precisely when normal size returns. Two consecutive weekly readings back inside the neutral band gives a clean, checkable answer.
Without that clause, impatience decides instead. Because traders restore size on feeling rather than on evidence, the missing clause undoes the whole rule.
A Worked Example of Context Use
Numbers make the idea concrete, so follow one simple case. The figures show the mechanics and predict nothing about your own results.
Picture a twenty thousand dollar account with a one percent rule. Each trade risks two hundred dollars, and the plan allows three open positions.
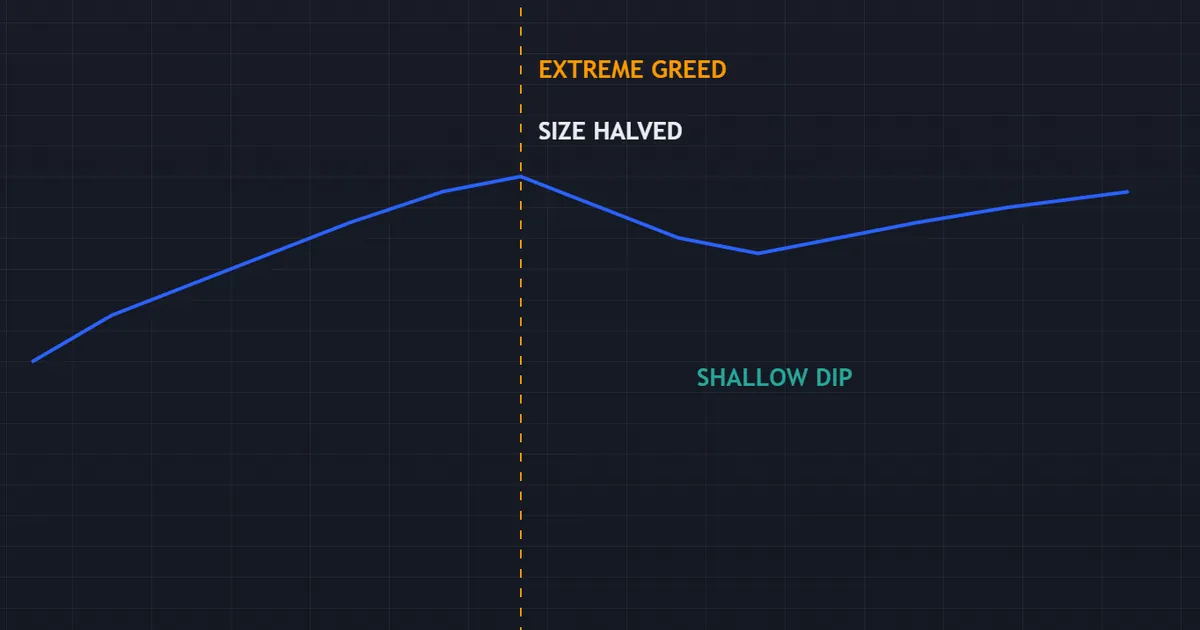
The weekly review shows the gauge deep in extreme greed. Your written rule says to halve risk whenever the reading sits at either extreme.
So each trade now risks one hundred dollars instead of two hundred. Nothing else in the plan changes, and no new trade appears.
What Happens Next
A sharp reversal arrives, and all three positions stop out. The account gives back three hundred dollars rather than six hundred.
That difference looks small in one week. Across a year of extremes, it compounds into a very different drawdown profile.
The Same Week Without the Context
Now replay the week with full size and no adjustment. The account drops six hundred dollars, or three percent.
Recovery then needs roughly double the gain. So the reading did not predict the reversal. It simply reduced what the reversal cost.
What the Example Leaves Out
This case assumes the extreme preceded a reversal, which often fails to happen. Sizing down during a long greedy run also costs you gains.
So the adjustment behaves like insurance rather than like an edge. Judge it across dozens of extremes, never across one.
Insurance carries a premium, and this one shows up as smaller gains during strong runs. Decide whether you accept that trade-off before the next extreme arrives.
The Limits You Need to Respect
Every sentiment gauge carries the same family of weaknesses. Five of them matter here.
Read them before you build any rule around the number. Because the failures repeat, you can plan for them.
Extremes Can Persist
The gauge sits in extreme greed for weeks during strong trends. Anyone fading it on day one spends a long time wrong.
So treat an extreme as a state rather than as an event. The exit from an extreme carries more information than the extreme itself.
The Inputs Overlap
Volatility, options demand and breadth all respond to the same market stress. That overlap makes the seven inputs less independent than the equal weighting suggests.
So a single shock can push several inputs together. Because of that, the gauge swings faster than the underlying mood really shifts.
It Describes One Market
The model covers large US shares and the instruments around them. It says nothing about European equities, commodities or currency pairs.
So a forex trader borrows the reading rather than owning it. Keep that borrowing explicit in your notes, since it limits how much weight the number deserves.
The Reading Lags Its Own Inputs
Moving averages and 52-week counts respond slowly by design. The gauge therefore confirms conditions rather than announcing them.
So the number often peaks after the crowd already moved. That lag matters most for short-term traders, who need faster information than this tool provides.
Clean Testing Runs Into Trouble
Long, consistent history for the published gauge sits behind the publisher’s own site. Reconstructions rely on assumptions about weighting and windows.
So any backtest you build inherits those assumptions. Because the methodology has evolved, results from a homemade series deserve heavy caution rather than confidence.
Copies Differ From the Original
Third-party charts and scripts recreate the index with their own approximations. Values then differ from the published gauge.
So check which version you read before you compare readings over time. Because methodology drives everything here, mixing sources creates a record you cannot trust.
Download the complete indicator database
Put these concepts on your charts. One email unlocks the full library of 1,380+ indicators with compiled MT4 and MT5 files, plus my TradingView scripts. No paywall, no spam, unsubscribe any time.
Get free access to my indicator database
One email unlocks 1,380+ free MT4, MT5 and TradingView indicators — the complete library. No single-tool download; you get the whole database.
Common Mistakes and the Fix
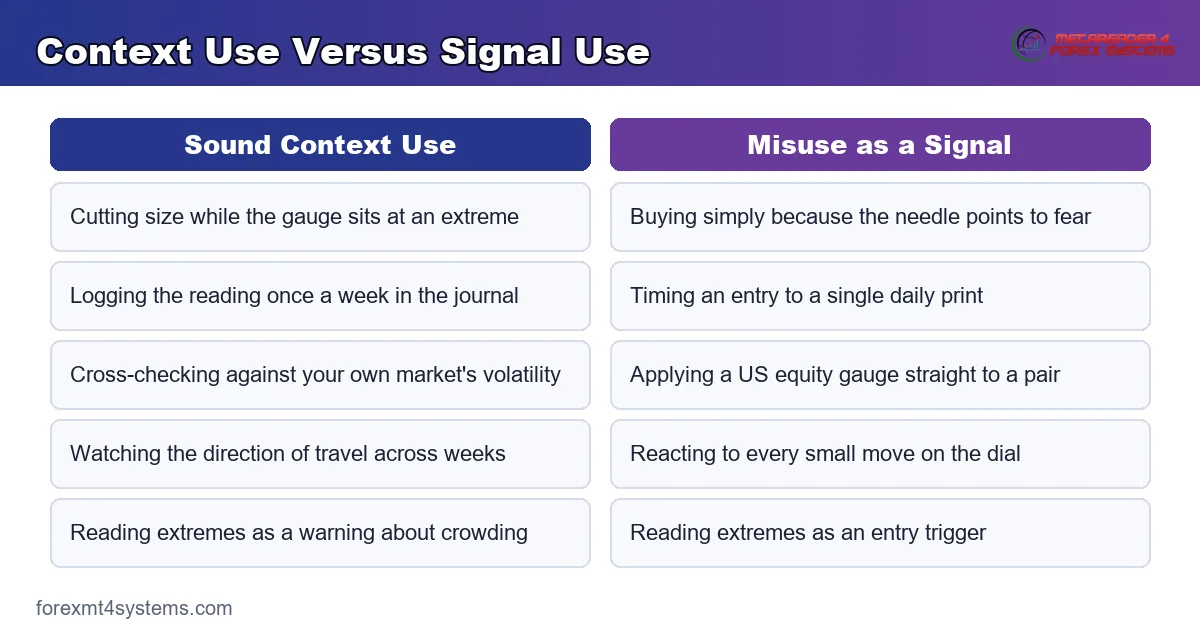
The same errors show up wherever this gauge appears. The comparison graphic below sets sound context use beside the misuse that follows it.
Treating a Reading as an Entry Signal
A number on a dial names no level, no stop and no target. Trades need all three. Let the gauge adjust size, and let your strategy choose the trade.
Applying It Straight to a Currency Pair
The inputs contain no currency data at all. A forex trader who trades the reading directly is guessing. Use a measure built on the market you actually trade.
Reading It Every Hour
The inputs update slowly, so intraday checking produces noise. Record it weekly, and compare across months instead of sessions.
Fading Every Extreme
Extremes persist, and fading them early is expensive. Wait for the exit from an extreme, and confirm with your own market before acting.
Ignoring the Inputs Behind a Move
A shift driven by junk bond spreads means something different from one driven by option demand. Open the components, and read what actually moved.
Mistaking Sentiment for Your Own Emotions
The gauge measures the market rather than the trader. Our guide to controlling fear and greed in trading handles the personal side, which needs different tools entirely.
Quick Reference Checklist
Keep this list beside your weekly review. Run through it whenever the gauge reaches an extreme.
Eight lines carry the whole argument. Read them before you write any rule, since most misuse starts with a scope mistake rather than a maths one.
- The index scores US equity sentiment from zero to one hundred.
- Seven inputs feed it, each scored against its own recent average.
- The crypto version uses different inputs and covers a different market.
- No currency data appears anywhere in the model.
- Direction of travel carries more information than the level.
- Extremes justify a change in size, never a change in strategy.
- Extremes can persist for weeks, so fading them early costs money.
- Record the reading in your journal, then judge it across many extremes.
Pitfalls and What Goes Wrong
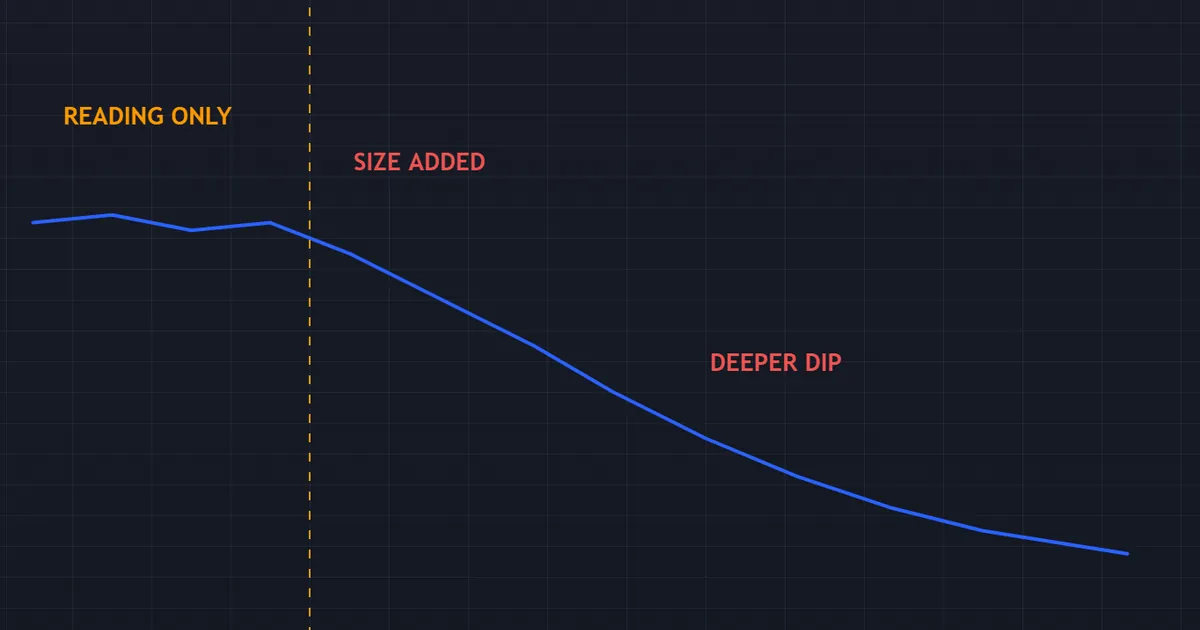
A few wrinkles bend the clean picture, so keep them in view. The panel below shows an account that added exposure on a reading alone.
Confirmation Creeps In
Traders check the gauge after forming a view, then read it as agreement. Record your view before you look, so the order of operations stays honest.
The Reading Becomes an Excuse
A losing trade gets blamed on extreme greed rather than on a broken rule. Our guide to why traders lose money covers the causes that actually dominate.
Extremes Attract Crowded Trades
Everyone reads the same gauge, so the obvious trade fills poorly. Check your own exposure across correlated positions with our note on portfolio heat before adding anything.
Two Sources Disagree Mid-Week
A dashboard, a chart script and the publisher’s page can all print different numbers on the same day. Pick one source, write its name in the rule, and ignore the others entirely.
Halved Size Feels Like Weakness
Traders often restore full size within days out of impatience. Write the restore condition in advance, and let the calendar decide rather than the mood.
The Gauge Fuels a Different Fear
Extreme greed readings pull people into trades they never planned. Our guide to fear of missing out explains that pull and how to blunt it.
When the Gauge Says More About You
Checking a sentiment dial repeatedly usually signals anxiety rather than analysis. If you refresh it between trades, the problem sits closer to home.
Some situations run past technique entirely. If trading disturbs your sleep, strains your finances or damages your relationships, step away from the market and speak to a qualified professional. Support services exist for exactly that, and nothing written here replaces them.
Related Concepts to Study Next
Sentiment sits inside a wider toolkit, so a few neighbouring topics repay an hour of reading. Each one strengthens the part of the plan this gauge cannot reach.
Pair the sizing rule above with our guide to the risk reward ratio, which decides what each trade needs to earn. Then keep a weekly note of the reading and your response in our free trade journal, since your own record settles the question faster than any article.
FAQ
How do I use the fear and greed index as a forex trader?
Read it weekly as a backdrop for risk appetite, and let it adjust your position size at extremes. It contains no currency data, so it never selects a pair or a direction. Pair it with a measure built on the market you actually trade.
What do the numbers mean?
The scale runs from zero to one hundred, where zero reads as extreme fear and one hundred as extreme greed. Fifty sits at neutral. The publisher bands the middle range into fear, neutral and greed, though the exact bands matter less than the direction of travel.
Is a low reading a buy signal?
No. A low reading describes crowded fear, which can deepen for weeks. Contrarian investors treat extremes as a reason to look for opportunities, not as a trigger, and they still need a level, a stop and a target from somewhere else.
How often does it update?
The published gauge refreshes through the US trading day. Its inputs move slowly, so weekly readings carry almost all of the useful information. Hourly checking mostly adds noise to your decisions.
Is the crypto version the same thing?
No. The crypto gauge uses its own inputs, including volatility, volume, social activity and search interest. It shares the zero to one hundred scale and nothing else, so never read one as confirmation of the other.
Which sentiment tool suits a currency trader better?
Measures built on currencies themselves carry far more weight. Positioning reports, option volatility for major pairs, and a strength meter across the majors all describe the market you trade. Keep the equity gauge as background colour rather than as the main input.
Does adding this to my plan improve results?
It can reduce what a crowded reversal costs, provided you use it for sizing rather than for entries. Judge it across dozens of extremes and a full year of data, using your own journal. Results are not guaranteed; past performance is not indicative of future results.
External references
- For background on this concept, see Fear and Greed Index at Investopedia.
- For broader market context, see Contrarian Investing on Wikipedia.

About the author
Written by Dominic Walsh, a Forex trader and MT4/MT5 indicator, Expert Advisor and script developer. Every tool on forexmt4systems.com is tested on live charts before release and ships with ready-to-use compiled MT4 (.ex4) and MT5 (.ex5) files. Learn more about the trader and developer behind this site.
How we build, test and correct every tool: Editorial & Testing Policy. Trading carries risk; see the disclaimer.