
The right Parabolic SAR settings for day trading come down to two numbers, and most traders never touch them. The step and the maximum step control how quickly the tool reacts, so tuning them changes every dot you see on the chart.
This guide shows you how those two inputs work and how to adjust them for a fast intraday chart. So by the end, you will know when to leave the defaults alone, when a smaller step helps, and why a trend filter turns Parabolic SAR from a whipsaw machine into a useful trailing stop.
Best Parabolic SAR Settings for Day Trading
Parabolic SAR is a trend-following tool from J. Welles Wilder, the same author who built RSI. The name stands for Stop and Reverse, which describes exactly what it does. It plots a trail of dots that sit below price in an uptrend and above price in a downtrend.
The dots track price like a trailing stop. So when price crosses the dots, the tool flips to the other side and signals a possible change of direction. That single behavior gives you a trend read and an exit level in one glance.
Look at a concrete reading first. The chart shows GBPUSD on the five-minute timeframe during the New York session. The dots ride below a steady climb, then flip above price as the move stalls and rolls over.

Now trace what those flips tell you. First, the dots hugged the trend and trailed the advance. Then the flip warned that momentum had turned. Because the flip came after a clear run, it carried more weight than a flip inside choppy candles. That context is the key, and it matters far more than the exact step you dialed in.
So the honest starting point is this. The default settings work well in trends and poorly in ranges. Instead of hunting a perfect number, you tune the step to your speed and pair the tool with a filter that keeps you out of chop.
How Parabolic SAR Is Calculated
The math behind the dots explains why the settings matter. The tool builds each dot from the last one, an extreme price, and an acceleration factor. The steps below show the flow in plain terms.
- Track the extreme. In an uptrend, the tool records the highest high reached so far, called the extreme point.
- Hold an acceleration factor. This factor starts at the step value and rises as the trend extends.
- Move the dot each bar. The dot shifts toward price by the factor times the gap to the extreme point.
- Speed up on new extremes. Each fresh high lifts the factor by one step, up to the maximum cap.
- Flip on a cross. When price trades through the dot, the tool reverses and starts a new trail the other way.
So two inputs steer the whole system. The step, or acceleration factor, sets how fast the dots close in on price. The maximum step caps how aggressive that acceleration can ever get. Together they decide how tightly the trail follows the move.
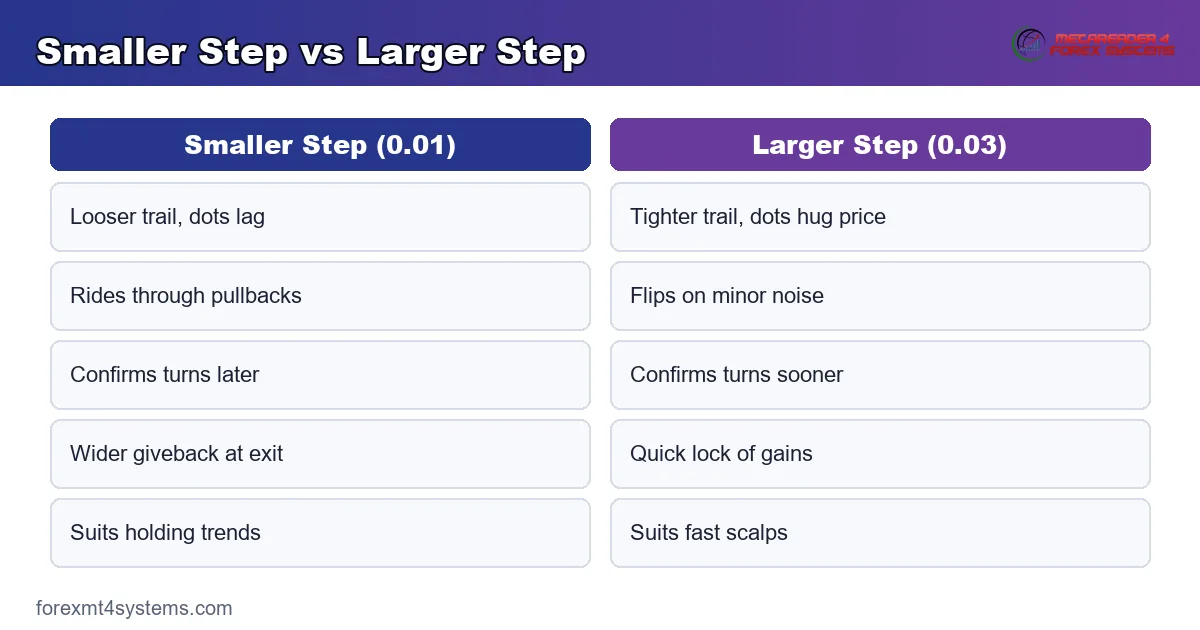
Here is the practical version. A larger step tightens the trail, so the dots catch price sooner and flip more often. Meanwhile, a smaller step loosens the trail, so the dots lag and flip less. The default balances the two for general use.
Tuning the Step and Maximum Step
Match the two inputs to your chart speed, not to a random preset. The standard values give you a sensible baseline to test against.
The Default 0.02 and 0.20
Wilder set the step at 0.02 and the maximum at 0.20, and those numbers remain the platform default. So the acceleration begins at 0.02 and climbs by 0.02 on each new extreme until it reaches 0.20. On the five and fifteen-minute charts, this pairing tracks clean trends well without flipping on every wiggle.
Start here before you change anything. Then adjust only if your testing shows a real gain on your own pairs and sessions.
A Smaller Step for Smoother Trails
Fast intraday charts are noisy, so many traders lower the step to 0.01. This smaller value loosens the trail and lets the dots sit further from price. So the tool rides through small pullbacks instead of flipping on them.
Yet the cost is patience. A looser trail gives back more profit before it flips, and it confirms a turn later. Because of that, a smaller step suits traders who want to hold a trend and accept a wider giveback at the exit.
A Larger Step for Quicker Exits
Some scalpers raise the step to 0.03 instead. This larger value tightens the trail, so the dots hug price and flip sooner. That quick reaction helps a trader who wants to lock gains fast on a short hold.
The trade-off is obvious. A tighter trail flips on minor noise, so it prints more false reversals. Hence a larger step demands an even stronger filter to keep those quick flips from turning into a string of small losses.
Parabolic SAR as a Dynamic Trailing Stop
The clearest use of the dots is stop management. A fixed stop sits in one place, but the SAR trail moves with price on every bar. So as a trend extends, the dots ratchet closer, and they lock in more of the open gain automatically.
Here is why that helps intraday. A day trader rarely has time to nudge a stop by hand on a fast chart. The trail does that work for you, and it never loosens once it has tightened. So the tool enforces a discipline that many traders struggle to hold on their own.
Yet the trail has one firm rule. It only tightens, so it can sit far from price early in a move and close in later. Because of that, the first few bars after a flip carry the widest risk. Size the trade to that early distance, not to the tight stop the dots reach later.
Then let the flip end the trade. When price finally trades through the dots, the trail flips and marks your exit. So the same tool that entered the idea also closes it, which keeps the whole trade mechanical from start to finish.
Pairing Parabolic SAR With a Strength Filter
The dots cannot measure how strong a trend is, only its direction. So a strength filter fills that gap neatly. Many traders add the Average Directional Index (ADX) beside the SAR for exactly this reason.
The pairing follows a simple rule. When ADX reads above 25, a trend is present, so SAR flips carry more weight. When ADX drops below 20, the market is likely ranging, so you skip the flips and wait. Because the two tools answer different questions, they cover each other’s blind spots.
A moving average works just as well for many traders. When a rising average holds under price, it confirms an uptrend, so you take only the upward flips. Likewise, a falling average over price confirms a downtrend, so you keep to the downward ones. Either filter keeps you out of the chop that ruins a lone SAR system.
So the lesson repeats across every trend tool. Direction alone is not enough, and strength gives the missing context. Pair the dots with one filter you trust, then act only when both agree.
Parabolic SAR Across Timeframes
The dots behave the same on every chart, but the timeframe changes their pace. On a one-minute chart, the SAR flips constantly, so it suits only the fastest scalps with a tight filter. On the five and fifteen-minute charts, the flips slow down and track intraday trends more cleanly.
So most day traders read two timeframes at once. A higher chart, such as the hourly, sets the trend direction. Then the lower chart, such as the five-minute, gives the SAR flip and the trailing stop. Because the higher timeframe filters the noise, the lower one can act with more confidence.
Then keep the step consistent with the speed. Faster charts flip more, so a smaller step often smooths them without much lag. Slower charts flip less, so the default step usually tracks them well. Match the two, and the trail stays sensible on whatever timeframe you trade.
Where Parabolic SAR Fits Your Workflow
Parabolic SAR works best as a trailing stop and a trend cue, never as a lone entry trigger. Slot it into a simple routine, and its flips become far more reliable.
First, define the trend with a separate filter. A rising moving average or a higher-timeframe read tells you which way to lean. So you take SAR flips that agree with that trend and skip the ones that fight it.
Then use the dots to manage the trade, not to start it. Once a setup triggers on your own rules, the SAR trail gives you a clean, mechanical stop that ratchets with the move. Our guide to what Parabolic SAR is covers the flip logic in more depth.
Also pair it with a volatility read. The dots ignore how wide the candles are, so a fixed trail can sit too tight in a fast market. Our guide to ATR in trading shows how to gauge that range, and the volatility indicators archive collects tools that measure it.
Finally, size the trade before you commit. The SAR flip sets your exit, so the distance to it sets your risk. Our free position size calculator turns that stop distance into a lot size, so a single flip against you stays small.
Reading SAR Flips Around Key Levels
A flip means more when it lands at a level that already matters. So a chart with marked support and resistance filters the weak flips from the strong ones. The dots alone ignore those levels, which is why context lifts their value.
Picture a flip to the downside right at a session high. Price ran into resistance, stalled, and the dots then jumped above the candles. Because two signals agree at the same spot, that flip carries real weight. Traders often act on it faster than on a flip in open space.
Now picture the opposite trap. A flip fires in the middle of a range, far from any level, on a single spike. That flip has little behind it, so it often reverses within a few bars. Hence the habit that saves trades: mark your levels first, then judge each flip by where it prints.
Then combine the level read with your trend filter. When a flip agrees with the trend and sits at a level, the setup is at its cleanest. Meanwhile, a flip that fights the trend or floats in empty space usually deserves a pass.
Worked Example: A Trend Trade With SAR
Walk through a full read on GBPUSD, step by step. A trend filter points up, since a rising twenty-period moving average holds under price through the New York open.
Now the setup builds on the five-minute chart. Price pulls back, the SAR dots flip below price, and the flip agrees with the up filter. So both the trend and the trail point the same way at the same moment.
Then the trigger fires. Price closes back above the small swing high that capped the pullback, confirming the flip. The chart below marks the SAR flip, the trend filter, and the entry candle.
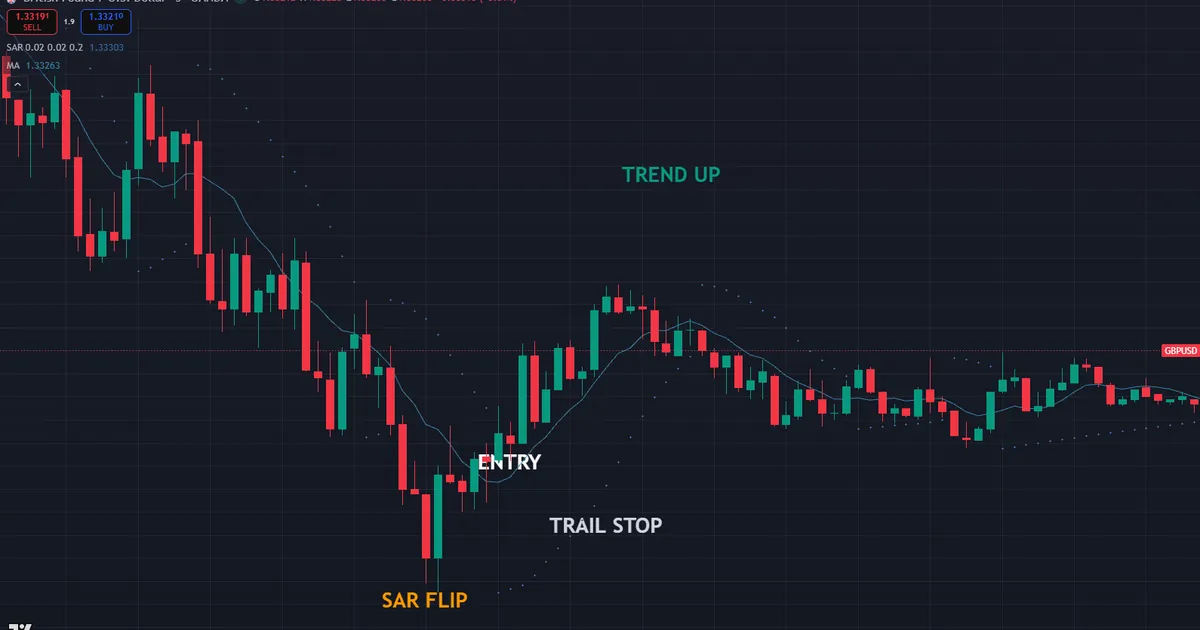
Here the trade defines itself. A long enters on that close, and the SAR dots become the trailing stop. As price climbs, the dots ratchet up beneath it, so the stop tightens automatically. Meanwhile, the trade rides until the dots finally flip above price and end the run.
So notice the division of labor. The trend filter gave permission, the entry rule gave the trigger, and the SAR trail gave the exit. Because each piece did one job, the process stayed clean and mechanical from start to finish.
Download the complete indicator database
Put these concepts on your charts. One email unlocks the full library of 1,380+ indicators with compiled MT4 and MT5 files, plus my TradingView scripts. No paywall, no spam, unsubscribe any time.
Get free access to my indicator database
One email unlocks 1,380+ free MT4, MT5 and TradingView indicators — the complete library. No single-tool download; you get the whole database.
Common Parabolic SAR Mistakes and Fixes
The tool looks simple, yet the same errors trap new day traders. The graphic below groups the traps, and the fixes follow beneath it.

Trading Every Flip in a Range
In a sideways market, the dots flip on nearly every swing, and each flip loses. So check for a trend first, and stand aside when price drifts inside a flat box. SAR rewards clear direction and punishes chop.
Using SAR With No Trend Filter
The dots alone cannot tell a trend from a range. Instead, pair them with a moving average or a higher-timeframe read, and take only the flips that agree with that larger direction.
Setting the Step Too High
A step near 0.05 or higher tightens the trail so much that it flips on tiny noise. Hence keep the step at 0.03 or below for day trading, and lean on the 0.02 default unless testing proves a change helps.
Treating a Flip as a Full Signal
A flip marks a possible turn, not a confirmed entry. Truly, it works best as a stop and a cue rather than a standalone trigger. So wait for price to confirm the flip with a close or a level break before you act.
Ignoring Volatility
The dots do not know how wide the candles are. So in a fast session, a fixed trail can sit too tight and stop you out early. Read the range first, and widen your view of the trade when volatility spikes.
Pre-Trade Parabolic SAR Checklist
Run this short list before every intraday trade. A few seconds here keeps you out of the range traps that drain accounts.
- A clear trend confirmed by a separate filter, such as a moving average.
- The SAR flip pointing the same way as that trend.
- Step and maximum step set on purpose, with 0.02 and 0.20 as the baseline.
- A trigger present, such as a close through a swing high or low.
- Volatility checked, so the trail is not obviously too tight for the session.
- An active session open, London or New York, rather than dead hours.
- Stop distance and position size set before the entry goes live.
When Parabolic SAR Settings Fail
Study the failure case as hard as the winner. Here is the classic one. Price drifts sideways in a tight New York afternoon range, and a trader takes every SAR flip expecting a clean trend to start.
Then the range punishes each trade. The dots flip above price, then below, then above again, and every flip reverses within a few candles. The chart below shows that whipsaw and the string of small losses beneath it.

So what went wrong? The settings were fine, but the market had no trend to follow. Parabolic SAR assumes direction, and a flat range gives it none. Hence the fix that saves the account: confirm a trend with a filter before you trust a single flip, and stand aside when price drifts in a box.
Then log the trade while it stays fresh. Note the pair, the session, the step you used, and whether a real trend was present. Review a few dozen of these, and the pattern is stark. Our free trade journal makes that review quick, and the failed flips almost always cluster in ranging hours.
Fast News Spikes Break the Trail
Be honest about one more weak spot. Around a sharp news spike, price can gap through the dots and flip them instantly, then reverse just as fast. So treat SAR flips during high-impact news with caution, and let the first wild candles settle before you trust any flip.
Related Concepts to Study Next
Parabolic SAR connects to a web of trend and volatility ideas, and a couple deserve your next reading hour. The broader family of trend indicators shows other ways to confirm the direction SAR needs. Meanwhile, momentum tools such as RSI settings for day trading can confirm a flip before you act on it.
For hands-free management, a well-built Parabolic SAR indicator plots and ratchets the trail for you in real time. Tools speed the work, yet the step and filter choices above still carry the logic. So learn the settings first, then let software handle the trailing.
FAQ
What are the best Parabolic SAR settings for day trading?
Most day traders start with the default step of 0.02 and a maximum of 0.20, then adjust from there. A smaller step near 0.01 smooths the trail for holding trends, while a larger step near 0.03 tightens it for quicker exits. So the right choice depends on your speed and your pair, tested on your own charts.
What do the step and maximum step actually do?
The step is the acceleration factor that pulls the dots toward price, and it rises on each new extreme. The maximum step caps how aggressive that acceleration can get. A higher step tightens the trail and flips sooner, while a lower step loosens it and flips later.
Why does Parabolic SAR whipsaw so much?
The tool assumes a trend, so it flips repeatedly when price drifts sideways. In a range, every swing crosses the dots and triggers a reversal that quickly fails. So confirm a trend with a separate filter and avoid trading SAR flips inside a flat box.
Should I use Parabolic SAR alone?
Parabolic SAR works best as a trailing stop and a trend cue, not as a lone entry system. Pair it with a moving average or a higher-timeframe read for direction, and with a volatility gauge for context. That combination filters out most of the false flips.
What timeframe suits Parabolic SAR for day trading?
The five and fifteen-minute charts suit intraday SAR trades during active sessions. Lower timeframes flip more often and demand a stricter filter, while higher ones give slower, cleaner trails. So match the timeframe to your holding period and adjust the step to fit.
Will the right SAR settings improve my trading?
No setting delivers an edge by itself, and tuning the step only changes the trade-offs. Parabolic SAR is one input that works best beside a trend filter and disciplined risk. Manage risk on every trade. Results are not guaranteed; past performance is not indicative of future results.
External references
- For background on this concept, see Introduction to Parabolic SAR at Investopedia.
- For broader market context, see Parabolic SAR at BabyPips Forexpedia.

About the author
Written by Dominic Walsh, a Forex trader and MT4/MT5 indicator, Expert Advisor and script developer. Every tool on forexmt4systems.com is tested on live charts before release and ships with ready-to-use compiled MT4 (.ex4) and MT5 (.ex5) files. Learn more about the trader and developer behind this site.
How we build, test and correct every tool: Editorial & Testing Policy. Trading carries risk; see the disclaimer.