
The turtle soup trading strategy fades a breakout of a 20-bar high or low that fails within a few candles. Linda Raschke and Laurence Connors published the original rules in the 1996 book Street Smarts, and Michael Huddleston, the Inner Circle Trader (ICT), later reframed the same failure as a liquidity raid. So after this guide, you will know how to spot the false breakout, place the entry and stop, and select targets under both versions.
First, we cover where the name comes from and what the pattern looks like on a real gold chart. Then we walk through Raschke’s exact rules, the ICT liquidity reading, and two worked examples with real numbers. Also inside: the failure modes that make most fades lose.
What Is the Turtle Soup Trading Strategy?
In the 1980s, Richard Dennis taught his “Turtle” traders to buy 20-day breakouts and ride the trend. Yet most pokes beyond a 20-bar extreme fail to follow through. Raschke built a setup around that failure and named it turtle soup — the pattern quite literally cooks the turtles’ breakout entries. So the core idea is simple: when price breaks a 20-bar high or low and snaps back, trade the snap-back, not the breakout.
The chart below shows the short side on gold (XAUUSD, 1-hour) from July 20, 2026: a raid through the 20-bar high at 4,030.875, a wick to 4,040.8, and a close back inside the range.
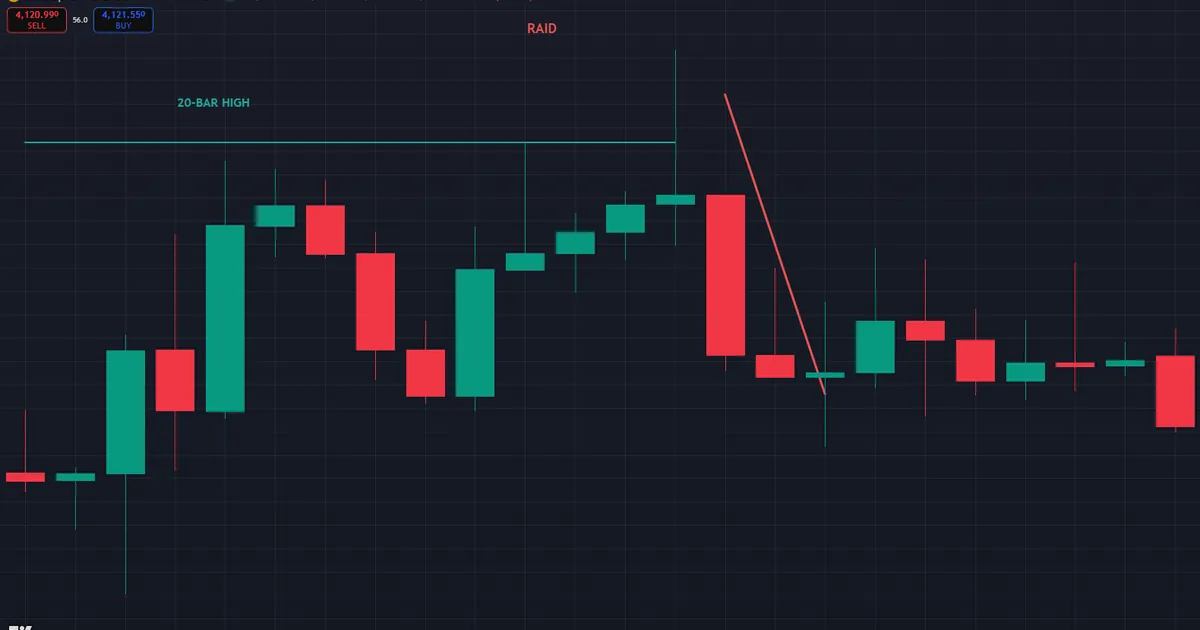
Walk the sequence on that chart. Gold pushed through the marked 20-bar high by roughly ten dollars, and the wick stretched to 4,040.8. Yet the candle could not hold the ground; it closed back below 4,030.875, inside the old range. Sellers pressed from there, and the slide carried price back under 4,000 over the following sessions — a give-back of roughly 42 dollars from the raid high. Breakout buyers above 4,030 became the fuel for the move against them. Keep that single candle in mind throughout this guide, because every rule below exists to identify it in advance.
Anatomy of the False Breakout
At heart, the turtle soup pattern is a false breakout strategy. Price needs a reference extreme that the whole market can see. Next comes a violation of that level, and finally a rejection that traps breakout traders on the wrong side. Their exit orders then help fuel the reversal. Hence the payoff structure: modest risk beyond the raid extreme, targets across the prior range.
Linda Raschke’s Original Rules
Street Smarts defines the long setup on daily bars. Still, the rules translate directly to intraday charts; keep the 20-bar count the same.
- Price must make a new 20-bar low today.
- The previous 20-bar low must have formed at least four sessions earlier. Indeed, the spacing proves the level is an established reference, not part of the same decline.
- After price trades below that previous low, place a buy stop 5-10 pips above the old low.
- If the buy stop fills, set the initial stop loss just below the current bar’s low.
- Trail the stop as price recovers. Also note: most of the edge shows up within the next two to six bars.
Sell setups mirror every rule at a 20-bar high. Meanwhile, the authors added a variant called “Turtle Soup Plus One,” which takes the same entry one session later when the reclaim needs more time. Credit belongs to Raschke and Connors here — every modern sweep-and-reclaim entry descends from these rules. Their book remains the reference text for the setup.
Why 20 bars, and why the four-bar spacing? The 20-bar lookback matches the Turtles’ own entry window, so the reference level is precisely the one breakout systems act on. Fade a level nobody trades and nobody gets trapped. The spacing rule serves the same purpose from the other side: a low printed four or more sessions ago has sat on every screen long enough to accumulate stops beneath it. Fresh lows inside an active decline carry no such baggage, which is why the rule excludes them.
Raschke vs ICT: Same Event, Two Lenses
The two versions agree on the chart and differ on the story. Raschke’s reading is statistical: most 20-bar breakouts fail, so fading them with tight risk carries a positive expectancy when managed well. Her rules are mechanical — counts, spacing, entry offsets — and they need no narrative about who moved the market.
ICT’s reading is causal: the raid happens because liquidity rests beyond the level, and someone with size wants it. That lens adds filters the original rules never had — session timing, higher-timeframe draw, equal highs and lows as preferred targets. Neither version is more correct. Instead, treat Raschke’s rules as the skeleton and the ICT context as the muscle; the combination beats either one alone in most journals.
The ICT Reframing: A Liquidity Raid
ICT teaches the same event in different language. Old lows collect stop-loss orders from traders holding longs, plus pending sell orders from breakout systems. Indeed, that cluster is sell-side liquidity — a resting liquidity pool below an obvious level. Smart money, in this framing, drives price into the pool, fills large buy orders against those exits, and reverses the move. So an ICT turtle soup long is a raid on sell-side liquidity, caught at the turn.
Hence the overlap with related concepts. A turtle soup buy is stop hunting viewed from the profitable side. It also maps onto buy-side and sell-side liquidity: longs form at raids of sell-side pools, shorts at raids of buy-side pools. Timing matters too — ICT prefers raids inside the London kill zone (2:00-5:00 New York time) or the New York kill zone (7:00-10:00 New York time), when engineered runs cluster. Then the reclaim becomes his confirmation that the run was engineered rather than genuine.
Consider the order flow inside the raid itself. Stops from trapped longs sell into the low, breakout systems sell the new low too, and the combined flow gives large buyers their fill without chasing the market higher. Then the reclaim strands both crowds: the stopped-out longs watch from flat, while fresh breakout shorts hold losers above their entry. Their covering buys become the first leg of the reversal — the pattern runs on other people’s regret.
Entry, Stop, and Target Playbook
Here is a synthesis that works under both readings of the pattern. Plainly, the steps assume a long; mirror everything for shorts.
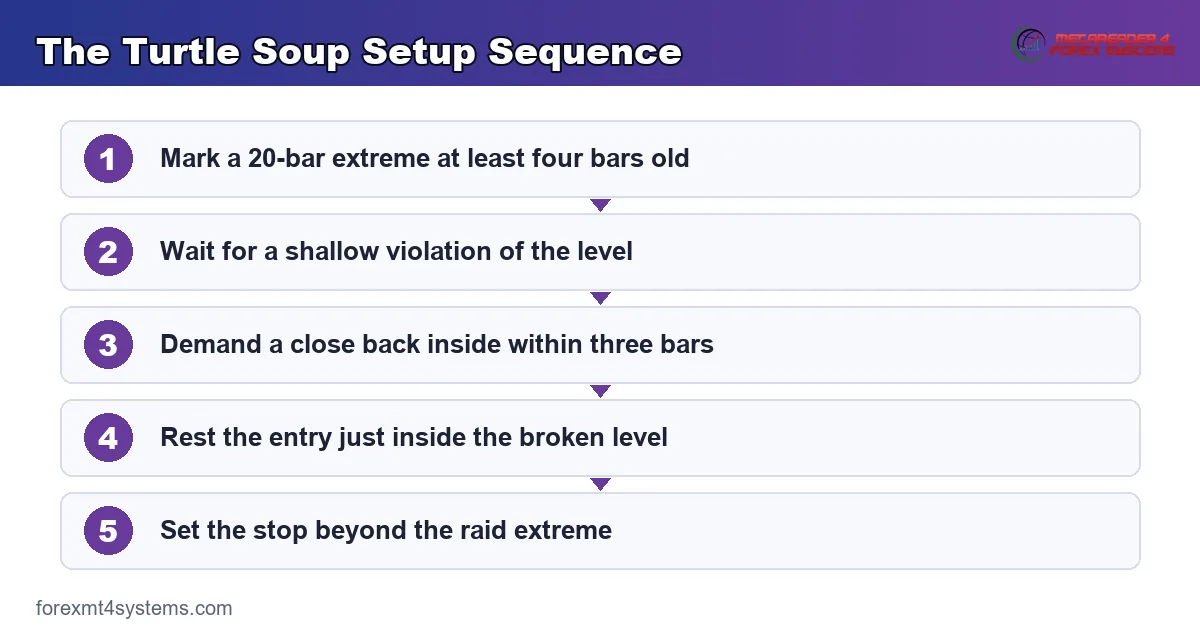
- Mark the reference: the prior 20-bar low, at least four bars old.
- Wait for the raid. Also, prefer shallow violations of roughly 5-15 pips; they reverse more cleanly than deep breakdowns.
- Demand the reclaim: a candle closes back above the old low within one to three bars.
- Enter with a buy stop a few pips above the old low. Instead, confirmation-minded traders buy the close of the reclaim candle.
- Place the stop loss below the raid’s extreme low.
- Target the near side of the recent range first — the closest untouched highs. Then manage any remainder toward the prior 20-bar high.
Position size falls out of the stop distance, never the other way around. So before entry, run the raid low and your account risk through a position size calculator and let the math set the lot size. One practical detail: because the stop distance changes with every raid, the lot size changes too. Traders who fix the lots instead of the risk end up betting most on the deepest, ugliest raids — the exact trades that deserve the least.
Worked Example 1: GBPUSD Turtle Soup Long
Suppose GBPUSD printed a 20-bar low at 1.2650 on the 1-hour chart six sessions ago — old enough to qualify as an established reference under Raschke’s spacing rule. During the London morning, price breaks down to 1.2638, twelve pips through the level. Then, within two candles, a wide-range bar closes back up at 1.2661.
The buy stop at 1.2655 fills on the reclaim. Next, the stop loss goes to 1.2633, five pips under the raid low, for 22 pips of risk. First target is the near-side range high at 1.2710, worth 55 pips, or about 2.5R. Meanwhile, the prior 20-bar high at 1.2740 stands as the stretch objective if momentum holds.
Notice what the trade did not require. Indeed, no indicator fired and no news call was needed — just a visible level, a trap, and a reclaim with defined risk. Costs still count, though: spread and slippage widen around session opens, so subtract them before judging the reward.
Worked Example 2: Fading a Raided High on EURUSD
Now the short side in full. Suppose EURUSD set a 20-bar high at 1.14850 seven bars ago, so the reference passes the spacing rule. During the New York morning, price pokes up to 1.14940 — nine pips through the level — and stalls there.

One candle later, a wide bar closes back inside at 1.14810. The sell stop at 1.14790, six pips below the old high, fills on the follow-through. Next, the stop loss goes to 1.14955, just above the raid high, for about 17 pips of risk. First target is the nearest untouched swing low at 1.14560, worth 23 pips, and the prior 20-bar low at 1.14380 serves as the stretch objective near 2.5R.
Manage the position in stages. Take a partial at the first target, move the stop to entry, and let the remainder work toward the range low. If price stalls beyond four to six bars without progress, consider scratching; Raschke’s own research placed most of the edge in the first handful of candles after the reclaim, and stale fades tend to drift back to the entry.
Notice the mirror logic. Every rule from the long side flipped cleanly: reference high instead of low, sell stop below instead of buy stop above, risk above the raid instead of beneath it. Trade both directions, or the pattern only shows you half its opportunities.
Turtle Soup Inside the Smart Money Workflow
Turtle soup rarely stands alone in a modern playbook. Instead, most traders treat it as the trigger inside a larger liquidity narrative: higher-timeframe bias points up, price raids a sell-side pool, and the reclaim starts the reversal leg. The full guide to liquidity sweep trading covers that narrative end to end.
Timeframe Pairing
Split the jobs across two charts. Keep the 20-bar reference on the 1-hour or 4-hour chart, where levels carry real stop clusters, then drop to the 5- or 15-minute chart to watch the reclaim form candle by candle. The lower timeframe often shows a small structure shift right at the turn, which sharpens the entry and trims the stop distance. Avoid building the reference itself on a 1-minute chart; those extremes attract no meaningful orders.
Session and Context Filters
Session context adds another filter. First, check where the raid sits inside the day: a London-morning raid of the Asian session low is the classic template. Second, note the location against the weekly range, because Monday extremes get run far more often than Friday ones. Neither rule is absolute, yet both tilt the odds toward engineered raids.
Context tools sharpen the process further. Also, smart money indicators can mark 20-bar extremes, equal lows, and raid candles automatically, which keeps level selection honest across pairs. Now a note on quality: raids that sweep equal lows, or that land inside a higher-timeframe discount zone, carry more weight than a lone poke through a random level.
The gold chart at the top of this guide checks those boxes. The 4,030.875 reference stood as the visible ceiling of a multi-day range, the violation stayed shallow relative to gold’s hourly swings, and the reclaim arrived within a single candle. Layer the workflow questions over any candidate raid the same way: is the level obvious, is the poke shallow, is the reclaim fast, and does the bigger picture want price back inside the range? Four yes answers describe the trade worth taking.
Download the complete indicator database
Put these concepts on your charts. One email unlocks the full library of 1,380+ indicators with compiled MT4 and MT5 files, plus my TradingView scripts. No paywall, no spam, unsubscribe any time.
Get free access to my indicator database
One email unlocks 1,380+ free MT4, MT5 and TradingView indicators — the complete library. No single-tool download; you get the whole database.
Common Mistakes When Fading Breakouts
The pattern is simple; the discipline is not. Six errors account for most of the damage.
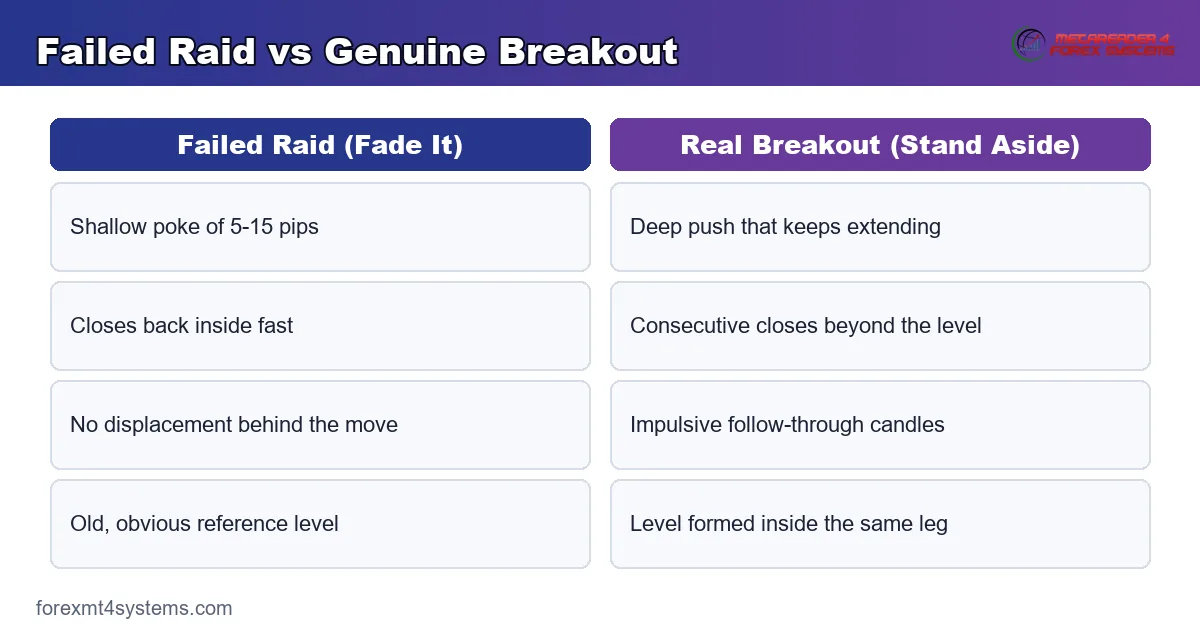
- Fading every poke. A level formed two bars ago is not a reference. Correction: demand the four-bar spacing and an obvious, visible extreme.
- Jumping in before the reclaim. Buying while price still trades beyond the level means catching a falling knife. Correction: wait for the close back inside.
- Hiding the stop at the old level. Raids often retest their extreme before reversing. Correction: place the stop beyond the raid’s full wick.
- Fighting the higher timeframe. Fading a raid that runs with the weekly trend invites the structural loss. Correction: prefer fades that rejoin the higher-timeframe direction.
- Accepting deep violations. A 40-pip breakdown that reclaims leaves a wide stop and thin reward. Correction: cap the violation depth you will trade, near 15 pips on majors.
- Revenge-fading a real breakout. Two consecutive closes beyond the level mean the market voted. Correction: stand aside and let the trend go.
Notice that every one of the six lives on the impulse side of trading. None of them stems from a bad level or a broken rule set; each comes from acting early, acting big, or acting again. The pattern rewards the trader who does less — fewer references, fewer fades, smaller violations — and punishes activity for its own sake. Read the list before the session, not after it.
Pre-Trade Checklist for the Next Raid
Before the order rests, answer this list line by line.
- Reference extreme at least four bars old and clearly visible.
- Violation shallow — roughly 5-15 pips on a major pair.
- Close back inside the range within three bars.
- Higher-timeframe direction favors the reversal.
- Session window active — London or New York morning.
- Stop set beyond the raid extreme, size computed from it.
- First target inside the range, marked before entry.
Keep the list physical — printed or pinned beside the platform. Under pressure, traders skip steps in the exact order that costs money: spacing first, depth second, reclaim last. A written pass through the seven lines takes twenty seconds and removes the impulse trade entirely. Then, after the session, note which line would have vetoed any fade that lost; over a month, one or two lines usually emerge as your personal weak spots.
Where Turtle Soup Fails
Real breakouts exist. Sometimes the 20-bar low breaks because a genuine downtrend is starting, and the fade buys you straight into a falling market — that loss is structural, not bad luck. Meanwhile, news releases produce the same effect; a surprise print has no respect for a reference level.
Depth matters as well. Breakdowns that run 30-50 pips before reclaiming leave wide stops and thin reward-to-risk. Choppy ranges hurt too, because every 20-bar extreme sits inside overlapping noise and the trap catches no one. Thus the filters matter more than the trigger: an established reference, a shallow violation, a fast reclaim, and a higher-timeframe reason for the turn. So skip the trade when any one of those is missing.
Sample size deserves a mention as well. Truly random-looking strings of losers happen even when the filters honor every rule. Judge the setup over dozens of journaled trades, not over one week. Resist the urge to quote a fixed success percentage too; the honest answer is that outcomes shift with pair, session, and regime, and only your own logged sample says how the pattern behaves in your hands.
A Failure Walkthrough in Numbers
Picture the failure priced out. EURUSD breaks a 20-bar high at 1.16240 and stalls a few pips higher, and the fade looks ready. Yet no reclaim comes. The next candle closes at 1.16290, above the level, and the one after holds 1.16310. Instead of a trap, the chart is printing acceptance — buyers defending the breakout rather than fleeing it.
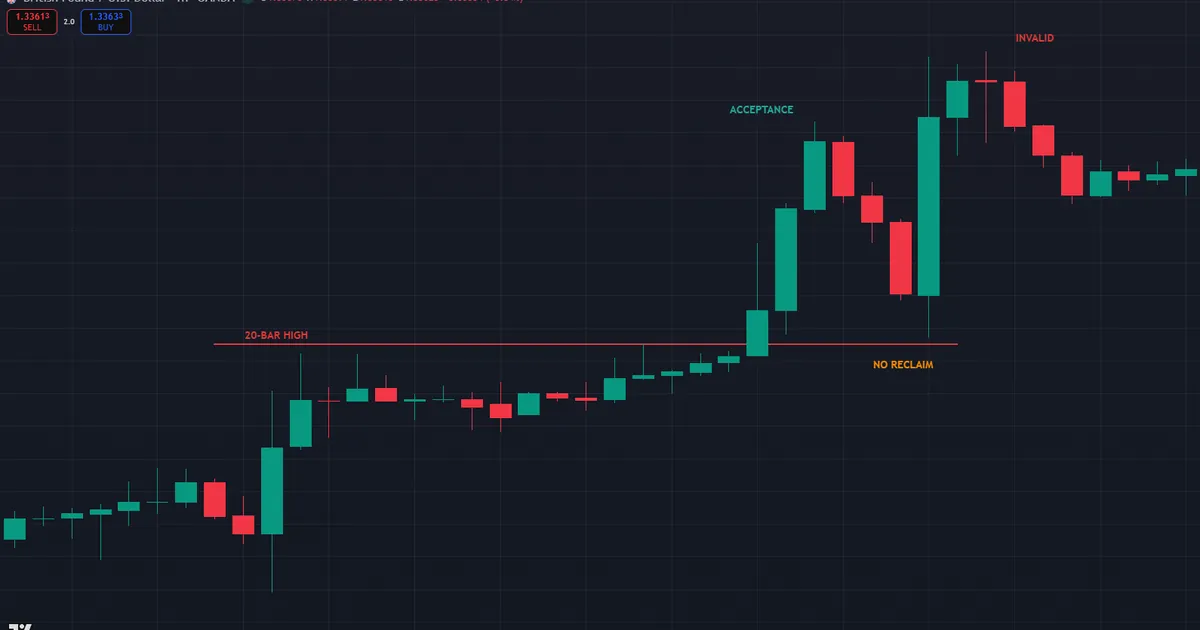
The invalidation rule keeps this cheap. No close back inside within three bars means no trade, and two consecutive closes beyond the level cancel the idea outright. If an early entry slipped through, the stop beyond the raid extreme caps the loss at one planned unit. Afterward, log the tell you missed: depth of the push, bars spent beyond the level, and whether displacement backed the break. Genuine breakouts usually advertise themselves in those three details.
Related Concepts
Two companions round out the fade. The full guide to ICT kill zones maps the session windows where engineered raids cluster, in New York time. Meanwhile, ICT daily bias shows how to name the higher-timeframe draw before deciding which raids deserve a fade. Both pair naturally with the stop-run and liquidity ideas linked earlier, and together they turn a candlestick trick into a repeatable process. Work through one guide at a time and re-read your last ten fades against it; the review usually explains more losers than any new entry rule would.
FAQ
Who invented the turtle soup strategy?
Linda Raschke and Laurence Connors published it in Street Smarts in 1996. Indeed, the name plays on Richard Dennis’s Turtle traders, whose 20-day breakout entries the setup fades.
What is ICT turtle soup?
ICT turtle soup is the same false-breakout fade described in liquidity terms. A raid through an old low takes out sell-side liquidity, and the reclaim signals the run was engineered. Also, ICT adds session timing, preferring raids inside the London or New York kill zones.
What timeframes suit the turtle soup pattern?
The original rules used daily bars, and they translate well to 1-hour and 4-hour charts. Below 15 minutes, spread and noise eat a growing share of the edge. So most traders keep the reference level on a higher timeframe.
How is turtle soup different from a support bounce?
A bounce holds above support; turtle soup requires a violation first. Plainly, the pattern needs trapped breakout traders below the level, because their exits help fuel the reversal. No break, no trap, no setup.
Does the turtle soup pattern work on gold and indices?
Yes. The July 2026 gold example above shows the same mechanics: an obvious 20-bar high, a roughly ten-dollar raid, and a close back inside before a slide of about 42 dollars. Any liquid market with visible extremes produces the pattern, though tick size and volatility change the stop math.
Does the turtle soup strategy work in trending markets?
Counter-trend fades are the weakest version of the setup. Instead, it performs best when the raid runs against the higher-timeframe direction and the reclaim rejoins it. Results are not guaranteed; past performance is not indicative of future results.
External references
- For background on this concept, see Fakeout at BabyPips.
- For broader market context, see Failed Break at Investopedia.

About the author
Written by Dominic Walsh, a Forex trader and MT4/MT5 indicator, Expert Advisor and script developer. Every tool on forexmt4systems.com is tested on live charts before release and ships with ready-to-use compiled MT4 (.ex4) and MT5 (.ex5) files. Learn more about the trader and developer behind this site.
How we build, test and correct every tool: Editorial & Testing Policy. Trading carries risk; see the disclaimer.