
Few reversal tools are as quietly popular as Williams fractals, the little arrows that mark where price ran out of steam and turned. A fractal pins the exact bar that made a local high or low, so it hands you a clean swing point without any guesswork.
This guide gets Williams fractals explained from the first candle to the live entry. So by the end, you will know how a fractal forms, how to filter the weak ones, and how to trade the break of a marked level with a stop that makes sense.
Williams Fractals Explained
A Williams fractal is a five-bar pattern that marks a swing high or a swing low. Bill Williams introduced it in his 1995 book Trading Chaos, and the idea is simple. The middle bar of the five is the turning point, and the two bars on either side confirm it.
Picture an up fractal first. The center bar posts a high that both neighbors on each side fail to beat, so an arrow prints above it. That arrow marks a local peak where buyers stalled. A down fractal is the mirror, with a low that the four surrounding bars cannot break, and an arrow prints below.
Here is the catch that trips up beginners. A fractal needs the two bars to its right to close before it can confirm, so the arrow always appears two bars late. That lag is built in, not a flaw. So you never act on a fractal the instant its middle bar prints, because the pattern is not yet complete.
Look at a concrete case. The chart shows EURUSD on the four-hour timeframe with the Williams Fractal study applied at its default setting. Near 1.1365, a down fractal marks a clear swing low, and its arrow sits under the bar that anchored the bounce.

Now trace what the arrow means. That marked low is a level the market defended once, so it becomes a reference the next time price returns. Because the fractal froze the exact price, you have a line to watch rather than a vague zone. So the tool turns a fuzzy swing into a hard number you can plan around.
Up Fractals Versus Down Fractals
The two arrows answer opposite questions, so keep them straight. An up fractal marks a local peak, a spot where price probed higher and buyers gave up. So it flags potential resistance and, on a break, a bullish trigger once price clears it.
A down fractal marks a local trough instead. Here price probed lower and sellers ran out of conviction, so the arrow flags potential support and a bearish trigger on a break below. Because the two types map opposite pressure, many traders color them differently and read the chart as a ladder of alternating peaks and troughs. That ladder alone sketches the swing structure before any other tool goes on the chart.
How a Fractal Forms
The pattern follows a fixed rule, and knowing the steps stops you from misreading an arrow. Five bars build every standard fractal, and the center bar carries the signal.
- The center bar. One bar posts the highest high, or the lowest low, of the group. This is the candidate turning point that the rest of the pattern must confirm.
- The two bars before. The two bars to the left must each stay below that high, or above that low. So they show price building toward the extreme rather than exceeding it.
- The two bars after. The two bars to the right must also fail to break the extreme. Only once both close does the fractal confirm and the arrow lock in.
- The arrow. An up arrow sits above a swing high, and a down arrow sits below a swing low. Each marks the precise price the market rejected.
- The lag. Because two right-side bars must close, every fractal confirms two bars after its peak. So the signal is always a touch late by design.
So the math is objective, which is part of the appeal. The concept graphic below lines up the five bars and shows exactly which one earns the arrow.

One detail matters for the default setting. Most platforms let you widen the pattern beyond five bars, demanding more bars on each side of the center. A wider setting prints fewer, stronger fractals, while the default five-bar version prints more but weaker ones. So the number you pick trades quantity against quality, and the standard five-bar setup is the common starting point.
Why the Two-Bar Lag Helps
The delay feels annoying until you see its value. Price is full of brief pokes that reverse within a bar, and a fractal ignores almost all of them. Because the pattern waits for two bars to agree, it filters out the noise that would otherwise fire a signal on every wiggle.
Think of the lag as a small toll for reliability. So a confirmed fractal marks a swing that actually held for a few bars, not a one-tick spike that vanished. That trade-off is usually worth taking, since a level nobody defended is a level not worth watching.
How Williams Fractals Fit a Workflow
A raw fractal is only half a plan, because the tool marks levels but says nothing about trend. So most traders pair fractals with a trend filter, and Bill Williams built one for exactly this job.
Start with the Alligator, Williams own trend tool. It plots three smoothed moving averages, set at 13, 8, and 5, and each is pushed forward by a few bars. When the three lines fan out and point up, the trend is up, and when they twist together, the market has no trend to trade.
Then combine the two tools. Take a down fractal only when the Alligator points up, and take an up fractal only when it points down, so you fade extremes in the direction of the larger flow. Because the trend filter blocks counter-trend signals, it removes most of the fractals that would fail. The reversal indicators archive plots several tools that do the same filtering job if you prefer an alternative.
Now think about which fractals to keep. In a strong uptrend, the down fractals mark the pullback lows where buyers stepped back in, so those are the levels that matter. Meanwhile the up fractals in that same trend mark minor peaks that price soon exceeds, so they carry less weight. So the trend decides which arrows you watch and which you ignore.
Choosing a Timeframe
Fractals appear on every timeframe, yet they do not all mean the same thing. A fractal on the daily chart marks a swing that took days to build, so it holds real weight. A fractal on the one-minute chart marks a blip that may not survive the hour.
Match the timeframe to your style. Swing traders lean on four-hour and daily fractals that map meaningful swings, while intraday traders drop to the fifteen-minute chart for faster levels. Because a higher-timeframe fractal outranks a lower one, many traders mark the big levels first and then hunt entries beneath them. Our guide to pivot points explained shows how math-based levels can sit alongside these swing marks.
Using Fractals as Breakout Levels
Williams himself favored fractals as breakout triggers rather than reversal bets. So the plan is straightforward. A close beyond an up fractal signals a bullish breakout, and a close beneath a down fractal signals a bearish one, since price has now taken out a level the market defended.
Wait for the close, though. A wick that pierces a fractal and pulls back is not a break, because the body never cleared the level. So demand a bar that closes past the arrow before you treat the level as broken. That single rule filters out a large share of false starts.
Pairing Fractals With Horizontal Levels
Fractals gain power when they line up with levels you already drew. A down fractal that forms right on a prior support zone carries far more weight than one floating in open space. Because two independent reasons now point at the same price, the level earns more respect.
So stack your evidence rather than relying on the arrow alone. Mark the obvious swing highs and lows first, then let fresh fractals confirm those levels as price returns to them. When a fractal and a horizontal level agree, the reaction there tends to be sharper. Meanwhile a fractal with nothing behind it deserves more caution, since only one factor supports it.
Worked Example: A EURUSD Fractal Break
Picture EURUSD grinding higher on the four-hour chart, with the Alligator lines fanned upward beneath price near 1.14. A pullback prints a down fractal at 1.1365, marking the low where buyers defended the trend.
Now read the setup as a whole. The Alligator confirms an uptrend, and the down fractal marks a fresh higher low, so trend and level agree. The chart below marks that fractal low and the long entry that follows once price turns back up from it.
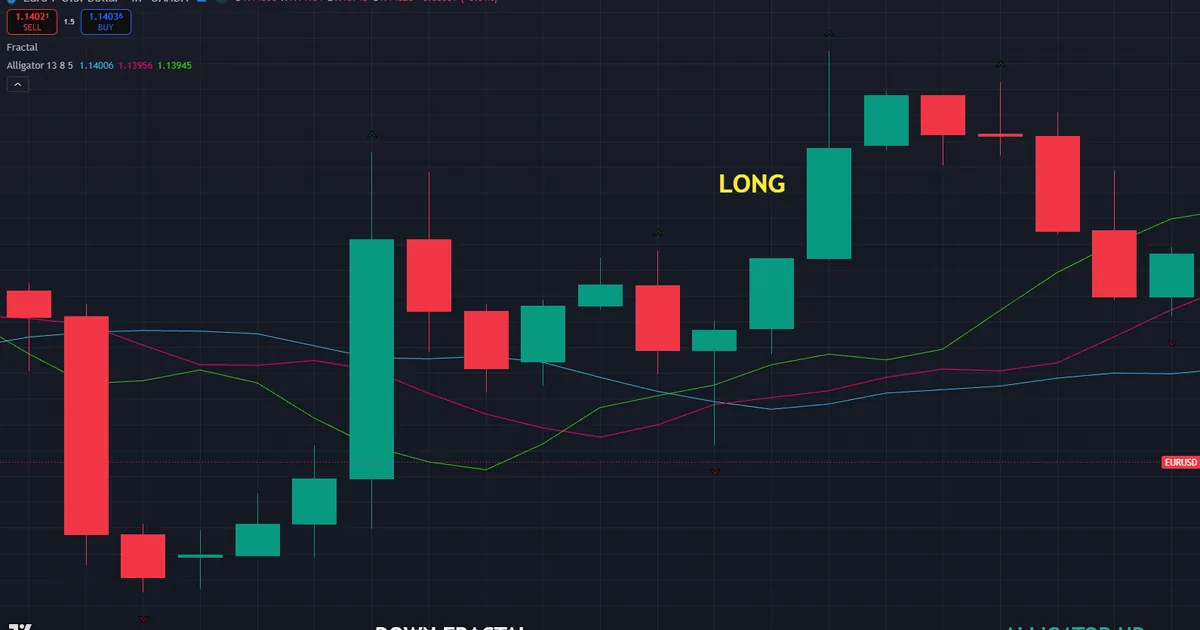
Then build the trade around the marked low. A stop sits just below the down fractal at 1.1365, where a clean break would deny the higher low and cancel the reason for the trade. Because the fractal defines the exact swing, that stop sits at a logical spot rather than a random pip count. Our free position size calculator turns that stop distance into a size in seconds.
Managing the Trade
Let later fractals guide the exit. As price climbs, each new down fractal marks a fresh higher low that you can trail a stop beneath. So the trade rides the trend while the structure of higher lows stays intact.
Watch the Alligator as a second check. While the three lines stay fanned and pointing up, the trend has room to run. Meanwhile, if the lines twist back together, momentum is fading and a tighter exit makes sense. So the two tools share the work, one marking levels and one reading trend.
Compare a trader who ignored the trend filter. Someone buying every down fractal, trend or not, would have bought straight into ranges and downtrends. Because the Alligator kept this entry aligned with the larger move, the trade sat on the right side of the flow. So the filter, not the fractal alone, made the difference.
Reading the Confluence
Notice how many factors agreed at that one price. The Alligator pointed up, a fresh higher low printed, and the fractal marked the exact level to defend. Because three reasons stacked at 1.1365, the entry rested on more than a single arrow.
So treat confluence as the real edge here. Any one clue can mislead, yet several pointing the same way raise the odds that the level holds. When the trend, the structure, and the fractal all agree, the setup is worth taking. Meanwhile a fractal standing alone, with no trend or level behind it, is the kind of signal to pass on without regret.
Download the complete indicator database
Put these concepts on your charts. One email unlocks the full library of 1,380+ indicators with compiled MT4 and MT5 files, plus my TradingView scripts. No paywall, no spam, unsubscribe any time.
Get free access to my indicator database
One email unlocks 1,380+ free MT4, MT5 and TradingView indicators — the complete library. No single-tool download; you get the whole database.
Common Williams Fractals Mistakes
The tool is simple, yet the same errors repeat across every market. Most come from trusting an arrow without any context, and the fixes follow beneath the graphic.

Acting Before the Fractal Confirms
The most common slip is jumping in on the middle bar. Because two right-side bars must close first, an early entry acts on a pattern that may never complete. So wait for the confirmation, and treat an unconfirmed peak as merely a possibility, not a signal.
Trading Every Fractal
A busy chart prints fractals constantly, and most lead nowhere. Each arrow tempts a trade, yet the market only respects a fraction of them. Instead, filter with the Alligator or a higher-timeframe level, and skip the fractals that fight the trend entirely.
Ignoring the Timeframe
A one-minute fractal and a daily fractal look identical, but they carry very different weight. Borrowing a level from the wrong window wrecks the read. So mark the higher-timeframe fractals first, and let the smaller ones serve only for timing inside those bigger levels.
Confusing a Wick With a Break
Price often spikes through a fractal and snaps back within the same bar. That wick is not a breakout, because the body never closed past the level. So demand a closing break beyond the arrow, and let the intrabar pokes go without a second thought.
Forgetting the Repaint Risk
Some fractal tools redraw the newest arrow until the pattern locks in. A signal that looks set on the current bar can vanish two bars later. So confirm on closed bars only, and never build a live entry on a fractal that has not yet fully formed.
Williams Fractals Checklist
Run this short list before every entry that leans on a fractal. A few seconds here saves hours of regret later. So keep it in view, tick each item honestly, and let a missing check talk you out of a marginal trade.
- Fractal fully confirmed, with both right-side bars closed.
- Trend direction read from the Alligator or a separate filter.
- Signal aligned with that trend, not fighting it.
- Timeframe matched to your trading style and horizon.
- Breakout, if used, confirmed by a closing bar beyond the level.
- Stop placed just past the fractal that defines the swing.
- Risk fixed as a small percent of the account.
When Williams Fractals Fail
Study the failure case as hard as the winner. Here is a common one. A trader marks a down fractal on GBPUSD near 1.333 in a flat, sideways market and buys the bounce, sure the level will hold as support. The first touch even works.
Then the range takes over. Price chops back through the fractal, prints another one lower, and each marked level fails within a few bars. The chart below shows that mess, with arrows scattered across a flat market and price slicing through every one.

So what went wrong? Fractals mark swings, but swings only lead somewhere when a trend carries them. In a range, the arrows pile up on both sides and price ignores them all. Hence the guard that saves an account, which is to demand a clear trend before you trust a fractal at all. A level in the middle of chop is just noise with an arrow on it.
The Lag Cuts Both Ways
Respect the delay when a move is fast. Because a fractal confirms two bars after the peak, a violent reversal can leave the arrow printing well after the best price is gone. So on sharp turns, treat the fractal as a marker of what happened, not a live entry, and lean on structure for the timing instead.
Keep a Trade Log
Be systematic about which fractals actually help you. Because every trader favors a slightly different setting and filter, a written record beats memory every time. So note each fractal setup and its outcome in a trade journal, then let the data refine your own rules over months.
Review that log with a cold eye. Perhaps your daily fractals hold well while your five-minute ones just bleed the account, or the Alligator filter lifts your results sharply. Because the answers differ for every trader, only your own record can reveal them. So let the data, rather than a rigid rule, settle how you use the tool. A short monthly review of that record is usually enough to keep your fractal rules honest and current.
Related Concepts to Study Next
Williams fractals connect to a web of level tools, and a few ideas deserve your next reading hour. A fractal marks a swing point, which is exactly the raw material that horizontal support and resistance is built from. Diagonal levels matter too, so the way a trend line frames the same swings is worth a careful look. Both partners sharpen the read that a lone arrow gives you.
For broader context, the pivot points and fractals archive frames these swing marks alongside math-derived levels. Our guides to support and resistance explained and how to use trend lines carry the level theme further. So master the fractal read first on your own, and then let any tool on the chart simply plot the swings you already know how to trade.
FAQ
What is a Williams fractal?
A Williams fractal is a five-bar pattern that marks a swing high or low. The center bar posts the extreme price, and the two bars on each side fail to beat it. An arrow then prints above a peak or below a trough to flag the exact level the market rejected.
How many bars make a fractal?
The standard fractal uses five bars, with one center bar and two on each side. Some traders widen the pattern to demand more bars per side, which prints fewer but stronger fractals. The five-bar version is the common default on most platforms.
Do Williams fractals repaint?
The newest fractal can redraw until its two right-side bars close, so a live arrow may change. Once those bars close, the fractal is fixed and will not move. Confirm on closed bars only, and never build an entry on a fractal that has not fully formed.
Should I use fractals with the Alligator?
Yes, Bill Williams designed the two tools to work together. The Alligator reads trend while fractals mark levels, so pairing them filters out counter-trend signals. Take fractals that agree with the Alligator direction, and skip the ones that fight it.
What timeframe is best for fractals?
Higher timeframes give fractals more weight because their swings take longer to build. Swing traders favor four-hour and daily fractals, while intraday traders drop to the fifteen-minute chart. Mark the bigger levels first, then use smaller fractals for timing inside them.
Can fractals predict reversals?
No, a fractal only confirms a swing that has already happened, since it lags by two bars. It marks where price turned, not where it will turn next. So pair it with trend and structure, and manage risk on every trade. Results are not guaranteed; past performance is not indicative of future results.
External references
- For background on this concept, see Bill Williams on Wikipedia.
- For broader market context, see Fractals at Investopedia.

About the author
Written by Dominic Walsh, a Forex trader and MT4/MT5 indicator, Expert Advisor and script developer. Every tool on forexmt4systems.com is tested on live charts before release and ships with ready-to-use compiled MT4 (.ex4) and MT5 (.ex5) files. Learn more about the trader and developer behind this site.
How we build, test and correct every tool: Editorial & Testing Policy. Trading carries risk; see the disclaimer.