
Pivot points explained in one line: they are price levels that map the day’s likely support and resistance before the session opens. Floor traders built the idea decades ago, and it still guides intraday desks today. Best of all, the math needs only yesterday’s high, the low, and the close.
This guide keeps pivot points explained in plain steps. So by the end, you will know the formula, the five levels, the main pivot types, and how to trade them without guesswork.
Pivot Points Explained: The Core Levels
A pivot point is a single reference price for the coming session. Traders calculate it from the prior period, which is usually the previous trading day. Around that central figure, the tool projects a ladder of support and resistance levels both above and below the anchor.
The central pivot, marked PP, is the anchor. Price trading above it leans bullish for the day, and price below it leans bearish. So the first read is simple: which side of the central pivot are we trading on right now?
Above the pivot sit the resistance levels, R1, R2, and sometimes R3. Below it sit the support levels, S1, S2, and sometimes S3. Each level marks a spot where price has a fair chance to stall or reverse during the session. None of them is a wall, yet each draws attention from many traders at once.
Look at a concrete case. The chart shows GBPUSD on the fifteen-minute timeframe with the Pivot Points Standard tool applied. Price opens near the central pivot around 1.3377, then drifts up toward R1 near 1.3395. That single frame shows the levels acting as a road map.
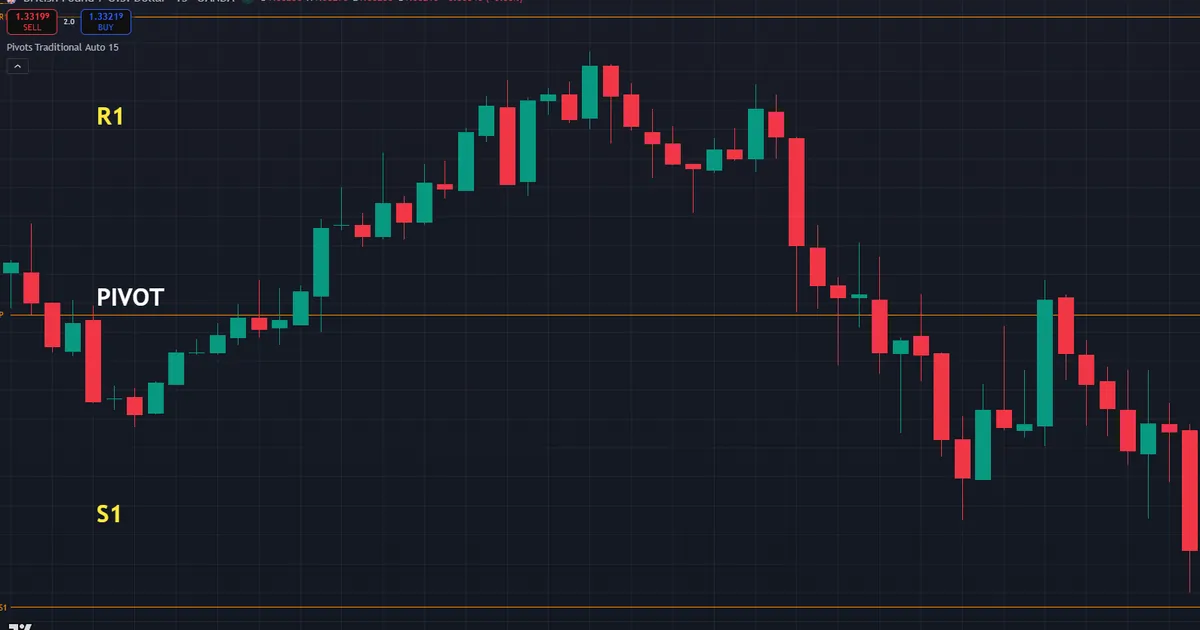
Now read the picture as a whole. Price respected the pivot as a floor, then climbed toward the first resistance. So the levels framed the day’s range before a single candle confirmed it. That head start is the whole point of drawing the grid ahead of the open.
Why Traders Use Pivots
The appeal is objectivity. Every trader who uses the same formula sees the same levels. Because the numbers are fixed and public, they draw real orders, which helps price react at them.
Pivots also save time. You set them once before the open, and they hold all session. So instead of hunting for levels bar by bar, you trade against a map drawn in advance.
Where Pivots Came From
The idea began on the trading floors of the futures pits. Floor traders needed quick levels they could work out by hand before the bell. Because the formula used only the prior high, low, and close, anyone could scribble it on a card.
That simple heritage still matters today. The levels spread because they were easy and shared, not because of any complex theory. So their power comes from crowd attention as much as from the maths behind them.
How Pivot Points Are Calculated
The math is small, so learn it once and reuse it forever. Five formulas build the standard set from three prior prices.
- Central pivot. Add the prior high, low, and close, then divide by three. So PP equals high plus low plus close, all over three.
- First resistance, R1. Double the pivot, then subtract the prior low. R1 sits just above the central figure.
- First support, S1. Double the pivot, then subtract the prior high. S1 sits just below the central figure.
- Second resistance, R2. Add the prior range, high minus low, to the pivot. R2 marks a wider target above.
- Second support, S2. Subtract the prior range from the pivot. S2 marks a wider target below.
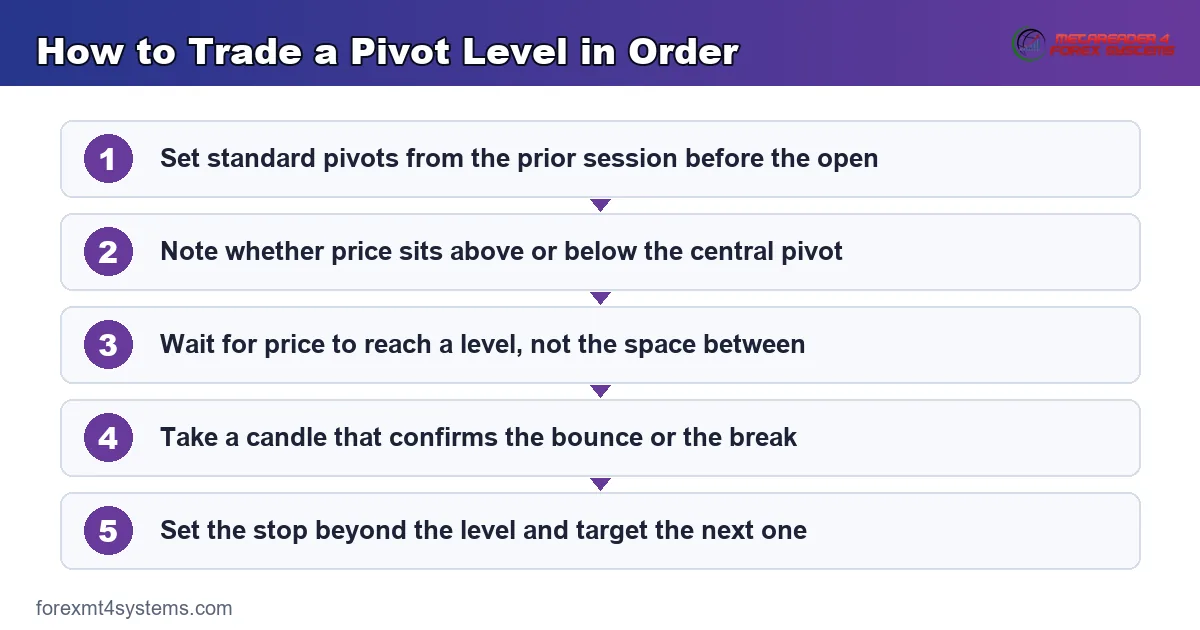
So the whole grid grows from three numbers and a little arithmetic. The concept graphic below lays out the levels in order.
A Worked Calculation on GBPUSD
Put real numbers to it. Say GBPUSD printed a high of 1.3398, a low of 1.3359, and a close of 1.3374 yesterday. Add those three and divide by three, and the pivot lands near 1.3377.
Now build the first levels. R1 works out to about 1.3395, and S1 to about 1.3356. The wider R2 sits near 1.3416, and S2 near 1.3338. So a handful of sums frames the entire day.
Notice the spacing that results. The distance from the pivot to R1 mirrors the distance down to S1. Because the formula is symmetric around the range, the grid spreads evenly on both sides of the central figure.
The wider levels serve their own purpose. R2 and S2 mark the edges of a normal day’s range, so price reaching them signals an unusually strong session. Because those outer levels get tested less often, a clean run to R2 or S2 often flags a real trend day rather than routine noise.
Which Period Sets the Levels
Most day traders use the prior day to set intraday pivots. A swing trader can step up and use the prior week or month instead. Because a longer period gives wider levels, the choice should match your holding time.
Match the pivot period to your chart too. Daily pivots suit the five-minute up to the one-hour chart. Weekly pivots suit the four-hour and daily. So the higher your timeframe, the longer the period you should feed the formula.
A common mix layers two periods at once. Some traders plot both daily and weekly pivots and watch where they cluster. Because a daily and a weekly level near the same price stack their weight, that overlap often marks a stronger zone worth extra respect.
The Main Types of Pivot Points
The standard set is not the only recipe. Several variations tweak the formula to weight price differently. Each type suits a slightly different style.
Standard pivots use the plain high, low, and close average you just learned. They are the most common and the most widely watched. So they draw the most orders and react the most reliably across the major pairs.
Fibonacci and Camarilla Pivots
Fibonacci pivots keep the same central pivot, then space the levels using Fibonacci ratios of the prior range. Traders who already lean on the golden ratio often prefer this flavour. So it blends the pivot idea with familiar Fibonacci maths.
Camarilla pivots pack the levels closer to the close. That tight spacing suits mean-reversion traders who fade moves back toward the middle. Because the levels sit near price, they trigger more often across a quiet session.
Woodie and DeMark Pivots
Woodie pivots give the closing price extra weight in the central figure. That tilt makes them react more to where the session ended. So they can shift the whole grid compared with the standard set.
DeMark pivots take a different route, using the open-close relationship to project a range. They produce a single support and resistance projection rather than a full ladder. So they suit traders who want one clean level rather than a stack.
Picking a Type That Fits
Do not rush to the exotic recipes. Standard pivots serve most traders well and draw the widest attention. So begin there, and add another type only when you have a clear reason.
Let your style guide any switch. A mean-reversion trader might test Camarilla for its tight levels, while a Fibonacci fan might prefer the ratio spacing. Because each recipe shifts the levels, trade only one at a time so your read stays clean.
Settings, Timeframes, and Pairing
Standard settings exist because traders watch them together. Self-fulfilling attention gives those levels real weight.
Keep the pivot type standard when you begin. It is the most watched, so it reacts the most cleanly. Set the period to daily for intraday work, and move to weekly only as your holding time grows.
Match the levels to your plan. A scalper trades the bounce between the pivot and R1 or S1. A trend day trader watches for a clean break of R1 toward R2. So the same grid serves both range and breakout styles.
Pairing With Other Tools
Pivots name levels but not momentum, so they pair well with an oscillator. A bounce off S1 backed by a rising oscillator carries more weight. Because two ideas agree at the same price, the odds of a reaction improve.
Plain structure adds another layer. A pivot that lines up with a prior swing high becomes a stronger level. So map your obvious support and resistance first, then note where the pivots reinforce it.
Breakouts Versus Bounces
Pivots hand you two very different plays. In a bounce, price rejects a level and turns back toward the middle. In a breakout, price pushes clean through and runs to the next level.
Read the day’s character to pick the play. A quiet, balanced session favours bounces between the levels. A trending session favours breakouts that ride from one level to the next. So let the market, not habit, choose which trade you take.
Respecting the Session Clock
Also respect the clock. Pivot levels react cleanest inside the London window and the New York morning, roughly 2:00 to 5:00 a.m. and 8:00 to 11:00 a.m. New York time. Because liquidity thins in the Asian session, price drifts through levels more easily. So weigh the session before you trust a bounce.
Worked Example: A Pivot Bounce on GBPUSD
Picture GBPUSD opening the London session on the fifteen-minute chart. The daily pivot sits near 1.3377, with S1 below at about 1.3356. Price opens just under the pivot and eases lower toward S1.
Watch how price behaves at the level. It reaches S1 near 1.3356 and stalls, then a bullish candle closes back above it. Meanwhile an oscillator lifts off its floor, which backs the bounce. The chart below marks that reaction at S1.
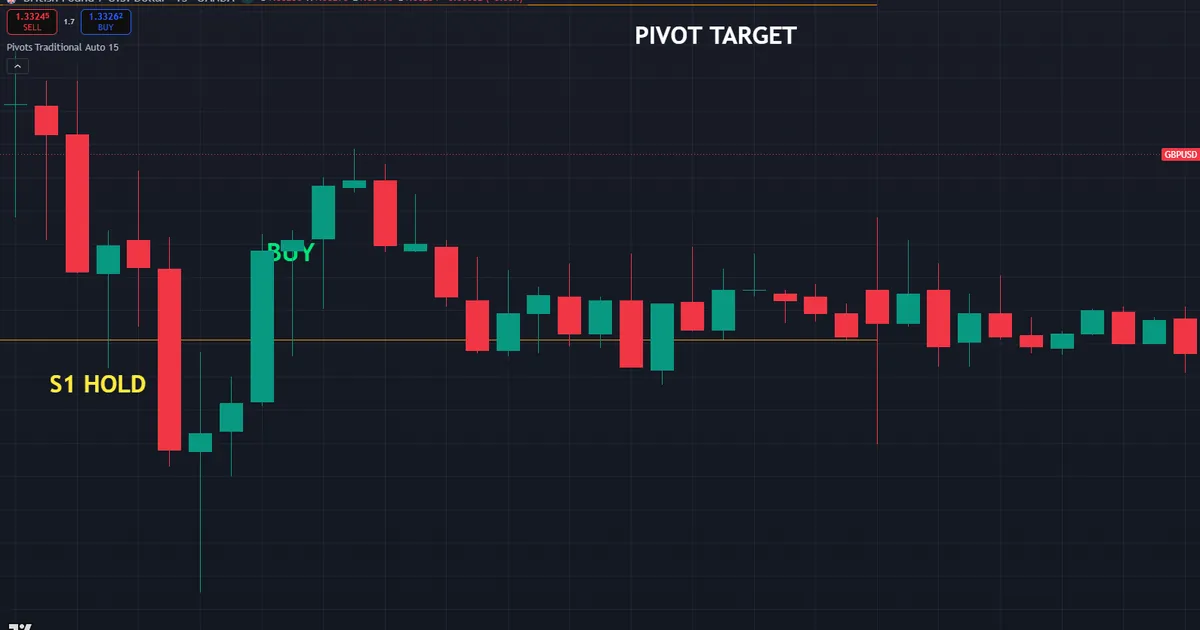
Now the trade builds itself. A trader buys as the candle closes near 1.3361, with a stop below S1 around 1.3343. That places roughly 18 pips of risk on the trade, and the central pivot at 1.3377 makes a clear first target. Because the level held with confirmation, the setup carried real weight.
The follow-through rewarded the read. Price climbed back to the pivot, paused, then pushed on toward R1 near 1.3395. So S1 acted as support and the pivot became the first waypoint. That is the tool working as floor traders intended.
Managing the Trade After Entry
A clean signal is only half the job. The exit decides the result. So plan your targets before the trade goes live, and let the levels guide the way out.
In this GBPUSD case, the pivot and R1 offer natural profit stops. You can bank part of the trade at the pivot and trail the rest toward R1. Because the levels are set in advance, your exits stay planned rather than emotional.
What a Level-Blind Trader Missed
Notice the edge the map provided. A trader with no pivots would have seen only a falling candle near 1.3356 and perhaps sold into it. Meanwhile the pivot trader knew a well-watched support sat right there. Because the level was marked in advance, the bounce became a plan rather than a surprise.
The pre-set target helped just as much. With the pivot already drawn at 1.3377, the exit needed no guesswork mid-trade. So the map framed both the entry at S1 and the first profit stop above it, which kept the whole plan calm and mechanical.
Download the complete indicator database
Put these concepts on your charts. One email unlocks the full library of 1,380+ indicators with compiled MT4 and MT5 files, plus my TradingView scripts. No paywall, no spam, unsubscribe any time.
Get free access to my indicator database
One email unlocks 1,380+ free MT4, MT5 and TradingView indicators — the complete library. No single-tool download; you get the whole database.
Common Mistakes and How to Fix Them
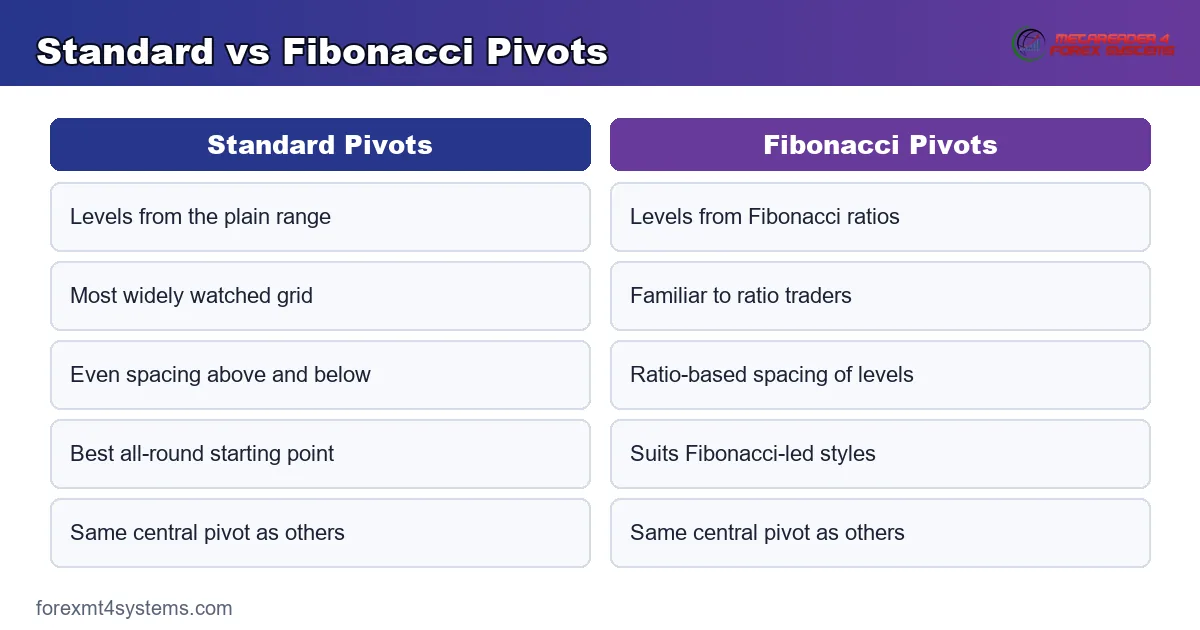
The tool is simple, yet the same errors repeat on every session. Most trace back to treating a level as a wall, and the fixes follow beneath the graphic.
Trading a Level Without Confirmation
A pivot is a zone of interest, not a certain reversal. Buying blindly at S1 ignores the chance of a clean break. So wait for a candle to confirm the bounce before you commit.
Using the Wrong Period
Feeding weekly data into a scalp chart gives levels too wide to trade. The pivots sit far from price and rarely trigger. Instead, match the period to your timeframe, with daily pivots for intraday work.
Ignoring the Trend
In a strong trend, price can slice through several levels without pausing. Fading every level then fights the move. So respect the larger trend, and favour bounces that agree with it.
Crowding the Chart With Every Type
Loading standard, Fibonacci, and Camarilla pivots at once buries price in lines. The levels contradict each other and stall your read. Instead, pick one type and learn it well before you add another.
Forgetting the Higher Timeframe
A bounce at S1 means little against a hard daily downtrend. Truly, the higher timeframe frames every intraday level. So check the daily direction before you trust a pivot bounce.
Pre-Trade Pivot Point Checklist
Run this short list before every entry. A few seconds here saves hours of regret later. So slow down, tick each item, and let a failed check keep you out of a marginal trade.
- Higher-timeframe trend read on the daily and four-hour charts.
- Pivot period matched to your working timeframe.
- Price reacting at a level, not floating between them.
- A candle confirming the bounce or the break.
- Momentum from an oscillator backing the move.
- Stop set just beyond the level, with a clear next level as target.
- An active session, London or New York, open now.
When Pivot Points Fail
Study the failure case as hard as the winner. Here is a common one. GBPUSD trends down hard through the New York session on the fifteen-minute chart. A trader buys every support level, sure each one must hold.
Then the losses stack up. Price cuts through S1, then S2, barely pausing at either. Each bounce lasts a candle or two before sellers take over again. The chart below shows that slide, with price slicing the support levels in a strong downtrend.
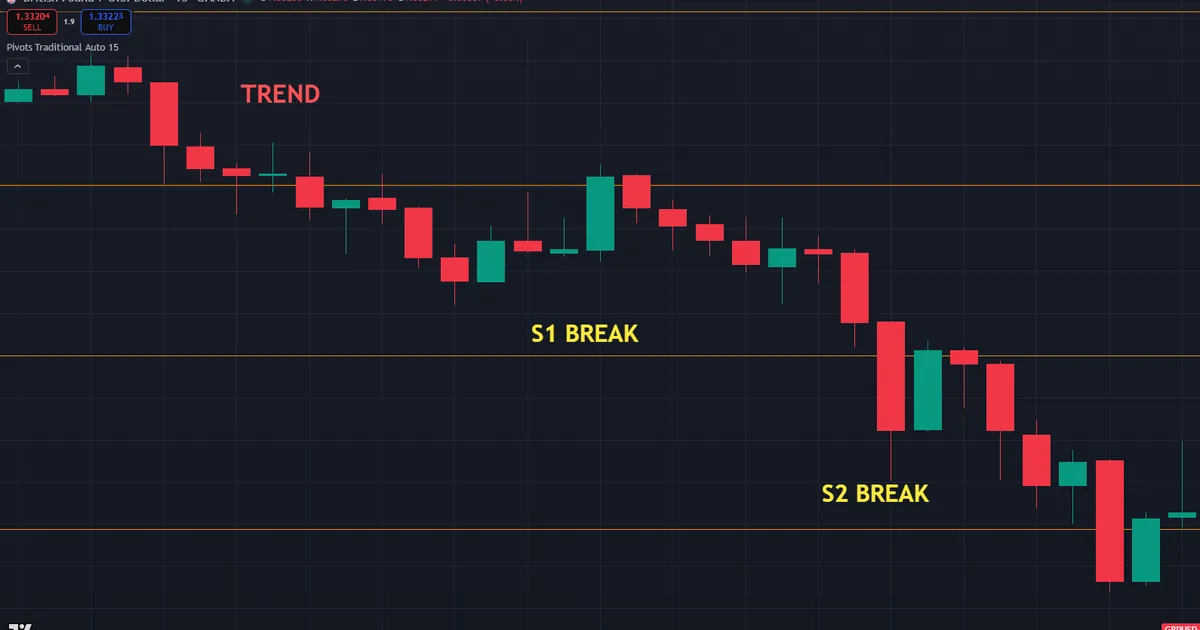
So what went wrong? The market had a powerful trend, and pivots work best in balanced conditions. In a hard trend, support levels give way one after another. Hence the rule that limits the damage: never fade a level against a strong trend.
Then size each trade so a broken level costs little. A sensible stop flows from the next level, and position size flows from that stop, which our free position size calculator works out in seconds. Because the risk stayed small, a broken level stung rather than wounded.
Levels Fail Around News
Be honest about news too. Pivots read only past price, so they cannot see a data release coming. A single news candle can gap straight through several levels. So check the calendar, and stand aside around a major release.
Thin Sessions Blur the Levels
Be honest about the quiet hours as well. In the thin Asian session, price often drifts through pivots with no reaction. So a level that looks strong on paper can mean little at 2:00 a.m. New York time. Wait for London or New York to bring the volume that makes levels bite.
One Tool Among Many
Be honest about the limits of any single method. Pivots frame price levels, yet they say nothing about momentum, volume, or the wider trend. So a level in isolation is only a starting point, never a full trade plan.
Treat the grid as one input among several. Pair it with a trend read, a momentum tool, and plain price structure. Because several signals agreeing beat any lone level, the pivots work best inside a broader routine rather than on their own.
Related Concepts to Study Next
Pivot points connect to a web of sibling ideas, and a few deserve your next reading hour. Start with our practical guide on how to use pivot points for step-by-step entries. Then compare the recipes in our guide to the types of pivot points to pick the flavour that fits your style.
Two more resources sharpen the work. Because pivots are really pre-drawn support and resistance, read our guide to support and resistance to place levels by hand as well. Then speed up the maths with our free pivot point calculator, which builds the whole grid from three prices.
For deeper level work, our free Fibonacci calculator maps the ratios behind Fibonacci pivots, while the pivot point indicators archive plots the levels for you. The Fibonacci indicators archive rounds out the ratio-based tools nearby. Tools speed the work, yet the logic above still carries the trade. So learn the rules first, and let any indicator plot what you already understand.
FAQ
What is the pivot point formula?
The central pivot is the prior high, low, and close added together, then divided by three. From there, R1 is double the pivot minus the low, and S1 is double the pivot minus the high. The wider R2 and S2 add and subtract the prior range.
What period should I use for pivot points?
Day traders usually set daily pivots from the prior session. Swing traders step up to weekly or monthly pivots. Match the period to your timeframe, with daily levels for intraday charts and weekly for higher ones.
Which type of pivot point is best?
No single type wins for everyone. Standard pivots are the most watched and react most cleanly, so they suit most traders. Fibonacci, Camarilla, Woodie, and DeMark variations tweak the spacing for different styles.
Do pivot points work in forex?
Yes, they are popular in forex because the market trades around the clock with clear sessions. The daily levels help frame the London and New York ranges. Still, they work best in balanced markets rather than strong trends.
Can I trade pivot points alone?
You can, but most traders add confirmation. A candle signal and a momentum read make a level far more reliable. Because a pivot is a zone of interest rather than a certain turn, that extra check filters weak setups.
Are pivot points reliable every day?
They react well on balanced days and give way in strong trends. On a hard trend day, price can slice through several levels in a row. Manage risk on every trade. Results are not guaranteed; past performance is not indicative of future results.
External references
- For background on this concept, see Pivot at Investopedia.
- For broader market context, see Pivot Point at Corporate Finance Institute.

About the author
Written by Dominic Walsh, a Forex trader and MT4/MT5 indicator, Expert Advisor and script developer. Every tool on forexmt4systems.com is tested on live charts before release and ships with ready-to-use compiled MT4 (.ex4) and MT5 (.ex5) files. Learn more about the trader and developer behind this site.
How we build, test and correct every tool: Editorial & Testing Policy. Trading carries risk; see the disclaimer.