
Ask what is Ichimoku Cloud, and most charts answer with a wall of colour that scares beginners off. The tool stacks five lines and a shaded band onto price, all at once. Yet the design hides a simple goal: show trend, momentum, and support in one glance.
This guide answers the what is Ichimoku Cloud question in plain steps. So by the end, you will know each line, how the cloud works, and how to trade the system without drowning in detail.
What Is Ichimoku Cloud, Really
Ichimoku Cloud is a full trading system, not a single line. A Japanese journalist named Goichi Hosoda built it over decades and published it in the late 1960s. Its formal name, Ichimoku Kinko Hyo, roughly means a one-glance balance chart in Japanese.
The system draws five components on the chart. Two fast lines track short and medium momentum. Two more lines project forward to form the cloud, and a fifth line lags behind to confirm. Together they paint a picture of where price stands against its own recent balance. Each part adds a layer, yet the whole still reads at a single glance.
The cloud, or Kumo, is the heart of it. That shaded band shows a zone of support in an uptrend and resistance in a downtrend. Because the band has real thickness, it marks a range rather than a single line, which makes it far harder for price to slice through cleanly.
Look at a concrete case. The chart shows USDJPY on the four-hour timeframe with the full Ichimoku set applied. Price trades above a rising green cloud near 162, and the fast lines sit above the slow line. That single frame flags a healthy uptrend.

Now read the picture as a whole. Price above the cloud favours buyers, and price below it favours sellers. So the very first question the system answers is direction, before any finer signal appears on the chart. Everything else builds on that one basic read.
Why Traders Value It
The appeal is speed of judgement. One look tells you the trend, the momentum, and the nearest support or resistance. Because the tool bundles those reads together, it saves you from stacking three or four separate indicators on a single chart.
The system also builds in a forward view. The cloud plots ahead of price, so you can see support and resistance forming before price arrives. So a trader gets a map of the road ahead, not merely a mirror of the past. That forward projection sets Ichimoku apart from most other trend tools.
The Five Lines of Ichimoku
The math is small once you break it apart. Five components make up the system, and each one has a clear job.
- Tenkan-sen, the conversion line. Average the highest high and lowest low over the last 9 bars. This fast line tracks short-term momentum.
- Kijun-sen, the base line. Average the highest high and lowest low over the last 26 bars. This slower line marks the medium trend and often acts as support.
- Senkou Span A, leading span A. Average the Tenkan and Kijun, then plot it 26 bars ahead. This forms one edge of the cloud.
- Senkou Span B, leading span B. Average the highest high and lowest low over 52 bars, then plot it 26 bars ahead. This forms the other cloud edge.
- Chikou Span, the lagging span. Plot the current close 26 bars back. A clear read here confirms the trend the other lines suggest.
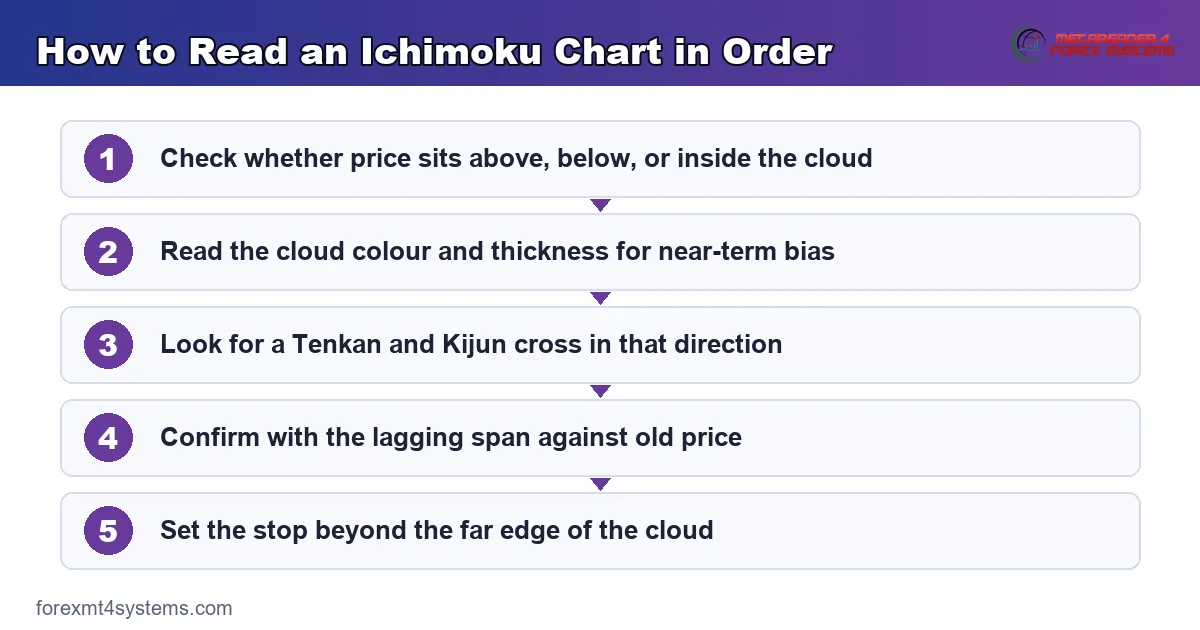
So two lines read momentum, two project the cloud, and one lags for confirmation. The concept graphic below shows how the pieces fit together.
The Default 9, 26, 52 Settings
Those three numbers trace back to Hosoda’s original work. Back then, a Japanese trading month ran about 26 days, which set the middle number. A half-month and two months around it gave the 9 and the 52.
Many traders keep these defaults out of respect for that shared attention. Because so many eyes watch the same lines, the levels carry weight. So changing the settings can cut you off from the crowd that makes them work.
Reading the Two Fast Lines
The Tenkan and Kijun work much like a fast and slow moving average. When the Tenkan crosses above the Kijun, short momentum turns up. When it crosses below, momentum turns down.
The cross means most above or below the cloud. A bullish Tenkan and Kijun cross above a green cloud is a strong signal. The same cross below a red cloud carries far less weight, since it fights the larger trend.
The Base Line as Dynamic Support
The Kijun earns extra attention beyond its cross. In a healthy trend, price often pulls back to the base line and bounces. Because the line updates each bar, it trails the move and offers fresh entries along the way.
Watch how far price strays from the Kijun too. A market that races well above the base line has stretched itself. So a snap back toward that line becomes more likely, which makes it a natural spot to plan a pullback entry.
How the Two Leading Spans Form the Cloud
The cloud is simply the space between leading span A and leading span B. Span A moves faster, since it averages the two quick lines. Span B moves slower, since it averages a longer 52-bar range.
Their gap creates the shading. When span A pulls above span B, the cloud turns green and points up. When span B leads, the cloud turns red. So the twist where the two spans swap places, called the Kumo twist, often flags a shift in the larger trend.
How the Cloud Frames Trend and Support
The cloud does more than colour the chart. Its position, thickness, and colour each add a layer of meaning. Read all three together for the full message.
Position comes first. Price above the cloud means an uptrend, and price below means a downtrend. Price inside the cloud means the market is balanced, so most traders stand aside until it picks a side.
The distance from the cloud adds nuance. Price that pulls far above a green cloud shows a strong, possibly stretched uptrend. Price hugging the cloud shows a weaker trend that could roll over. So the gap between price and the Kumo hints at how much conviction sits behind the move.
Cloud Colour and Thickness
Colour flags the near-term bias. A green cloud forms when leading span A sits above span B, which points up. A red cloud forms when span B leads, which points down.
Thickness measures conviction. A thick cloud marks a strong zone that price rarely cuts in one move. A thin cloud offers weak support, so price can slice through it fast. So a thick green cloud beneath price is a comfortable place to hold a long.
The Lagging Span as a Filter
The Chikou Span looks backward, yet it earns its place. It plots the current close against price from 26 bars ago. When the lagging line sits above that old price, buyers hold the edge.
Use it as a final check. A trade that agrees with the Chikou Span has all five components aligned. Because the filter is strict, it keeps you out of many weak setups that the faster lines alone might tempt you into.
The line also flags open space above or below price. When the lagging span floats in clear air, price has room to run without old highs or lows in the way. So a clean lagging span often marks a smoother path for the trade.
Settings, Timeframes, and Pairing
Standard settings exist because traders watch them together. Self-fulfilling attention gives those numbers real weight.
Most traders keep 9, 26, and 52 across timeframes. The system works from the one-hour chart up to the daily and weekly. On lower timeframes, though, the cloud whips more, so many traders favour the four-hour and daily for cleaner reads.
Match the timeframe to your pace. A swing trader leans on the daily cloud for the major trend. A day trader drops to the one-hour or four-hour, yet still checks the higher cloud for context. So the higher timeframe always frames the lower one.
Pairing With Other Tools
Ichimoku already bundles several reads, so it needs little help. Still, a volatility tool sharpens your stops, since the system names the trend but not the risk. So pair it with a separate read of how far price tends to travel.
Price structure adds another layer. A cloud edge that lines up with a prior swing high carries extra weight. Because two ideas agree at the same level, the odds of a reaction improve. So map plain support and resistance alongside the cloud.
Respecting the Session Clock
Also respect the clock. Ichimoku signals read cleanest inside the London window and the New York morning, roughly 2:00 to 5:00 a.m. and 8:00 to 11:00 a.m. New York time. Because liquidity thins in the Asian session, the lines whip more and signals fail more often. So weigh the session before you trust a cross.
Worked Example: A Trend Trade on USDJPY
Picture USDJPY trending up on the four-hour chart, with price riding above a rising green cloud near 162. The trend has been in place for days. Then a routine pullback drags price down toward the top of the cloud.
Watch how the system behaves. Price dips to the cloud near 161.4 and stalls, while the Kijun line flattens just beneath. The Tenkan then curls back above the Kijun, and the lagging span still sits above old price. The chart below marks that cluster of signals.
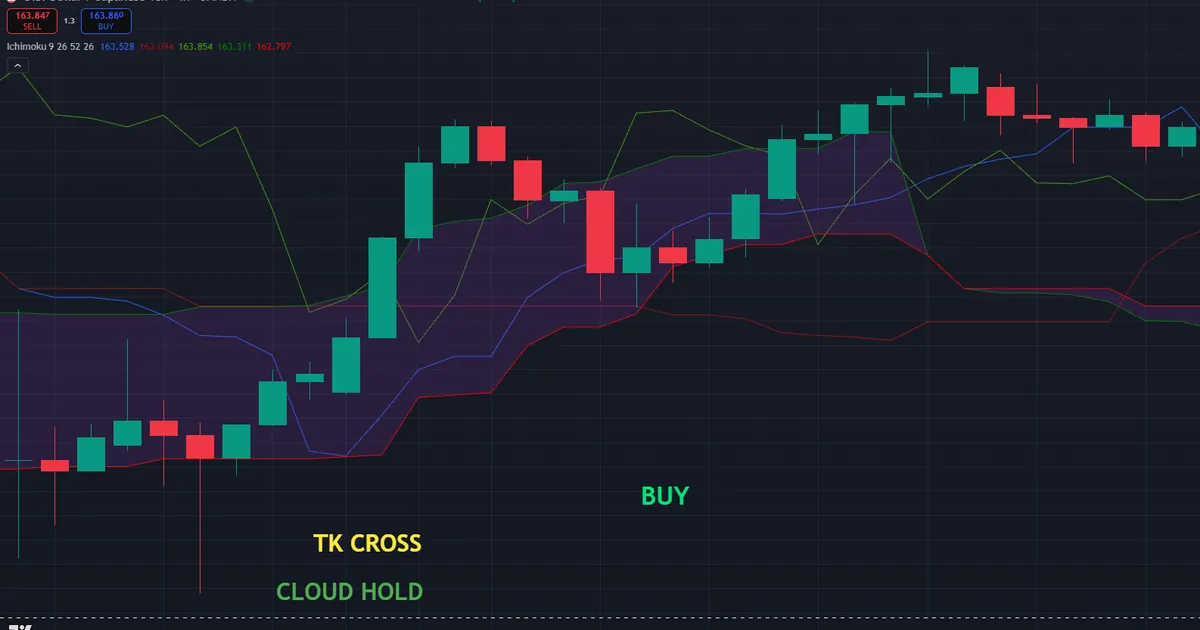
Now the trade builds itself. A trader buys as a bullish candle closes near 161.8, with a stop below the cloud around 160.9. That places roughly 90 pips of risk on the trade. Because every component agreed, the setup carried real weight.
The follow-through rewarded the read. Price pushed back toward 163.5, the cloud kept rising beneath it, and the fast lines led the way up. So the cloud held as support while the crossover timed the entry. That is the system working as Hosoda designed it.
Managing the Trade After Entry
A clean signal is only half the job. The exit decides the result. So plan a target before the trade goes live, and let the lines guide the hold.
In this USDJPY case, the rising Kijun offers a natural trailing stop. As price climbs, you can lift the stop under each new base-line level. Because the trend still runs, an early exit often leaves a good chunk of the move behind.
What a Single-Line Trader Missed
Notice the blind spot of reading one line alone. A trader watching only the Tenkan and Kijun cross would have jumped in without checking the cloud beneath. Meanwhile a trader watching only the cloud might have missed the exact moment momentum turned. Because this trader read all five parts, the entry stayed both early and safe.
The lagging span sealed the case. It sat above old price, so it agreed with the bullish read from the faster lines. Since every component pointed the same way, the trade carried the weight of the whole system rather than a single hint.
Download the complete indicator database
Put these concepts on your charts. One email unlocks the full library of 1,380+ indicators with compiled MT4 and MT5 files, plus my TradingView scripts. No paywall, no spam, unsubscribe any time.
Get free access to my indicator database
One email unlocks 1,380+ free MT4, MT5 and TradingView indicators — the complete library. No single-tool download; you get the whole database.
Common Mistakes and How to Fix Them
The system looks complex, yet the same errors repeat on every chart. Most trace back to reading one line in isolation, and the fixes follow beneath the graphic.

Trading a Cross Against the Cloud
A Tenkan and Kijun cross below a red cloud is a weak signal. Acting on it fights the larger trend. So take crosses that agree with the cloud, and skip the ones that argue with it.
Ignoring the Lagging Span
Many traders drop the Chikou Span to clean up the chart. Yet that line filters out weak setups the others miss. Instead, keep it on and require it to agree before you commit.
Trading Inside the Cloud
Price inside the cloud means the market is balanced. Signals there fail often, since no side holds control. So wait for price to clear the cloud before you trust a direction.
Changing the Settings Too Soon
New traders often tweak 9, 26, and 52 to chase a better fit. That habit cuts them off from the crowd that makes the levels work. Instead, learn the defaults first, and change them only after long testing.
Forgetting the Higher Timeframe
A bullish cloud on the one-hour means little against a falling daily cloud. Truly, the higher timeframe frames every lower-timeframe signal. So check the daily cloud before you trust an intraday setup.
Pre-Trade Ichimoku Checklist
Run this short list before every entry. A few seconds here saves hours of regret later. So slow down, tick each item, and let a failed check keep you out of a marginal trade.
- Higher-timeframe cloud read on the daily and four-hour charts.
- Price clearly above or below the cloud, not inside it.
- Cloud colour agreeing with your intended direction.
- A Tenkan and Kijun cross that matches the cloud.
- Lagging span confirming, above old price for longs.
- Stop distance set beyond the cloud or a volatility read.
- An active session, London or New York, open now.
When Ichimoku Fails
Study the failure case as hard as the winner. Here is a common one. EURUSD drifts sideways for days on the four-hour chart, and the cloud goes flat and thin near 1.14. A trader takes each Tenkan and Kijun cross anyway.
Then the losses stack up. Price chops in and out of the flat cloud, and every cross reverses within a few bars. The lagging span tangles with old price and offers no edge. The chart below shows that mess, with the flat cloud marked around the choppy range.

So what went wrong? The market had no trend, and Ichimoku is a trend system at heart. In a flat range, the cloud loses its meaning and the crosses fire at random. Hence the rule that limits the damage: stand aside when the cloud is flat and thin.
Then size each trade so a whipsaw costs little. A sensible stop flows from the cloud edge, and position size flows from that stop, which our free position size calculator works out in seconds. Because the risk stayed small, a string of false crosses stung rather than wounded.
Lag Cuts Into Every Signal
Be honest about the built-in cost. The lines average past price, so every signal arrives a little late. In a fast reversal, that lag can hand back part of the move. So pair the system with a faster read, such as a candle signal, to shave the delay at a turn.
A Crowded Chart Hides the Read
Be honest about the clutter too. Five lines and a cloud can overwhelm a new trader. So learn each piece on its own first, then read them together. Because a clear head beats a busy chart, simplicity in your process matters as much as the tool.
News Can Override the Whole System
Be honest about a shared blind spot as well. Every line reads only past price, so none of them sees a rate decision coming. A single news candle can gap price straight through a thick cloud and flip the read.
So check the economic calendar before you lean on any Ichimoku signal. Around a major release, step back and let the move settle. Because the system lags price, it lags fresh news even further, and that gap can prove costly.
Related Concepts to Study Next
Ichimoku connects to a web of sibling ideas, and a few deserve your next reading hour. Because the Tenkan and Kijun work like averages, start with our guide to moving averages. Then compare a simpler averaging pair in our SMA vs EMA guide to see how speed changes a signal.
Two more guides sharpen the picture. Since the cloud marks zones rather than lines, read our take on support and resistance to place those zones by hand. Then measure how far price tends to travel with our guide to ATR in trading, which helps you set stops beyond the cloud.
For hands-free charting, the Ichimoku indicators archive plots the full system for you, while the trend indicators archive gathers the tools that confirm direction around it. Tools speed the work, yet the logic above still carries the trade. So learn the rules first, and let any indicator plot what you already understand.
FAQ
What does the Ichimoku Cloud show?
It shows trend, momentum, and support or resistance in one view. Price above the cloud favours buyers, and price below favours sellers. The five lines together read the balance between price and its recent range.
Who created the Ichimoku Cloud?
A Japanese journalist named Goichi Hosoda designed it over several decades and published it in the late 1960s. Its full name, Ichimoku Kinko Hyo, means a balance chart at a glance. A team of assistants helped him test the settings.
What are the standard Ichimoku settings?
The defaults are 9, 26, and 52. Those numbers set the conversion line, the base line, and leading span B. Most traders keep them, since so many eyes watch the same levels.
Is the Ichimoku Cloud good for beginners?
It can be, once you learn each line in turn. The full chart looks busy at first, yet the core rule is simple. Trade with the cloud, not against it, and add the finer signals as you grow comfortable.
Which timeframe works best for Ichimoku?
Many traders favour the four-hour and daily charts for cleaner reads. Lower timeframes make the cloud whip more and produce more false signals. Always check a higher timeframe for the larger trend before you act.
Does the Ichimoku Cloud work in every market?
It works best in trending markets and struggles in flat, choppy ranges. In a range, the cloud goes thin and the crosses fire at random. Manage risk on every trade. Results are not guaranteed; past performance is not indicative of future results.
External references
- For background on this concept, see Ichimoku Cloud at Corporate Finance Institute.
- For broader market context, see Ichimoku Kinko Hyo at BabyPips.

About the author
Written by Dominic Walsh, a Forex trader and MT4/MT5 indicator, Expert Advisor and script developer. Every tool on forexmt4systems.com is tested on live charts before release and ships with ready-to-use compiled MT4 (.ex4) and MT5 (.ex5) files. Learn more about the trader and developer behind this site.
How we build, test and correct every tool: Editorial & Testing Policy. Trading carries risk; see the disclaimer.