
Market structure in forex is the map of swing highs and swing lows that price leaves behind on every chart. Read it well, and each candle stops looking random. Read it poorly, and even a clean trend feels like noise.
This guide shows you how to map that structure step by step. So by the end, you will label the swings with confidence, tell a continuation break from a reversal break, and read internal and external structure on one chart.
What Is Market Structure in Forex?
Market structure is simply the pattern that price traces as it moves. In an advance, the market prints higher highs and higher lows. In a decline, it prints lower highs and lower lows. Each swing point is a footprint, and the sequence of footprints tells you who controls the tape.
Smart money traders lean on this idea heavily. Michael Huddleston, the Inner Circle Trader (ICT), built much of his teaching on reading structure before anything else. So the labels below are the shared language of that whole community.
Look at a concrete case. The chart shows EURUSD on the one-hour timeframe. Price stepped up from a swing low at 1.13986, printed a higher low at 1.14004, and pushed to a higher high at 1.14217. Those three points define the trend in one glance.
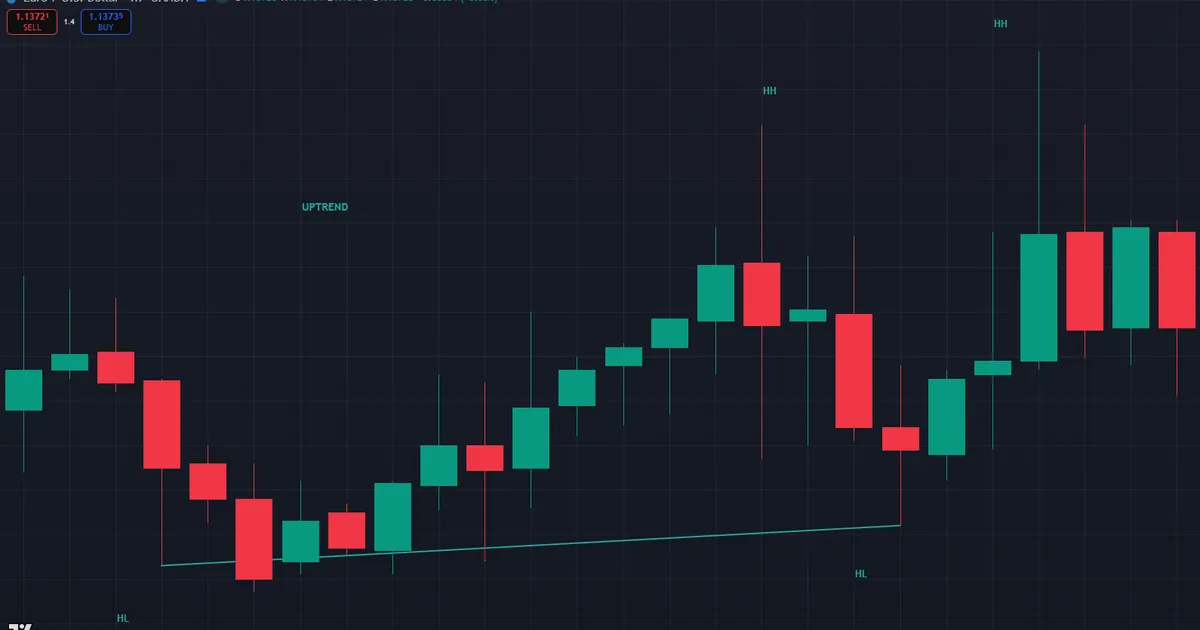
Now trace the frame from left to right. First, the 1.13986 low anchors the move. Then buyers defend the 1.14004 dip and drive through the prior peak. Because each low sits above the last, the structure stays bullish until a low finally breaks. That single rule keeps you on the right side far more often than any oscillator.
Why does this matter so much for real trades? Structure sets your bias, your entry side, and your invalidation in one read. So a trader who maps it well already knows where the idea dies before the position goes live. Meanwhile, a trader who skips it guesses at every turn. Indeed, most losing streaks trace back to fighting a trend the chart had already labeled.
Higher Highs, Lower Lows, and the Trend Language
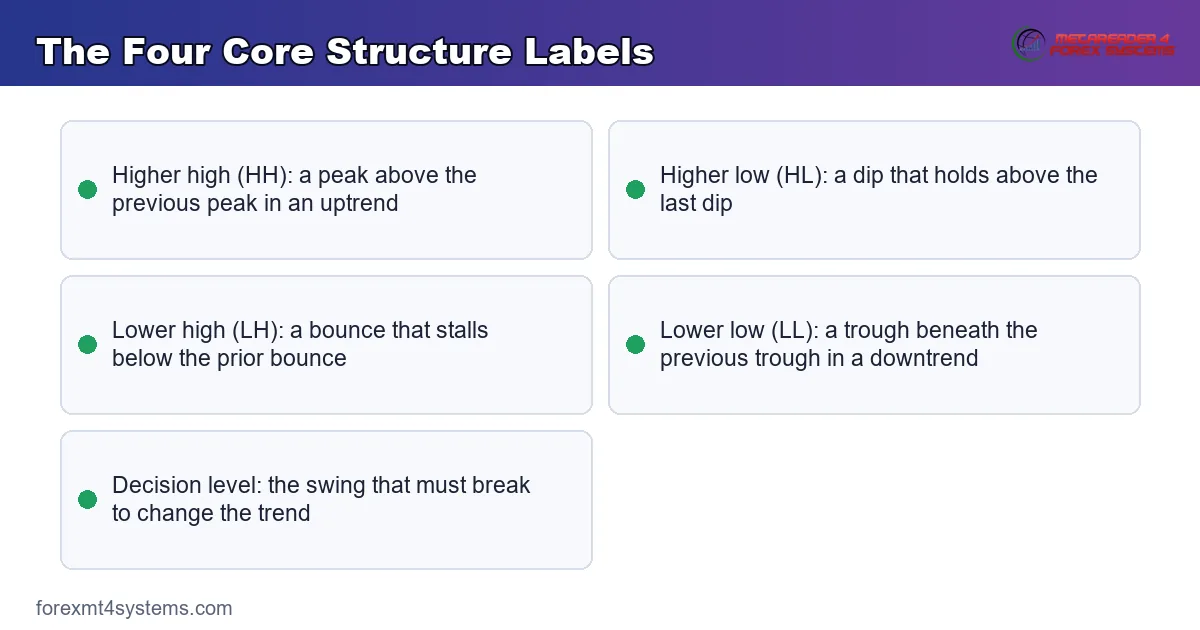
The vocabulary is small, so learn it once and reuse it forever. Four labels cover almost every chart you will ever mark.
Reading an Uptrend
An uptrend is a stack of higher highs (HH) and higher lows (HL). Each pullback stops above the previous one. So long as the most recent higher low holds, buyers stay in charge. The moment price closes below that low, the uptrend is in question.
Also watch the spacing. Healthy advances leave clean, obvious swings. Meanwhile, choppy overlapping candles warn that the trend is tired and a range may be forming.
Reading a Downtrend
A downtrend mirrors the same idea. It stacks lower highs (LH) and lower lows (LL), and every bounce stalls beneath the last one. Sellers hold control while the newest lower high caps price. Then a close above that high flips the question the other way.
So the trend read reduces to one question. Which swing must break to change the story? In an uptrend, that is the last higher low. In a downtrend, it is the last lower high. Mark that single level on every chart, and you always know where your bias flips. Everything else is commentary around that one decision point.
Truly, that is the entire framework. Everything else in this guide just adds precision to these four labels.
Choosing the Swings That Count
Not every high and low deserves a label. A swing high needs at least one lower candle on each side of it, and a swing low needs one higher candle on each side. Larger fractals, using two or three candles per side, filter the noise even more. So the stricter your swing rule, the cleaner your map.
Then keep the count honest. Two or three well-chosen swings usually describe a trend better than a dozen tiny ones. Instead of marking everything, mark the points a whole session clearly respected.
How to Map Market Structure Step by Step
Mapping is a repeatable routine, not an art. Follow these five steps on any pair and any timeframe, and your charts will read the same way every session.
- Pick one timeframe first. Start on the four-hour or one-hour chart so the swings are large and obvious.
- Mark the last major swing high and swing low. These two points frame the current range you are trading inside.
- Label each swing in order. Tag every high and low as HH, HL, LH, or LL as price prints it.
- Find the decision level. Locate the swing low in an uptrend, or the swing high in a downtrend, that must break to change the story.
- Re-label only on a body close. Wait for a candle body through the level, never a wick, before you change the trend read.
So the routine takes under a minute once it becomes habit. Next, the concept graphic below compresses the four labels into one reference you can keep beside your charts.
BOS vs CHoCH: Continuation or Reversal
Two break types matter above all others. Both describe a swing point giving way, yet they point in opposite directions.
A break of structure (BOS) is a continuation. In an uptrend, price closes above the prior higher high, and the advance simply extends. Hence a BOS confirms that the current trend still has fuel. Traders often add to winners on a fresh BOS, since the read simply repeats itself and the risk stays defined.
A change of character (CHoCH) is the first counter-trend break. In that same uptrend, a CHoCH is the moment price closes below the last higher low. So it warns that control may be shifting to sellers. We compare these two events in detail in our guide to BOS vs CHoCH, and the stronger, displacement-driven version appears in our market structure shift walkthrough.
Keep the pair straight and half the confusion disappears. First a CHoCH warns of a turn. Then a fresh BOS in the new direction confirms it. That one-two rhythm underpins most smart money entries.
Internal vs External Structure
Structure lives on two scales at once, and mixing them causes most mislabels. External structure is the big picture. Internal structure is the detail inside it.
External structure tracks the major swing highs and lows that define the trend on your working timeframe. These are the levels a whole session respects. Internal structure tracks the smaller swings that form between two external points while price ranges.
Think of external structure as the headline and internal structure as the fine print. The headline sets your bias for the whole session. Then the fine print times your entry once price reaches an external level. So both matter, yet they answer different questions and deserve different weight.
So an internal CHoCH inside a pullback does not flip the major trend. It only signals that the retracement leg is turning. Traders who react to every internal wiggle get shaken out constantly. Instead, weigh internal breaks against the external map before acting. When both agree, the signal is far cleaner.
Here is a practical way to hold both scales at once. Draw the external swing high and swing low as bold lines, then sketch the internal swings lightly between them. Because the two layers now sit on one chart, you can see when an internal turn lines up with an external level. That overlap is where the best smart money entries hide. Meanwhile, internal breaks far from any external level rarely lead anywhere useful.
Where Structure Sits in the SMC Workflow
Structure is the foundation, not the whole house. The full smart money routine runs from the top down, and each layer narrows the decision.
First, set the higher-timeframe bias on the daily and four-hour charts by reading external structure. Second, mark a point of interest, such as an order block or fair value gap, where price is likely to react. Our full guide to order block trading covers how to grade those zones.
Then drop to the five-minute or fifteen-minute chart for the trigger. There you wait for an internal CHoCH to confirm the turn inside your zone. Only after that confirmation do you plan an entry, a stop beyond the sweep, and a target at the next liquidity pool.
Also respect the clock. The cleanest structure breaks tend to print inside the London window, 2:00 to 5:00 a.m. New York time, and the New York morning, 8:30 to 11:00 a.m. Our free forex market hours tool shows when those windows open in your local time.
Pair the timeframes deliberately. A common split anchors the bias on the four-hour chart, marks the zone on the one-hour, and executes off the five-minute break. Because each layer answers a different question, the process stays clean. First the daily and four-hour set direction. Then the one-hour finds the level. Finally the five-minute times the entry. Skip a layer, and the model turns back into guesswork.
Worked Example: A Bearish Continuation
Picture GBPUSD trending down through the London session on the one-hour chart. Price prints a lower high at 1.2760, then a lower low at 1.2694. A bounce follows, but it stalls at 1.2738, below the prior high. So the downtrend structure stays intact.
Then the continuation fires. Two bearish candles drive through the 1.2694 lower low and close at 1.2671. That break is a BOS, and it confirms sellers still hold control. Traders using this model wait for a pullback into the small gap left near 1.2708.
Now the trade builds itself. A short inside that gap carries a stop above the 1.2738 lower high, roughly 32 pips of risk. Meanwhile, the first target sits at the next resting liquidity beneath 1.2640. The structure never changed, so the plan stayed simple.
The aftermath rewarded patience. Price ground lower over the next two sessions and tagged the pool under 1.2640 without ever closing back above the 1.2738 high. So the invalidation line never moved once. That steadiness is what a healthy continuation looks like after entry, and it is far easier to sit through than a guessed trade.
Worked Example 2: A Bullish Reversal on EURUSD
Now run the mirror case, step by step, in the opposite direction. EURUSD has fallen through the morning and prints lower lows at 1.14095 and 1.14060. A cluster of highs rests near 1.14128, the last lower high a bullish turn must reclaim.
First comes the warning. Price sweeps the 1.14060 low, then snaps back and closes above the last lower high at 1.14128. That close is a CHoCH, the first sign the decline may be ending. The chart below marks the sweep, the CHoCH, and the entry zone.

Then the confirmation arrives. Price retraces into a fair value gap between 1.14148 and 1.14180, holds, and pushes to a fresh higher high with a BOS above 1.14282. That break confirms the new direction. So a long inside the gap carries a stop under the 1.14060 sweep low, with the first target at the highs near 1.14217 and the session high beyond.
Notice that the sequence never changed, only the direction. Sweep first, then a CHoCH against the trend, then a retrace into the gap, then a BOS to confirm. Because that rhythm repeats across pairs and timeframes, learning it once pays off everywhere. Also note the risk stayed defined: the stop sat just beyond the swept low, and the reward reached toward the resting liquidity above.
Download the complete indicator database
Put these concepts on your charts. One email unlocks the full library of 1,380+ indicators with compiled MT4 and MT5 files, plus my TradingView scripts. No paywall, no spam, unsubscribe any time.
Get free access to my indicator database
One email unlocks 1,380+ free MT4, MT5 and TradingView indicators — the complete library. No single-tool download; you get the whole database.
Common Mistakes and How to Fix Them
The concept is simple, yet the same execution errors repeat. The graphic below collects the traps we see most, and the fixes follow beneath it.

Marking Every Wiggle as a Swing
Tiny internal swings break constantly, and none of them flip the trend. So mark only the swings that produced a meaningful high or low. Minor overlapping candles are noise, not structure.
Confusing a Wick With a Break
A wick through a level is a liquidity sweep, often the opposite of a real break. Instead, demand at least one candle body closing beyond the swing before you re-label the trend.
Ignoring the Higher Timeframe
A five-minute CHoCH against a strong daily trend usually delivers a shallow pullback, not a reversal. So check the external structure on the daily chart before you flip your bias on any intraday break.
Reacting to Internal Structure Alone
Internal breaks inside a pullback rarely change the major story. Truly, chasing each one is a fast way to overtrade. Weigh every internal break against the external map first, and act only when both align.
Forgetting the Session Clock
Breaks that print in dead hours often reverse once London or New York opens. Hence treat structure formed in quiet Asian hours with extra caution until an active session confirms it.
Moving the Invalidation After Entry
The stop belongs beyond the level that would prove the read wrong. So set it once, then leave it alone. Widening a stop to avoid a loss simply turns a small, planned cost into a large, unplanned one. Discipline on this single point separates traders who last from those who do not.
Pre-Trade Structure Checklist
Run this short list before every entry. A few seconds here saves hours of regret later.
- External trend labeled on the daily and four-hour charts.
- The current decision level marked clearly on your working timeframe.
- A CHoCH printed against the prior trend, confirmed by a body close.
- A fresh BOS in the new direction after the CHoCH.
- Internal and external structure pointing the same way.
- An active session window, London or New York, open now.
- Entry, stop, and target planned before the trade goes live.
When Structure Reading Fails
Study the failure case as hard as the success case. Here is a common one. EURUSD prints a clean bullish CHoCH on the fifteen-minute chart: a low near 1.14070 swept, then a close above the last lower high. Every box looks ticked.
Then the move unravels. Price fails to make a higher high, rolls over, and closes back below the swept low. The chart below shows that breakdown, with the reclaimed level marked.

So what went wrong? Usually the higher timeframe. In this case the daily structure still pointed firmly down, and the intraday CHoCH fought that flow. The market treated the whole bounce as a discount to sell. Hence the invalidation rule that limits the damage: once price closes back beyond the swept extreme, the reversal idea is dead. Exit at once, without widening the stop.
Then log the trade while it stays fresh. Note the pair, the session, the external trend, and which checklist items had ticked. Review a few dozen of these, and a pattern appears: failed reads cluster in ranging days and counter-trend contexts. Our trade journal makes that review quick.
Three journal fields matter most for structure trades. First, log whether the higher timeframe agreed or fought the entry. Second, record how far price ran before the read failed. Third, note whether a real sweep preceded the CHoCH or you skipped that step. Review those three columns monthly, and your personal filter rules practically write themselves. Truly, a written record turns each loss into tuition rather than pure cost.
Ranging Markets Blur the Labels
Be honest about the biggest failure mode. In a range, price breaks swings in both directions all session, and every read dies within a few candles. So if the daily chart shows a sideways box, stand down and wait. Structure trading rewards trends, and it punishes traders who force it inside chop.
Related Concepts to Study Next
Structure connects to a web of sibling ideas, and two deserve your next reading hour. Draw on liquidity explains where the market is likely heading once structure turns, so read our guide to draw on liquidity next. Meanwhile, internal and external range liquidity deepens the two-scale idea from earlier; our guide to internal and external range liquidity shows how to trade the levels between the swings.
For hands-free labeling, the IDM CHoCH BOS indicator marks these breaks in real time, and the wider set of smart money indicators covers the sweeps and gaps around them. Tools speed the work, but the labels above still carry the logic.
FAQ
What is market structure in forex trading?
Market structure is the sequence of swing highs and swing lows that price prints on a chart. Higher highs and higher lows mark an uptrend, while lower highs and lower lows mark a downtrend. Reading that sequence tells you which side controls the move.
What is the difference between BOS and CHoCH?
A break of structure (BOS) is a continuation in the direction of the current trend. A change of character (CHoCH) is the first break against that trend, warning of a possible turn. So a CHoCH hints at a reversal, and a following BOS confirms it.
What are internal and external structure?
External structure tracks the major swing points that define the trend on your working timeframe. Internal structure tracks the smaller swings that form between two external points. Weigh internal breaks against the external map before you act on them.
What timeframe is best for reading market structure?
Most traders set the bias on the daily and four-hour charts, then execute off the five-minute or fifteen-minute chart. Higher timeframes give cleaner swings, while lower ones give earlier triggers. Pair them so the lower timeframe agrees with the higher one.
Does market structure work on all pairs?
The labels apply to every liquid forex pair and most other markets. Still, quiet pairs and dead sessions produce messier swings that break in both directions. So favor active majors during the London and New York windows for the cleanest reads.
How do I know when my structure read is wrong?
A close back beyond the level you traded against usually invalidates the read. Treat that reclaim as your exit rather than an excuse to hold. Manage risk on every trade. Results are not guaranteed; past performance is not indicative of future results.
External references
- For background on this concept, see Trend following on Wikipedia.
- For broader market context, see Consolidation at Investopedia.

About the author
Written by Dominic Walsh, a Forex trader and MT4/MT5 indicator, Expert Advisor and script developer. Every tool on forexmt4systems.com is tested on live charts before release and ships with ready-to-use compiled MT4 (.ex4) and MT5 (.ex5) files. Learn more about the trader and developer behind this site.
How we build, test and correct every tool: Editorial & Testing Policy. Trading carries risk; see the disclaimer.