
A breaker block is a failed order block that flips polarity after a liquidity sweep. So when traders ask what is a breaker block, the practical answer is: a supply or demand zone that broke, trapped one side of the market, and now works against them. By the end of this guide you will know how to spot both variants, mark the retest zone, and execute the entry with fixed rules.
The concept comes from Michael Huddleston, the Inner Circle Trader (ICT). Indeed, his framework treats a breaker as proof that trapped positions fuel the next leg. Plainly, you trade the retest of the level that broke them.
What Is a Breaker Block?
Start with the parent pattern. An order block is the last opposing candle before a strong directional move; the full guide to order block trading covers that base concept in depth. A breaker block begins life as one of these zones. Then price violates it. Instead of holding, the zone gives way to a displacement candle, and every trader who leaned on it sits offside.
That failure changes the level’s job. Now old demand becomes resistance, and old supply becomes support. Indeed, the idea mirrors classic support-and-resistance role reversal. Yet ICT adds one strict condition: before the zone breaks, price must sweep a nearby liquidity level, such as an old swing low or high. Without that sweep, the pattern is a mitigation block, which trades on different logic.
Whose orders power the flip
Two groups fuel the pattern, and naming them makes the logic concrete. First come the trapped traders. Sellers who shorted the original supply zone, plus breakout sellers who chased the sweep, all sit underwater once displacement runs against them. When price returns to their entry area, many exit near break-even, and every exit is an order in the new direction. Second come the aggressors. The players who drove the displacement built positions around the same level, so they often defend it on the retest rather than let the move unwind.
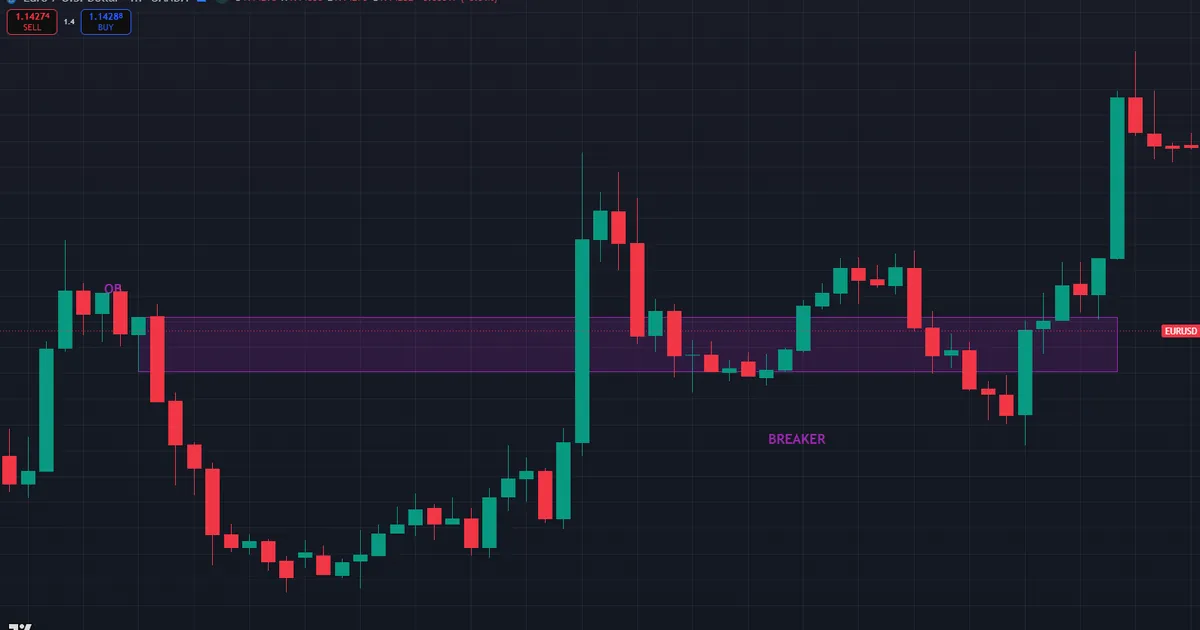
Stops add a third layer. Late shorts park their stops just above the flipped zone, and those resting buy stops give defenders extra fuel if price probes higher. Hence the retest is not a random bounce point. Rather, it is the exact price where obligation, regret, and fresh interest overlap. The chart below shows the pattern live on EURUSD H1 from July 13, 2026. A bearish order block at 1.14204-1.14309 breaks on a strong hourly close, price then retests the band from above, and the rally extends to 1.14750.
Bullish and Bearish Breaker Blocks
Bullish breaker block
A bullish breaker block forms in four moves. First, price sets a swing low. Next, it rallies into a short-term swing high. Then it drops below the original low and sweeps the sell-side liquidity resting under it. Finally, it reverses with force and closes above that swing high. The down-close candle at the swing high, the old bearish order block, is now a bullish breaker. Hence it should act as support on the retest.
Bearish breaker block
The bearish breaker block is the mirror image. Here price sets a swing high, pulls back to a swing low, then rallies above the old high to raid buy-side liquidity. Sellers absorb the raid, and price closes below the swing low with displacement. Now the up-close candle at the swing low, the old bullish order block, turns into resistance. Traders who bought the raid are trapped. Thus their exits add selling pressure on every push back into the zone.
Refining the zone before you trade it
Raw breaker candles often run wide, so most traders refine them. The candle body matters more than the wick, because the body marks where positions actually changed hands. Hence a common refinement trades only the body of the last opposing close, or its 50% midpoint, and treats the wick as noise. Freshness matters too. A breaker that price has already retested twice has spent most of its trapped-trader fuel, so first touches deserve priority. When two candidate candles sit side by side, pick the one closer to the sweep extreme, since it anchors the deeper and safer entry.
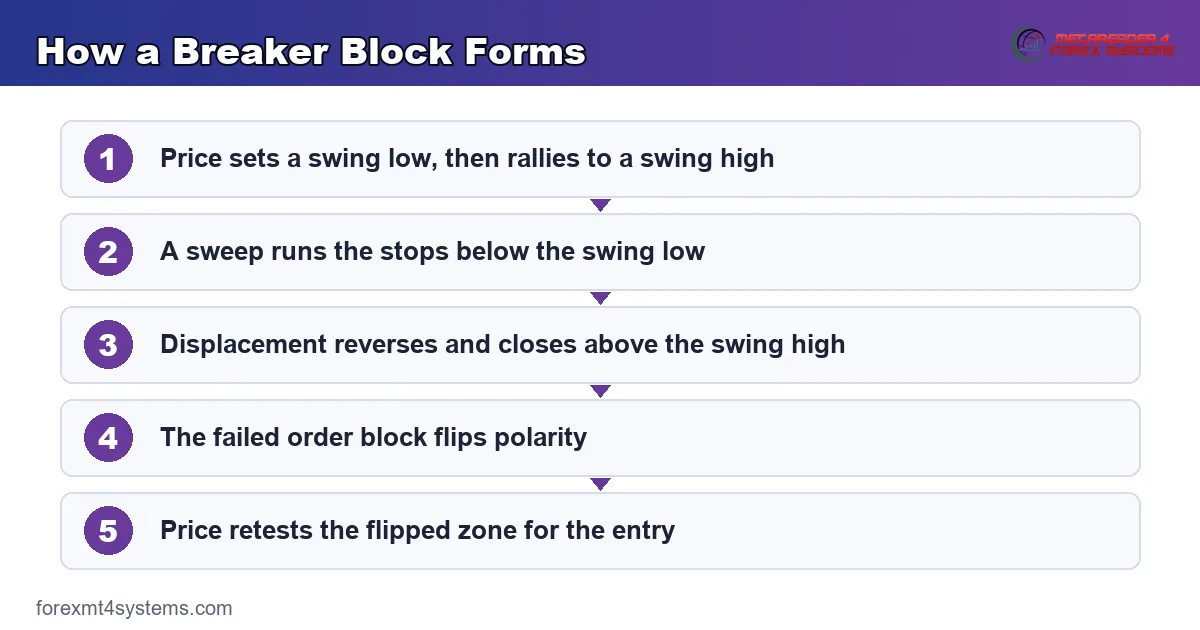
Labels blur fast on a messy chart. So if you struggle to separate the failed zone from the fresh one, the breaker block vs order block comparison walks through the tell-tale differences side by side. Meanwhile, the whole formation condenses into five stages, and the graphic below maps them in order.
How to Trade a Breaker Block: The Retest Model
The breaker block strategy is a patience game. You never chase the displacement leg. Instead, you wait for price to come back. Here is the full sequence for the bullish case; simply invert every step for the bearish version.
- Confirm the sweep. Price must trade below a prior swing low before reversing. No sweep, no breaker.
- Demand displacement. The reversal leg should break the swing high with one or more large-bodied candles, ideally leaving a fair value gap behind.
- Mark the breaker candle. Outline the highest down-close candle inside the broken swing high, from its high to its low.
- Wait for the retest. Then place a limit order inside the zone, or drop to a lower timeframe for a confirming shift in structure.
- Set the stop beyond the zone. A stop below the breaker low keeps risk tight; a stop below the sweep low survives deeper tests.
- Target opposing liquidity. Aim for the next pool of resting orders, such as an old high or an equal-highs cluster.
Confirmation on the lower timeframe
Many traders add a timing filter before entry. So instead of a blind limit order, they watch the five-minute chart while price sits inside the breaker. A small liquidity sweep plus a sharp structure break there signals that the zone is being defended. Also, a five-minute fair value gap forming off the zone gives a tighter stop anchor than the full breaker range. This filter costs a few pips of entry price. Still, it screens out many zones that were about to fail outright.
Confluence and trade management
Check the retracement depth as well. Breakers that overlap the 62-79% pullback band of the displacement leg carry extra confluence, and our Fibonacci calculator maps that band in seconds. Next, plan the exit before entry: many traders bank half the position at the first opposing liquidity pool and let the rest run toward the higher-timeframe target. Meanwhile, once price leaves the zone, trailing the stop behind each new five-minute swing protects the trade without choking it.
Sizing the position
Risk comes last in the checklist but first in importance. Decide the account risk per trade before the retest arrives, with most structured traders holding it around 1% or less. Then let the stop distance set the position size, never the reverse. A sixteen-pip stop simply means fewer lots than an eight-pip stop at the same account risk. Also resist the urge to widen a stop after entry to “give it room”, because that quietly doubles the risk the plan approved. When the numbers feel tight, the honest fix is a smaller size, not a looser invalidation.
Worked Example on EURUSD
Picture EURUSD on the one-hour chart. Price bases at 1.0812, rallies to 1.0851, then rolls over. During the London session it drops to 1.0798, fourteen pips through the 1.0812 low, and sweeps the sell stops parked beneath it. Then buyers step in. Two wide-range candles drive price through 1.0851 and up to 1.0876, confirming the break of structure.
Now mark the zone. The last down-close candle inside the 1.0851 swing high spans 1.0838 to 1.0853, so that band becomes the bullish breaker. At 9:30 a.m. New York time, price dips back into the zone and prints 1.0846. A long entry there carries a stop at 1.0830, just under the breaker low, for sixteen pips of risk. Meanwhile, the logical objective sits at 1.0900, where an old daily high and a cluster of equal highs hold resting buy-side liquidity. Thus the trade risks sixteen pips to pursue roughly fifty-four, a ratio near 1:3.4. Win or lose, the structure of sweep, break, and retest is what makes the setup valid.
Second Worked Example: A Bearish Breaker on USDJPY
Now run the short side, because the bearish sequence trips up more traders. USDJPY prints a swing high at 157.80 on the one-hour chart, then pulls back to a swing low at 157.32. During the New York morning, price pushes up to 157.95 and clips the buy stops resting above the old high. The raid finds no follow-through. Instead, sellers absorb the breakout, and one wide-bodied candle closes at 157.10, well below the 157.32 swing low. That close confirms displacement and shifts the hourly structure down.
Next, mark the flipped zone. The last up-close candle around the broken swing low spans 157.30 to 157.46, so that band becomes the bearish breaker. Two hours later, price grinds back up and prints 157.40 inside the zone. A short from 157.40 carries a stop at 157.58, above the breaker high, for eighteen pips of risk. Traders wanting extra room place it above the 157.95 sweep instead and accept the wider distance.
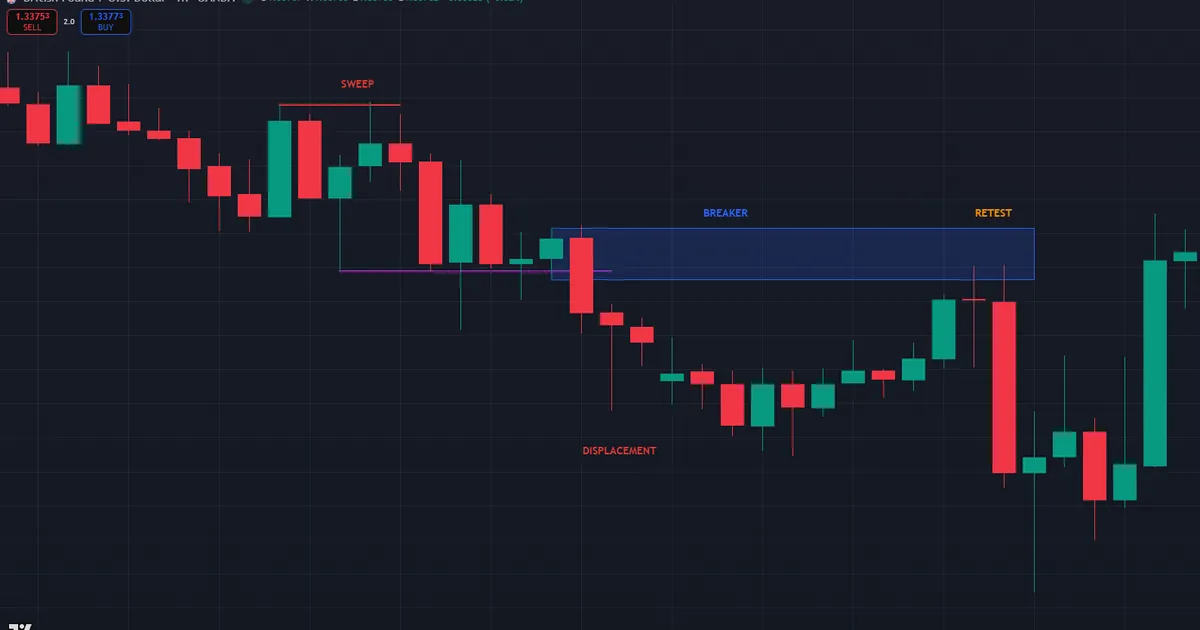
Target logic follows the liquidity map. The nearest sell-side pool sits at 156.60, an old daily low beneath a shelf of equal lows, roughly eighty pips away. So the plan risks eighteen pips against a target near 1:4, with half off at 157.00 and the stop moved to entry once price clears it. Every number comes from structure: the sweep defines the trap, the breaker defines the entry, and the resting liquidity defines the exit.
Where the Breaker Sits in the SMC Workflow
A breaker is one tool inside a larger sequence, not a standalone system. The workflow runs top-down. First, read higher-timeframe context on the daily and four-hour charts: the trend, the dealing range, and the liquidity pool price is drawing toward. Next, mark the points of interest along that path, and a fresh breaker is one candidate among order blocks and fair value gaps. Then wait for price to reach the zone, drop to the lower timeframe, and demand confirmation before any order goes in.
Download the complete indicator database
Put these concepts on your charts. One email unlocks the full library of 1,380+ indicators with compiled MT4 and MT5 files, plus my TradingView scripts. No paywall, no spam, unsubscribe any time.
Get free access to my indicator database
One email unlocks 1,380+ free MT4, MT5 and TradingView indicators — the complete library. No single-tool download; you get the whole database.
Timeframe pairing and session timing
Pairing timeframes keeps the process honest. A common split marks the breaker on the four-hour or one-hour chart, then times the entry on the five- or fifteen-minute chart. The higher timeframe supplies the zone and the target; the lower one supplies the trigger and the tight stop. Also mind the clock. The London kill zone runs roughly 2:00-5:00 a.m. New York time, and the New York kill zone runs about 7:00-10:00 a.m. So a breaker retest that fires inside those windows carries more weight than the same pattern in the quiet Asian range, because that is when real volume defends zones.
A full trading day shows the rhythm. Before London, the trader marks the daily draw and any four-hour breakers along the path. During the London kill zone, price either reaches a zone or it does not; no zone touch means no trade. Through the New York morning, the same map stays live, and a retest that arrives there gets the five-minute confirmation treatment. After lunch, the book closes for most setups, because late-day flips fail more often. That rhythm, repeated daily, is the whole job.
Labels and automation
Context also decides which label applies. When price reverses without sweeping the prior swing, the failed zone is a mitigation block, and it demands slightly different treatment. Meanwhile, software can handle the pattern hunting: our Breaker Block Reversal Engine for TradingView automates the sweep-and-break detection, and the wider library of ICT indicators for MT4 and MT5 covers the surrounding toolkit.
Common Breaker Block Mistakes
Most losses with this pattern trace back to a handful of repeat errors. Each one has a direct correction.
- Calling every failed zone a breaker. Without a sweep of the prior swing, the flip trades on mitigation logic, which is weaker. Correction: demand the raid before applying the label.
- Chasing the displacement leg. Entering mid-move leaves no logical stop and terrible location. Correction: wait for the retest or let the trade go.
- Marking the whole consolidation as the zone. A ten-candle rectangle is not a breaker. Correction: outline the specific last opposing close, high to low, and refine on the lower timeframe.
- Placing the stop inside the zone. Normal penetration then tags it before the reaction. Correction: park the stop beyond the breaker, or beyond the sweep extreme for deeper tests.
- Fighting the daily draw. A bullish breaker beneath heavy higher-timeframe supply fails more often than it holds. Correction: only trade flips that agree with the daily liquidity draw.
- Sizing up after a clean streak. Three textbook wins prove nothing about the fourth. Correction: keep risk per trade fixed and small.
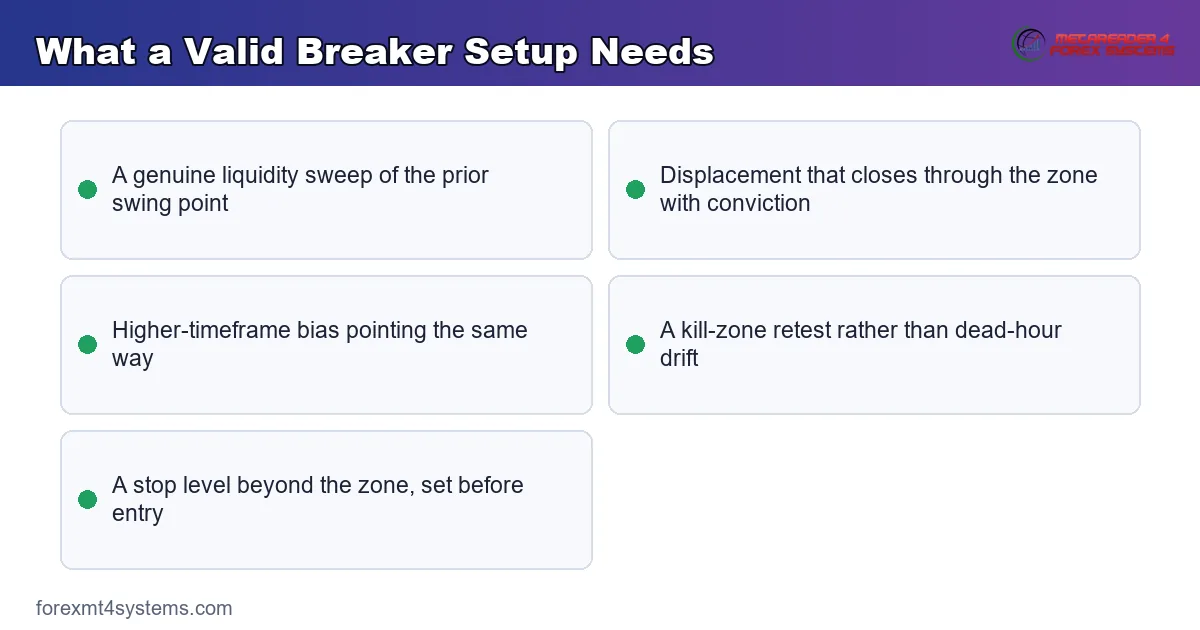
Notice the common thread: every mistake removes one of the pattern’s structural requirements. The graphic below compresses the requirements into a single reference card you can keep beside the charts.
Quick Pre-Trade Checklist
Run these checks in order before any breaker entry. If a single one fails, the setup is incomplete.
- Did price sweep a prior swing high or low before the break?
- Did displacement close through the zone with conviction, ideally leaving a gap?
- Is the marked candle the last opposing close, not a random rectangle?
- Does the trade direction agree with the daily draw on liquidity?
- Is the retest happening inside the London or New York kill zone?
- Is the stop parked beyond the breaker or the sweep extreme?
- Is there a clear liquidity target worth at least twice the risk?
Score the list honestly rather than optimistically. A setup passing five of seven checks is not a smaller trade; it is no trade. Traders who let one soft answer slide soon let two slide, and the checklist quietly stops meaning anything. Print it, keep it beside the screen, and give every line a hard yes or no before the order ticket opens. The two minutes this takes filter more losses than any indicator will.
Related Concepts Worth Mastering
Two neighboring ideas make breakers far easier to read. The sweep that starts every breaker is a stop raid by another name, and the guide to stop hunting in forex explains whose orders get run and why raids cluster at obvious levels. The break itself only counts when it moves with intent, and the article on displacement in trading shows how to grade that burst of speed objectively. Study both, because a breaker is simply their combination: a stop raid, then displacement, then a retest.
Limitations and Honest Caveats
Breaker blocks fail, and they fail in predictable ways. Strong trends often skip the retest entirely, so waiting for the pullback means missing clean moves. Meanwhile, ranging markets create the opposite problem: sweeps and breaks stack on both sides, and each new breaker cancels the last. Hence a breaker in mid-range chop is closer to noise than signal.
Depth is another issue. Price can pierce the zone by several pips, take out tight stops, and only then turn in the expected direction. Also, scheduled news releases can blow through any level regardless of structure, so check the calendar before trusting a retest. No honest trader can quote a reliable success percentage for the pattern, because the figure shifts with market, session, and skill. Truly, the pattern only earns its keep inside context: higher-timeframe bias, a genuine liquidity sweep, and clear displacement. Treat any breaker missing one of those elements as unproven.
A failure walkthrough on EURUSD
Here is what failure looks like on the chart, because you will meet it often. EURUSD sweeps a low at 1.0710, displaces up through the 1.0748 swing high, and leaves a bullish breaker at 1.0738-1.0752. The retest arrives late in the New York afternoon, outside any kill zone. Price dips into the zone, bounces six pips, then stalls. On the next hour, a full-bodied candle closes at 1.0729, clearly through the breaker low. That close is the invalidation. The flip failed, the trapped shorts escaped without pain, and the level now means nothing.
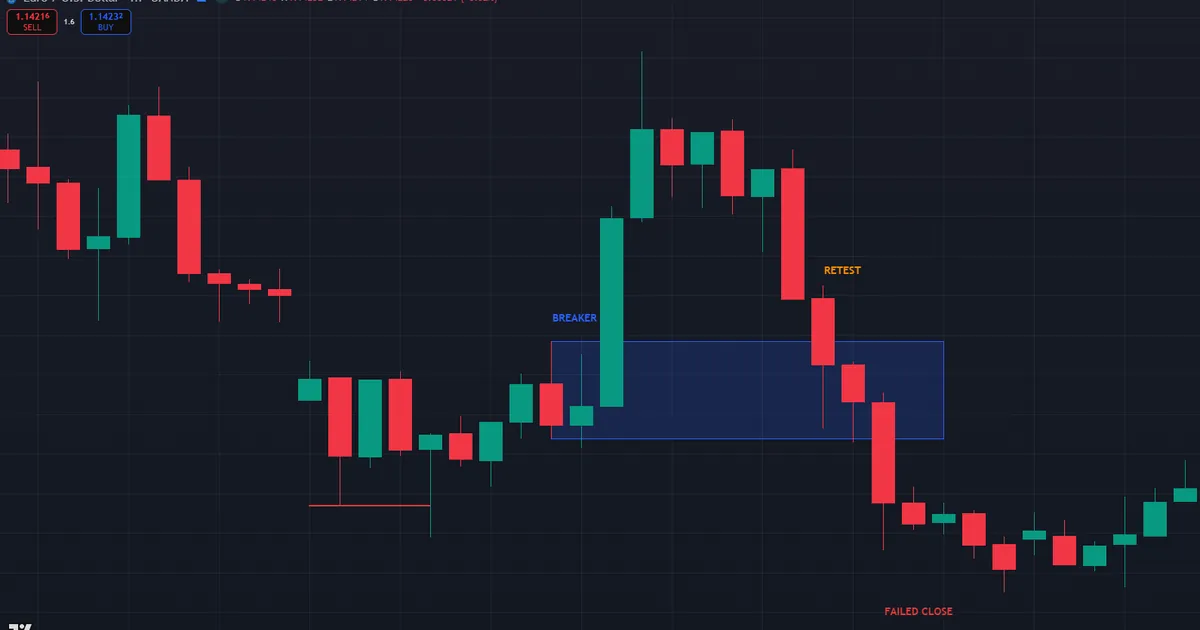
The rule that limits the damage is simple: one decisive close back through the flipped zone ends the trade, whatever the stop distance still allows. Exit, then log the failure. Note the session, how deep price penetrated before failing, and whether the higher-timeframe draw actually agreed with the entry. Most failed breakers in a journal share a cause, usually a counter-trend bias or a dead-hour retest, and that record turns losses into filter rules.
FAQ
What is a breaker block in simple terms?
It is an order block that failed. Price broke through the zone after sweeping liquidity, so the level flipped: old support now acts as resistance, and old resistance now acts as support. Then traders enter when price retests the flipped zone.
How is a breaker block different from a mitigation block?
The sweep is the difference. A breaker forms after price takes out the prior swing point before reversing. Instead, a mitigation block forms when price reverses without that raid. Both flip polarity, yet only the breaker involves trapped stop-run traders.
Does every breaker block get retested?
No. Strong displacement can run for many bars before any pullback, and some retests never come. Missing a move is a normal cost of the model; chasing without a retest breaks its risk logic.
What timeframe works best for breaker blocks?
The pattern appears on every timeframe. Still, many ICT traders mark breakers on the one-hour or four-hour chart, then time entries on the five-minute chart during a kill zone. Higher-timeframe zones tend to produce cleaner reactions.
What invalidates a breaker block?
A decisive candle close back through the flipped zone. Wicks into the zone are normal penetration; a full-bodied close beyond it means the flip failed. Then the level loses its meaning, and the trade idea ends there.
Is the breaker block strategy dependable on its own?
No single pattern is. Breakers work best with a liquidity sweep, clear displacement, and higher-timeframe alignment, and they still fail regularly even then. Results are not guaranteed; past performance is not indicative of future results.
External references
- For background on this concept, see Support and Resistance Basics at Investopedia.
- For broader market context, see Support and Resistance on Wikipedia.

About the author
Written by Dominic Walsh, a Forex trader and MT4/MT5 indicator, Expert Advisor and script developer. Every tool on forexmt4systems.com is tested on live charts before release and ships with ready-to-use compiled MT4 (.ex4) and MT5 (.ex5) files. Learn more about the trader and developer behind this site.
How we build, test and correct every tool: Editorial & Testing Policy. Trading carries risk; see the disclaimer.