
Learning how to use stochastic oscillator signals turns a busy chart into a simple read of momentum and timing. The tool tracks where price closes inside its recent range, and that single idea powers crossovers, extremes, and divergence alike.
This guide shows how to use stochastic oscillator readings in real forex trades. So by the end you will read the %K and %D cross, tell an overbought market from a stretched one, and know when the tool helps and when it lies.
George Lane popularised the stochastic in the late 1950s, and the logic still holds today. Momentum tends to shift before price does, so a close near the top or bottom of the range hints at what comes next. That early read is exactly why traders keep it on the chart.
How to Use Stochastic Oscillator Signals in Forex
The stochastic answers one question. Where did price close relative to its high-low range over the last set of bars? A close near the top pushes the reading high, and a close near the bottom drives it low.
Two lines carry that answer. The %K line is the raw calculation, and the %D line is a short moving average of %K that smooths the noise. Because %D lags %K slightly, the two lines cross, and those crosses form the core signals.
The scale runs from zero to one hundred. Readings above 80 mark an overbought zone, and readings below 20 mark an oversold zone. So the tool frames both the speed of the move and the stretch of the current push in one small window.
Look at a live read first. The chart shows EURUSD on the one-hour timeframe with the standard Stochastic(14,3,3). Price dips into a support area near 1.1310, the reading slides below 20, and then the %K line crosses up through %D. That single frame holds the oversold dip and the turn signal together.
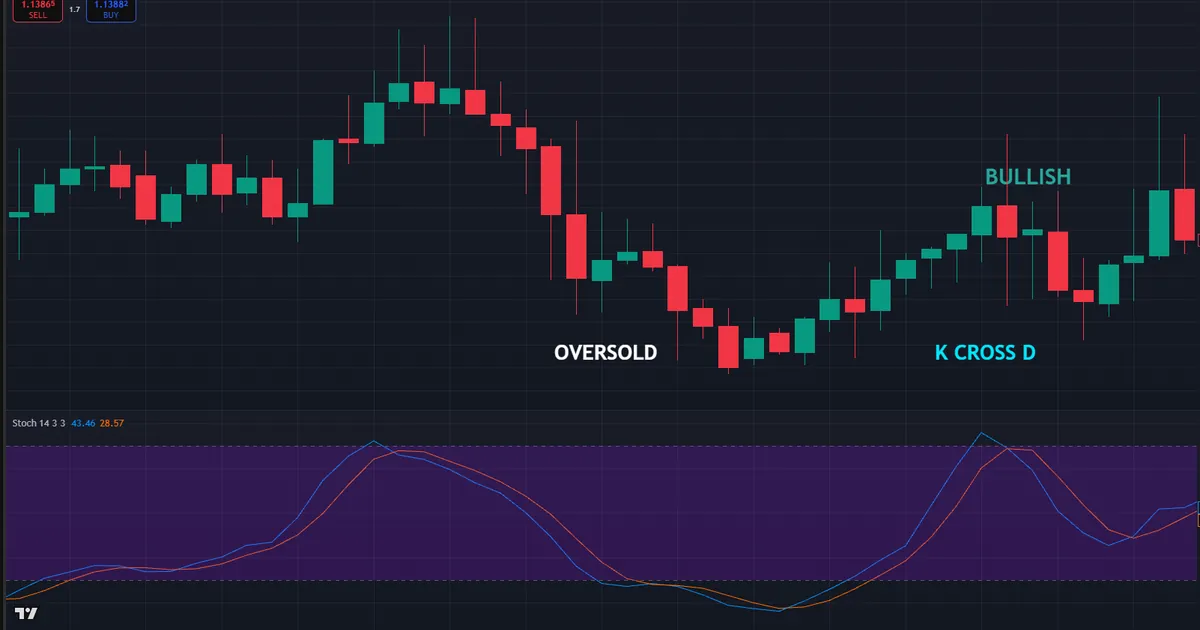
Trace the logic from left to right. First price fell and the stochastic sank into oversold. Then the selling slowed, so the reading curled up. Finally %K crossed above %D, which is the classic bullish trigger. Because each step followed the last, the signal read cleanly.
Why does this matter for real trades? The stochastic gives you timing inside a bigger plan, not a blind buy or sell. So an oversold cross means one thing inside a range and something different inside a strong downtrend. Read the context first, and the same cross stops sending mixed messages.
The Math Behind the Two Lines
The formula is small, so learn it once and reuse it forever. Four numbers drive everything you see on the chart.
- The lookback. The default 14 sets how many bars form the high-low range. A shorter length reacts faster, while a longer one smooths the swings.
- The %K line. This compares the current close with that 14-bar range, scaled from zero to one hundred. A high value means price closed near the top of its recent range.
- The %D line. This is a 3-period moving average of %K, the slower and smoother of the two lines. It filters the jitter and confirms the turns.
- The smoothing. The final 3 applies a light average to %K itself, which is why the standard setting reads 14, 3, 3 and behaves calmly.
So the two lines are not mystery signals. They simply measure closing strength inside a range and smooth that read twice. The concept graphic below shows how %K leads and %D follows through each swing.
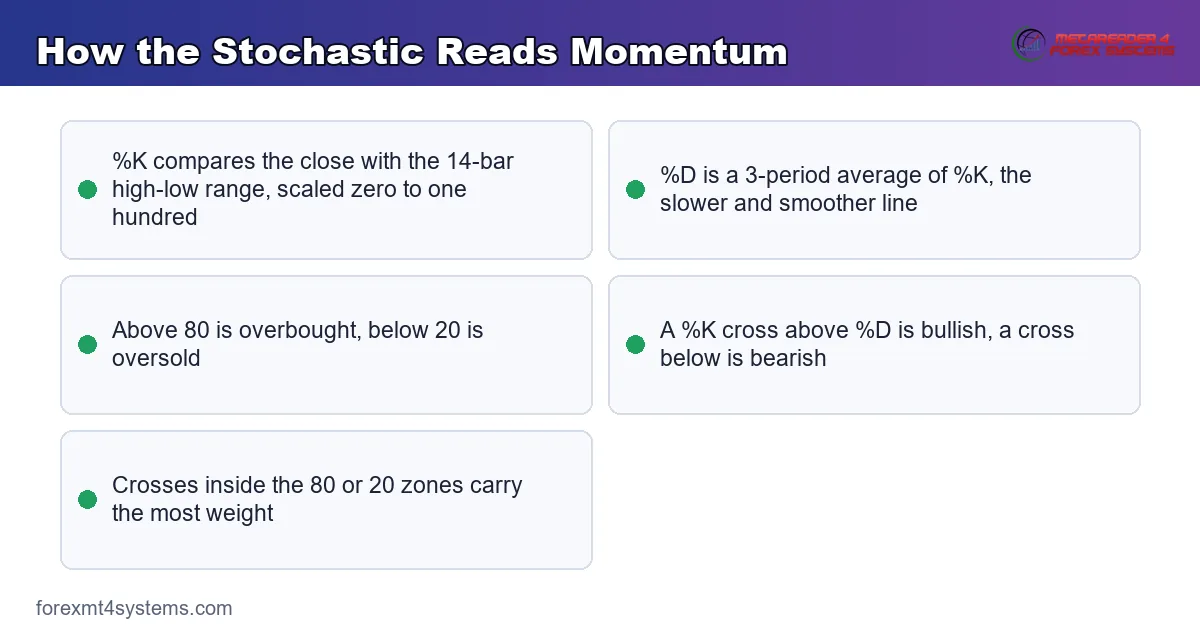
Notice the practical takeaway. Because %K reacts first, it can whip around in fast markets and trigger early. The slower %D acts as a brake, so waiting for both lines to agree filters many of the false starts that catch impatient traders.
Fast, Slow, and Full Versions
You will meet three flavours of the tool, and the names matter less than the smoothing. The fast stochastic reacts quickly and prints many signals. A slow stochastic adds a smoothing pass, so it lags a touch but reads far cleaner.
The full stochastic lets you set every input yourself. Most forex traders stick with the slow or full version at 14, 3, 3, since that balance suits the hour and four-hour charts. Start there, and change the numbers only when the reads feel too jumpy or too sluggish for your pairs.
Reading the Three Core Signals
The stochastic produces three main signals, and each answers a different need. Learn all three, then let the market context decide which one to trust on any given day.
The Crossover
A crossover is the bread-and-butter trigger. When %K crosses above %D, momentum is turning up, and when %K crosses below %D, momentum is turning down. So the cross names the moment the short-term push flips direction.
Crossovers carry more weight inside the extreme zones. A bullish cross under 20 is stronger than one in the middle of the scale, since the market was stretched to the downside first. Meanwhile a cross in the neutral middle often means little, so many traders simply ignore it.
The Overbought and Oversold Zones
The 80 and 20 lines flag stretched conditions. Above 80 the recent closes cluster near the top of the range, and below 20 they cluster near the bottom. So the zones warn that price has run far and fast in one direction.
Still, a zone reading is not an instant reversal call. In a strong trend the stochastic can pin near 80 or 20 for a long time while price keeps running. So treat the zones as context, and wait for a cross or a structure break before you act.
Stochastic Divergence
Divergence is the early-warning signal. When price makes a higher high but the stochastic makes a lower high, buying momentum is fading. When price makes a lower low but the stochastic makes a higher low, selling momentum is fading.
Because momentum shifts before price, divergence can flag a turn a few candles ahead. Our guide to divergence in trading covers the reads in full, and the stochastic shows them as clearly as any oscillator on the chart.
Fitting the Stochastic Into a Workflow
Settings come first, and simpler is safer. Stick with the slow Stochastic(14,3,3) and the 80/20 lines until the reads feel natural. Because a stable setting keeps your signals honest, resist the urge to tinker in the middle of a session.
Timeframe choice shapes the signal quality. On the one-hour and four-hour charts, the crosses have room to breathe and fewer false triggers appear. Meanwhile the one-minute chart fires so many crosses that the tool becomes noise rather than guidance.
The single most important step is reading the trend first. In a range, trade the stochastic both ways, buying oversold and selling overbought. In a trend, take only the crosses that agree with the direction, since counter-trend signals fail far more often.
Pairing lifts the hit quality further. A moving average shows the trend at a glance, so a stochastic buy that sits above a rising average carries more weight. Add a support or resistance level, and the timing signal lands inside a location that already matters. That stacking of trend, level, and momentum is what separates a planned trade from a hopeful guess, and it costs only a few seconds to check before you click the button.
Trending Versus Ranging Markets
This one distinction separates good stochastic readers from frustrated ones. The same overbought reading means opposite things in different markets.
In a healthy range, an overbought reading near 80 often marks the top of the swing, so a bearish cross there sets up a fade back toward the middle. The oversold side mirrors it, offering a buy near 20. Because the range caps both ends, the stochastic times the turns nicely.
In a strong uptrend, that same reading near 80 is normal, not a sell. Price can stay overbought for dozens of candles while the trend runs. So fading every extreme in a trend bleeds the account, while buying the shallow oversold dips aligns with the move instead.
A Worked Example on GBPUSD
Now trace a full setup from signal to exit. The chart shows GBPUSD on the one-hour timeframe inside a shallow range near 1.3400. Price drifts down to the range floor, the stochastic slips below 20, and the %K line curls up through %D.
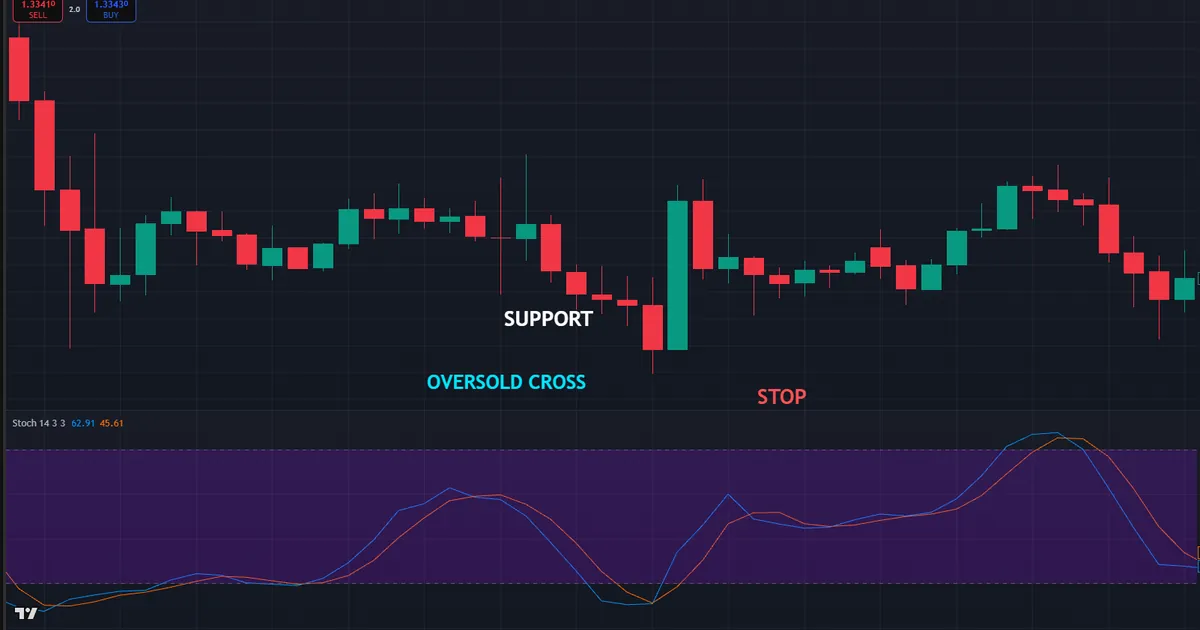
Walk the read step by step. First price reached the known support near 1.3380, so the location already mattered. Then the stochastic printed its oversold reading, which flagged a stretched dip. Because the %K crossed up through %D at that floor, the timing and the level lined up.
Reading the Trade Step by Step
The entry followed the confirmation. A long sat just above the range floor once the bullish cross closed, with a stop below 1.3370 under the support. So the risk stayed small and clearly defined from the very start.
The target used the range itself. Price had bounced between 1.3380 and 1.3440 for hours, so the top of the range gave a logical first exit. Because the range framed both the stop and the target, the whole plan sat on the chart before the trade opened.
Follow-through rewarded the patience. Price lifted off the floor, the stochastic climbed toward 80, and the move stalled near the range high exactly where expected. Meanwhile the invalidation stayed simple, since a close below the floor would have killed the idea outright.
Download the complete indicator database
Put these concepts on your charts. One email unlocks the full library of 1,380+ indicators with compiled MT4 and MT5 files, plus my TradingView scripts. No paywall, no spam, unsubscribe any time.
Get free access to my indicator database
One email unlocks 1,380+ free MT4, MT5 and TradingView indicators — the complete library. No single-tool download; you get the whole database.
Common Mistakes and How to Fix Them
The tool is simple, yet the same errors repeat on every pair. Most trace back to one decision, mapped in the graphic below: read the trend before you read the extreme. So the fixes below all flow from getting that context right.

Fading Every Overbought Reading
The most common trap is selling every reading above 80. In a strong uptrend that reading is normal, so the fade fights the move and fails. Instead check the trend first, and fade extremes only inside a genuine range.
Trading Crosses in the Middle
A cross near the 50 line usually means little, since price is neither stretched nor at a turning point. Chasing those middle crosses stacks up small losses fast. So wait for crosses inside the 80 or 20 zones, where the setup carries real context.
Using the Stochastic Alone
The tool times momentum, not trend or structure. So a stochastic signal with no level and no trend read is only half a trade. Pair it with a moving average and a support map, and the same cross suddenly makes far more sense.
Over-Tweaking the Settings
Traders often chop the length shorter to catch turns sooner, then drown in false signals. A faster stochastic reacts sooner but whips more. Instead keep the 14, 3, 3 default, since a stable setting builds the pattern recognition that actually helps.
Ignoring the Bigger Timeframe
An oversold cross on the five-minute chart means little if the daily trend points hard down. So glance at the higher timeframe before you trust a small-chart signal. When the two agree, the cross carries far more weight.
A Simple Stochastic Checklist
Run this short list before you act on any stochastic signal.
- Read the trend. Decide whether the market is ranging or trending before anything else.
- Check the zone. Confirm the signal sits inside the 80 or 20 extreme, not the neutral middle.
- Wait for the cross. Take the %K and %D cross rather than the raw zone touch.
- Find a level. Look for support under a buy or resistance above a sell.
- Match the direction. In a trend, trade only the crosses that agree with it.
- Size the risk. Set the stop beyond the swing, then let a position size calculator fix the lot.
Work the list top to bottom and most weak signals filter themselves out. Because each step demands context, the crosses that survive tend to be the ones worth trading.
When the Stochastic Fails
No tool is a promise, and the stochastic fails often enough to respect. The most common failure is a strong trend that pins the reading in the extreme while price keeps running.
Picture a EURUSD uptrend near 1.1400. The stochastic climbs above 80 and a trader shorts the overbought reading, expecting a drop. Then price simply grinds higher for hours, the reading stays pinned near the top, and the short bleeds against a rising market.
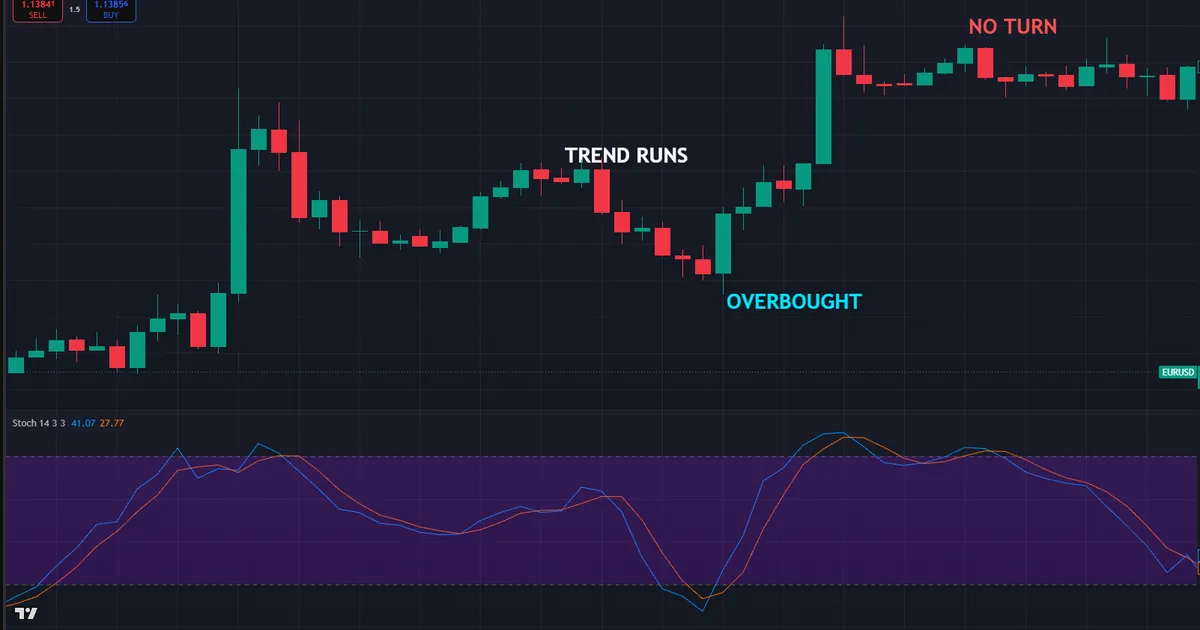
So what went wrong? The market was trending, not ranging, so the overbought read was normal rather than a sell. Because the trader faded strength without checking the trend, the signal became a trap instead of a setup.
Here is the calmer way to handle it. First read the trend, then fade extremes only inside a range. In a trend, wait for the shallow oversold dips that align with the move. Because the risk stayed small, the occasional bad read was a scratch rather than a wound.
News can also break the signal in an instant. A surprise release sends price and momentum in the same direction, blowing past any overbought or oversold read. So step aside around scheduled events and let the calm return before you trust the tool again.
Thin liquidity distorts the reading too. During the quiet hours between sessions, small orders swing price and jerk the stochastic around. Because those crosses form on light volume, they often reverse the moment real flow returns, so treat late-session signals with extra caution. Waiting for the London or New York session to open usually gives you cleaner, more tradable reads.
How Reliable Is the Stochastic
Honesty beats hype with any oscillator. The stochastic is a timing tool, not a crystal ball, and it shines brightest at the edges of ranges and at the end of stretched moves. So its value rises when a market rotates between clear highs and lows.
Reliability climbs when several factors line up. A cross at a known support or resistance beats one in open space. A cross that agrees with the higher timeframe beats one that fights it. Because each layer of context filters noise, stacked signals simply hold up better than lone crosses.
Reliability drops in strong, one-way trends. When price runs hard, the reading pins in the extreme and the crosses there fail again and again. So a trending chart is the worst place to fade the tool, and reading the trend first is the fix.
Set Honest Expectations
Every method has losing trades, and the stochastic is no exception. Some crosses fail, some stall, and some run to a clean target. Because outcomes vary, the edge lives in a repeatable process with tight risk, not in any single perfect signal.
Keep a record so the tool earns your trust over time. A short log of each stochastic trade, its context, and its result shows which conditions suit your style. Our trade journal gives you a simple place to track that, and the data beats a hunch every time.
Pairing With a Trend Filter
A moving average makes the trend obvious, so it pairs neatly with the stochastic. When price sits above a rising average, favour the bullish crosses and skip the bearish ones. When price sits below a falling average, do the reverse and trade only the sells.
This simple filter removes most counter-trend traps in one step. Because the average defines the direction and the stochastic times the entry, the two tools cover different jobs without stepping on each other. That division of labour is why the pair works so well on the hour and four-hour charts.
Related Concepts to Study Next
The stochastic connects to a web of momentum ideas, and two deserve your next reading hour. To ground the tool in its basics, read our primer on the stochastic oscillator, which covers the calculation and history. Meanwhile a direct comparison sharpens your choice, so our guide on RSI versus stochastic shows when each tool shines.
For automated help, the wider set of oscillator indicators plots the %K and %D lines for you, while the overbought and oversold indicators archive covers the 80 and 20 tools around them. Tools speed the work, yet the logic above still carries the trade.
FAQ
What are the best stochastic settings for forex?
The slow Stochastic(14,3,3) with 80 and 20 lines suits most forex charts. It reads cleanly on the one-hour and four-hour timeframes without too many false crosses. Keep the default until you have a clear reason to change it, since a stable setting builds better instincts.
What does an overbought stochastic mean?
A reading above 80 means recent closes cluster near the top of the range, so price has pushed up hard and fast. In a range, that often marks a swing high. In a strong uptrend, it is normal, so wait for a cross before you act.
Should I trade the stochastic in a trend?
Yes, but only in one direction. In an uptrend, use the tool to time the shallow oversold dips and buy with the trend. Fading every overbought reading in a trend fails often, so match your signals to the larger move.
What is the difference between %K and %D?
The %K line is the raw calculation of closing strength inside the range, and it reacts first. Its %D partner is a short moving average of %K, so it lags slightly and reads more smoothly. The cross between them forms the core signal.
Does the stochastic work for day trading?
It can, provided you respect the trend and the timeframe. The one-hour and four-hour charts give the cleanest crosses for intraday work. Very fast charts fire too many signals, so many day traders confirm the read on a higher timeframe first.
Can I use the stochastic on its own?
You can read it alone, but you should not trade it alone. The stochastic times momentum, so it reads best beside a trend map, a level, and firm risk control. Manage risk on every trade. Results are not guaranteed; past performance is not indicative of future results.
External references
- For background on this concept, see George Lane on Wikipedia.
- For broader market context, see The Stochastic Oscillator at Investopedia.

About the author
Written by Dominic Walsh, a Forex trader and MT4/MT5 indicator, Expert Advisor and script developer. Every tool on forexmt4systems.com is tested on live charts before release and ships with ready-to-use compiled MT4 (.ex4) and MT5 (.ex5) files. Learn more about the trader and developer behind this site.
How we build, test and correct every tool: Editorial & Testing Policy. Trading carries risk; see the disclaimer.