
Learning to trade Bollinger Bands with RSI pairs a volatility envelope with a momentum gauge, so one tool shows where price stretches and the other shows whether that stretch has any force behind it. Used alone, a band touch tempts too many blind fades. Together, the two readings filter each other.
This guide shows how to trade Bollinger Bands with RSI in plain steps. So by the end, you will know when a band touch means reversal, when it means continuation, and how the 14-period RSI settles that question on a live EURUSD chart.
How Bollinger Bands With RSI Work Together
Bollinger Bands wrap a 20-period simple moving average inside two outer lines, each set two standard deviations away. Because the bands breathe with volatility, they widen in fast markets and pinch in quiet ones. A touch of the upper or lower band simply marks a statistically stretched price, nothing more.
The RSI adds the missing half. It rides a fixed 0 to 100 scale and reads the balance of recent gains against recent losses. So when price tags a band, the RSI tells you whether momentum agrees with the move or quietly fades against it.
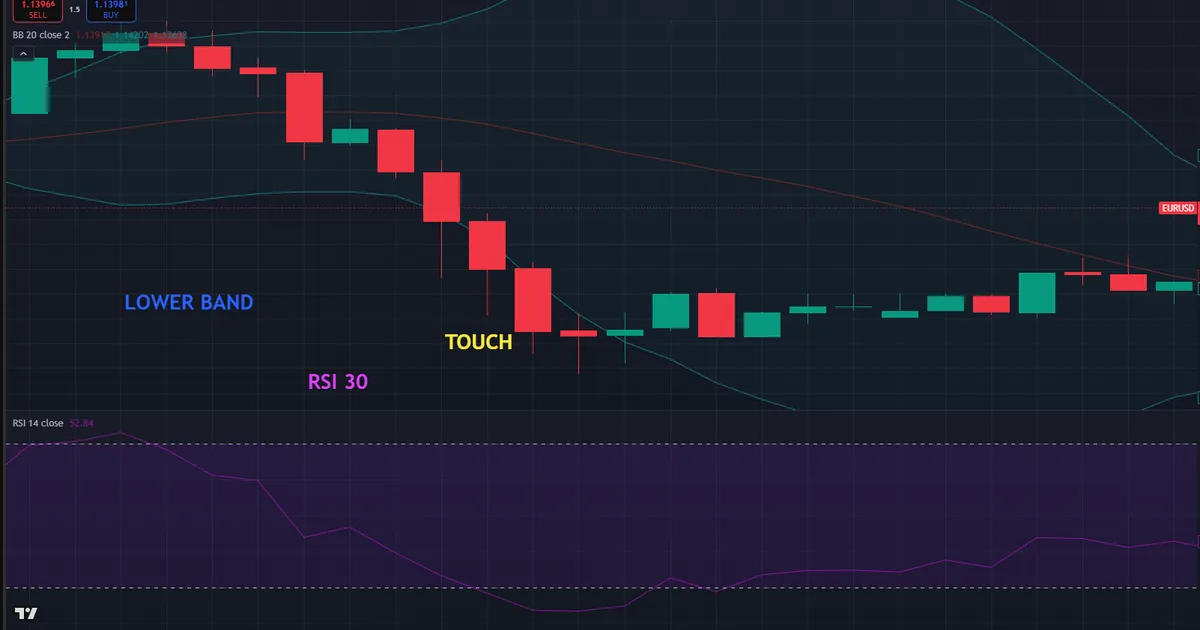
Look at a concrete frame. The chart shows EURUSD on the one-hour timeframe with Bollinger Bands (20, 2) drawn over price and a 14-period RSI in the lower pane. Price pokes the lower band near 1.132 while the RSI sits around 34, close to its oversold line. That single picture holds both halves of the setup.
Reversal Touch Versus Continuation Touch
Not every band touch means the same thing. A touch during a flat range often marks a turning point, because price keeps snapping back to the middle. A touch during a strong trend often marks strength, because price rides the band like a rail. So the RSI helps you tell these two cases apart.
Here is the split in practice. When price taps the lower band and the RSI holds above 30 or curls up, buyers still have a pulse, so a bounce looks likely. When price rides the upper band while the RSI pins above 70 for many bars, the trend is strong, so fading it invites pain.
What the Band Width Tells You
The distance between the two bands carries its own message. Wide bands mean volatility has expanded, so recent bars covered a lot of ground. Narrow bands mean the market has gone quiet, and quiet rarely lasts on a liquid pair.
Read that width alongside the RSI. When bands widen as price tags an edge, the move has energy, so a trend read fits. When bands pinch and price barely reaches an edge, the market drifts, so a range read fits better. Because width and momentum together frame the touch, they cut down on guesswork.
The Mechanics Behind Each Tool
The math is small, so learn it once. A handful of steps build both tools, and every signal flows from them.
- The middle band. Take a 20-period simple moving average of closing price. This line acts as the fair-value anchor for the whole envelope.
- The outer bands. Measure the standard deviation of price over the same 20 bars, then plot lines two deviations above and below the middle. Wider bands mean higher volatility.
- The squeeze. When volatility drops, the bands narrow toward the middle. A tight squeeze often precedes a sharp expansion, so it hints a move is coming without naming its direction.
- The RSI ratio. Average the up-closes and down-closes across 14 bars, then map that ratio onto a 0 to 100 scale. A reading near 50 means gains and losses balance.
- The RSI zones. Because the scale never runs away, the 70 and 30 marks stay meaningful on every pair. Above 70 flags a stretched rally, and below 30 flags a stretched drop.
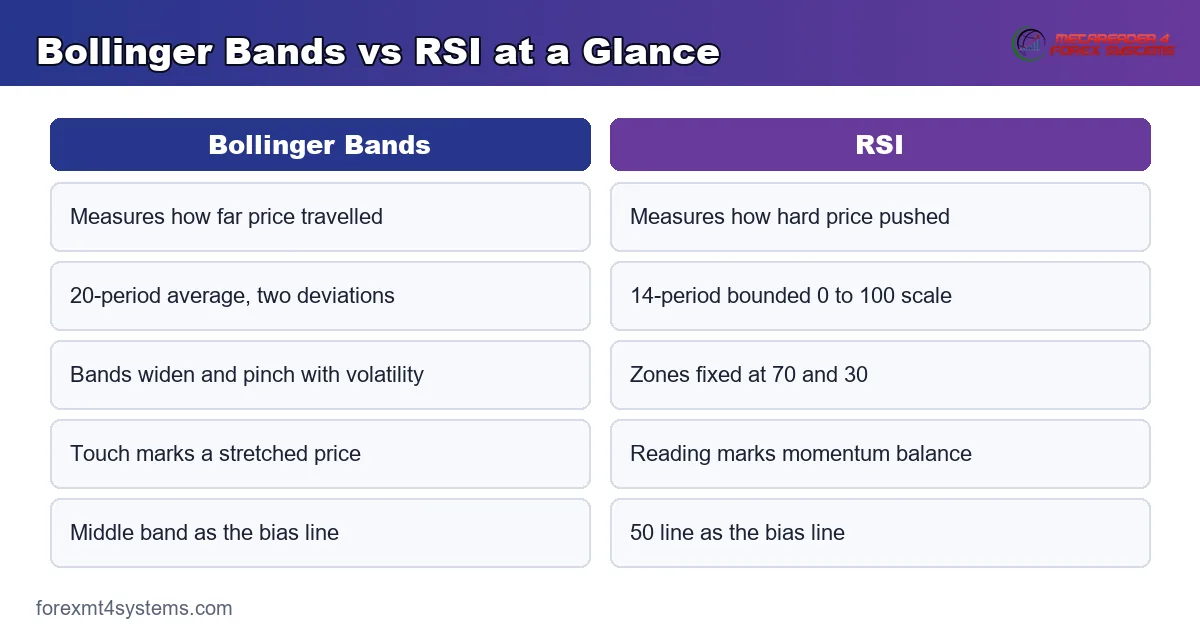
So the bands measure how far price has travelled, while the RSI measures how hard it pushed to get there. The diagram below lines the two builds up side by side.
Why the Pair Beats Either Tool Alone
A lone band touch fools traders often. Price can hug the upper band for a dozen bars in a trend, so a naive short bleeds out fast. The RSI plugs that gap by showing whether the push still has strength.
The reverse holds too. A lone RSI at 30 does not mark a floor, since momentum can stay pinned in a slide. Yet when the lower band and an oversold RSI line up at a prior support level, the case for a bounce grows far stronger than either signal alone.
Reading %B and Bandwidth as Extras
Two companion readings sharpen the picture further. The %B value shows where price sits inside the bands, from zero at the lower line to one at the upper. So a %B above one confirms a true break of the upper band rather than a mere brush.
Bandwidth tracks the gap between the bands as a single number. A falling bandwidth flags a squeeze, and a rising one flags expansion. Because these two extras quantify what your eyes half-see, they make the setup easier to test and to journal. Still, treat them as support for the core band-plus-RSI read, not as a replacement for it.
Fitting the Setup Into a Workflow
Standard settings carry weight because so many traders watch them. Self-fulfilling attention gives the 20, 2 bands and the 14 RSI real pull on the chart.
Keep the defaults while you learn the pair. The Bollinger Bands default to a 20-period average with two standard deviations, and the RSI defaults to 14 with 70 and 30 zones. Those numbers suit the one-hour and four-hour charts that swing traders favour.
Choosing a Timeframe and Pair
Match the timeframe to your patience. On the fifteen-minute chart, the pair fires often but noisily, so scalpers must act fast. On the four-hour and daily charts, signals come slower yet hold up better, which suits a calmer routine.
Liquid pairs read cleanest. Majors such as EURUSD and GBPUSD respect the bands well, because steady flow keeps volatility measurable. Thin crosses jump around, so their bands whip and their touches mislead more often.
Reading the Band and the RSI in Order
Sequence matters, so follow a fixed order. First check the trend on a higher timeframe to set your bias. Then wait for price to reach a band. Finally read the RSI to confirm or reject the touch before you act.
This order stops the tail from wagging the dog. Because the trend frames every touch, you fade band tags only in a range and trade them as pullbacks inside a trend. So the same tool set serves two market states without contradiction.
Combining the Pair With Price Structure
Indicators read cleaner beside simple structure. A prior swing high, a round number, or a session high all mark places where price often reacts. So when a band touch and an RSI extreme land on such a level, the odds tilt further in your favour.
Draw those levels before the touch, not after. Marking a support shelf near 1.128 in advance keeps you honest when price arrives. Because the plan came first, you react to a level you already trusted rather than one you rationalise mid-trade. That discipline turns two indicators into a repeatable routine.
Worked Example: A Range Bounce on EURUSD
Picture EURUSD drifting sideways between roughly 1.128 and 1.146 on the one-hour chart. The daily trend looks flat, so a range playbook fits. Price now slides toward the lower edge of that range.
Watch the two tools line up. Price tags the lower Bollinger Band near 1.130, and at the same moment the RSI dips to about 32 before curling back above 35. The chart below marks that pair of readings at the band.
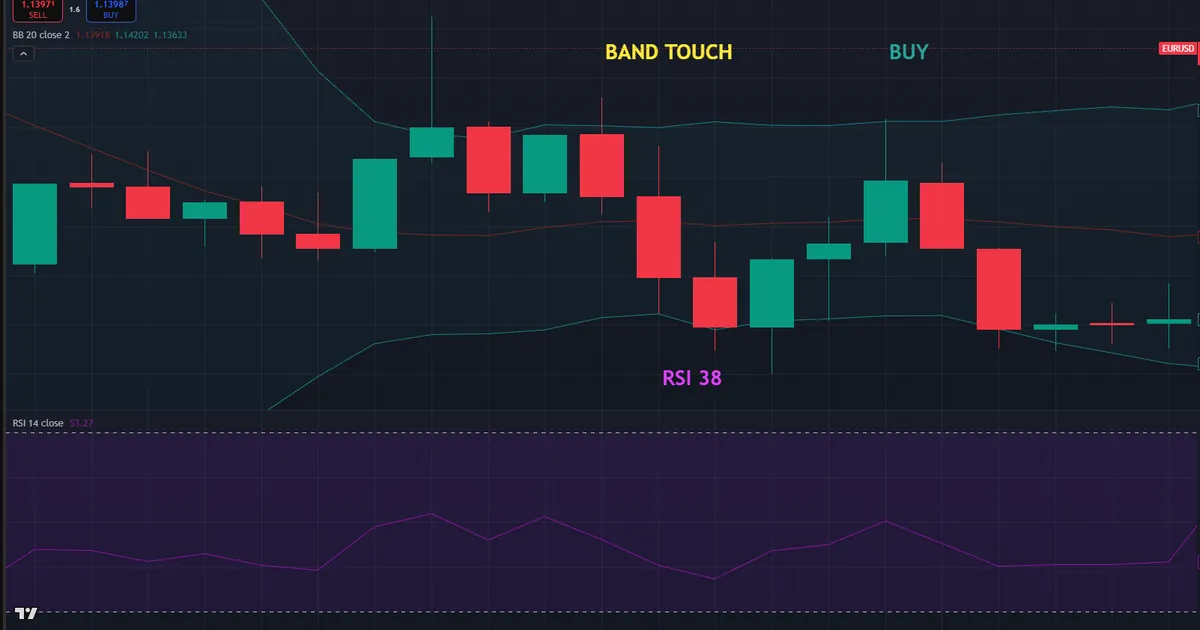
Now the trade builds itself. A trader buys as a bullish candle closes near 1.131, with a stop below the range floor around 1.126. That places roughly 50 pips of risk on the position. Because the RSI turned up rather than sinking further, momentum backed the band touch.
The follow-through rewarded the read. Price climbed back toward the 20-period middle band near 1.138, then pushed on toward the upper band close to 1.145. So the middle band gave a first target and the upper band gave a second, each flowing from the envelope itself.
Note where the stop sat. The range floor near 1.126 had held twice before, so that level made a clean line in the sand. Because the invalidation rested under real structure, a normal wobble would not shake the trade out early.
Sizing the Position Before Entry
Risk comes first, not last. With a 50-pip stop fixed, position size follows from the account risk you accept per trade. Our free forex volatility calculator gauges the typical range so your stop sits beyond the noise rather than inside it.
Then keep the risk steady across trades. A fixed fraction of the account on each idea smooths the equity curve, so one losing bounce never dents the balance hard. Because the size scaled to the stop, the plan stayed consistent from setup to setup.
A Continuation Read on the Same Pair
Flip the setup to see the trend case. Now EURUSD trends up on the four-hour chart, and price pulls back toward the middle band near 1.140. The RSI dips to about 45, holds well above 30, then turns higher as the pullback ends.
That combination signals continuation, not reversal. Because the RSI never reached oversold, the dip looks like a pause inside a healthy uptrend. So a trader buys the resumption toward the upper band near 1.150, with a stop under the middle band. Here the same pair read a trend pullback instead of a range bounce, which shows how flexible the setup stays once the market state is clear.
Download the complete indicator database
Put these concepts on your charts. One email unlocks the full library of 1,380+ indicators with compiled MT4 and MT5 files, plus my TradingView scripts. No paywall, no spam, unsubscribe any time.
Get free access to my indicator database
One email unlocks 1,380+ free MT4, MT5 and TradingView indicators — the complete library. No single-tool download; you get the whole database.
Common Mistakes and How to Fix Them
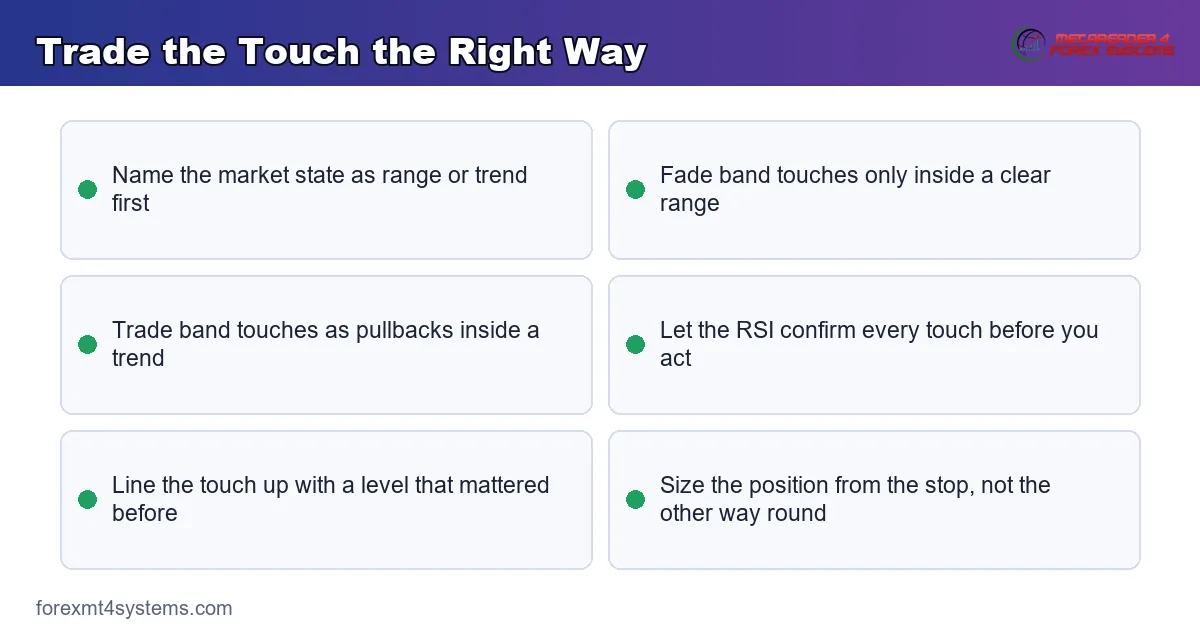
The pair looks simple, yet the same errors repeat on every timeframe. Most trace back to trading a band touch without checking the RSI, and the fixes follow beneath the graphic.
Fading Every Band Touch
A touch of the upper band does not mean sell. In a strong trend, price rides that band for many bars while the RSI stays above 70. So treat a touch as a question, then let the RSI answer whether momentum still backs the move.
Ignoring the Middle Band
Many traders watch only the outer lines. Yet the 20-period middle band acts as a magnet and a bias line. Above it, the range tilts bullish, and below it, the tilt turns bearish. So read the middle band before you judge any touch of the edges.
Trusting the RSI Number Alone
An RSI at 30 is not a buy on its own. Momentum can stay pinned low through a whole leg down. Instead, wait for the reading to line up with a lower band touch at a level that mattered before, so two signals agree rather than one.
Forgetting the Higher Timeframe
A bounce signal on the five-minute means little against a falling daily trend. Truly, the higher timeframe frames every lower-timeframe touch. So check the daily direction first, then trade band tags with that bias, not against it.
Chasing the Squeeze Blind
A Bollinger squeeze warns that volatility will expand, yet it never names the way. Guessing a direction inside the pinch burns money on false starts. Instead, wait for price to break the squeeze and for the RSI to lean the same way before you commit.
Using Two Tools From the Same Family
Some traders stack the RSI with another momentum tool and call it confirmation. Yet two momentum gauges tend to say the same thing, so they double the noise rather than the insight. The band-plus-RSI pair works because volatility and momentum measure different things. So keep one tool per job, and let each cover ground the other cannot.
A Pre-Trade Bollinger and RSI Checklist
Run this short list before every entry. A few seconds here saves hours of regret later. So slow down, tick each item, and let a failed check keep you out of a marginal trade.
- Higher-timeframe trend read on the daily and four-hour charts.
- Market state named as range or trend, which decides fade or follow.
- Price at a Bollinger Band, not floating in the middle.
- RSI confirming the touch, curling from an extreme in your favour.
- A level that mattered before, near the band touch.
- Stop distance set from structure and a volatility read.
- Entry, stop, and target planned before the trade goes live.
When Bollinger Bands and RSI Fail
Study the failure case as hard as the winner. Here is a common one. EURUSD breaks out of a long squeeze and trends hard higher on the one-hour chart. A trader shorts each upper band touch, sure the stretch must snap back.
Then the losses stack up. Price keeps riding the upper band, the RSI locks above 70 for hours, and every short stops out a few pips higher. The chart below shows that trend, with price walking the upper band while the pinned RSI marks the trap.
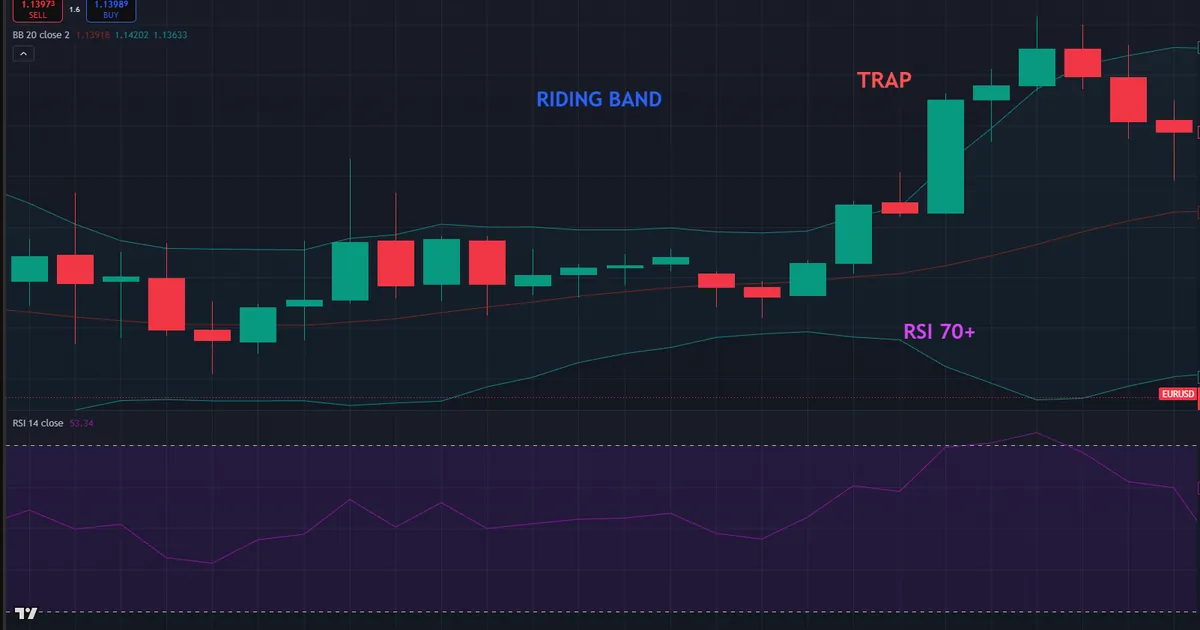
So what went wrong? The market had a strong trend, and band touches in a trend mark strength, not exhaustion. Because the RSI stayed pinned high, it screamed continuation rather than reversal. Hence the rule that saves the account: fade band touches only in a range, never against a powerful trend.
Notice how one skipped step caused the whole mess. The trader never named the market state before acting, so a trend got traded as a range. Had the first checklist item been honoured, none of those shorts would have fired. So the fix costs nothing but a moment of patience at the start.
The Bands Never See the News
Be honest about a shared blind spot. Both tools read only past price, so neither sees a rate decision or a jobs report coming. A single news candle can blow price clean through a band while the RSI lags a beat behind.
So check the economic calendar before you lean on either read. Around a major release, step back and let the dust settle. Because the tools react to price, they react to news even later, and that gap can prove costly.
Standard Deviation Assumes Normal Moves
Be honest about the math too. The bands rest on standard deviation, which assumes price behaves in a fairly normal spread. Yet markets gap and spike more often than that model expects. So a two-deviation band gets pierced more than the textbook suggests, which is why confirmation matters.
Test the Pair Before You Trust It
Backtesting turns a nice theory into a real edge or a quiet warning. Scroll back through a year of one-hour EURUSD bars and mark every lower band touch with an RSI curl off oversold. Then note what price did over the next twenty bars, so a pattern shows itself in the numbers rather than in your hopes.
Keep the journal simple and honest. Record the market state, the levels, the RSI value, and the outcome for each trade. Because a written record cannot flatter you, it surfaces the setups that pay and the ones that leak. Over a few dozen samples, the range-versus-trend rule usually proves its worth on your own charts.
Related Concepts to Study Next
The pair connects to a web of sibling ideas, and a few deserve your next reading hour. Start with our full walk-through of how to use Bollinger Bands for a deeper look at the squeeze and the middle band. Then read our Bollinger Bands explained guide to ground the volatility side of the setup.
Two more guides sharpen the momentum half. Because the 14 default suits swing charts, tune it for a faster pace with our notes on RSI settings for day trading. So you can match the RSI response to the timeframe you actually trade.
For hands-free charting, the bands and channels indicators archive plots the envelope for you, while the RSI indicators archive gathers the momentum tools around it. Tools speed the work, yet the logic above still carries the trade. So learn the rules first, and let any indicator plot what you already understand.
FAQ
What settings work best for Bollinger Bands with RSI?
Most traders start with Bollinger Bands at 20 periods and two standard deviations, paired with a 14-period RSI using 70 and 30 zones. Those defaults suit the one-hour and four-hour charts. Test any change across many charts before you rely on it.
Does a band touch always signal a reversal?
No, and that is the core lesson. A touch marks a stretched price, not a certain turn. In a range it often precedes a bounce, while in a trend it marks strength. So the RSI decides which case you face.
Can I use this setup for scalping?
Yes, on the five-minute or fifteen-minute chart, though signals come faster and noisier. Keep stops tight and confirm each band touch with the RSI. Because noise rises on low timeframes, expect more false touches and size down to match.
How does the RSI confirm a Bollinger Band signal?
The RSI shows whether momentum backs the touch. A lower band tag with an RSI curling up off 30 supports a bounce. An upper band tag with a pinned RSI above 70 warns of continuation, so you stand aside rather than fade.
Why do both tools fail in strong trends?
In a powerful trend, price rides one band while the RSI locks at an extreme. Both readings then scream continuation, not reversal. So fade signals dry up, and the pair works best as a pullback filter with the trend instead.
Which timeframe suits this pair best?
The one-hour and four-hour charts balance signal frequency against reliability for most traders. Lower timeframes add noise, while higher ones slow the pace. Pick one that fits your routine and manage risk on every trade. Results are not guaranteed; past performance is not indicative of future results.
External references
- For background on this concept, see Relative Strength Index (RSI) at Corporate Finance Institute.
- For broader market context, see Standard Deviation at BabyPips.

About the author
Written by Dominic Walsh, a Forex trader and MT4/MT5 indicator, Expert Advisor and script developer. Every tool on forexmt4systems.com is tested on live charts before release and ships with ready-to-use compiled MT4 (.ex4) and MT5 (.ex5) files. Learn more about the trader and developer behind this site.
How we build, test and correct every tool: Editorial & Testing Policy. Trading carries risk; see the disclaimer.